www.nat-hazards-earth-syst-sci.net/9/315/2009/ © Author(s) 2009. This work is distributed under the Creative Commons Attribution 3.0 License.
and Earth
System Sciences
A Support Analysis Framework for mass movement damage
assessment: applications to case studies in Calabria (Italy)
O. Petrucci and G. Gull`a
CNR-IRPI, Department of Cosenza, Italy
Received: 27 November 2008 – Revised: 3 March 2009 – Accepted: 3 March 2009 – Published: 11 March 2009
Abstract.The analysis of data describing damage caused by
mass movements in Calabria (Italy) allowed the organisation of the Support Analysis Framework (SAF), a spreadsheet that converts damage descriptions into numerical indices express-ing direct, indirect, and intangible damage.
The SAF assesses damage indices of past mass move-ments and the potential outcomes of dormant phenomena re-activations. It is based on the effects on damaged ele-ments and is independent of both physical and geometric phenomenon characteristics.
SAF sections that assess direct damage encompass several lines, each describing an element characterised by a value fixed on a relative arbitrary scale. The levels of loss are clas-sified as: L4: complete; L3: high; L2: medium; or L1: low. For a generic linel, the SAF multiplies the value of a dam-aged element by its level of loss, obtainingdl, the contribu-tion of the line to the damage.
Indirect damage is appraised by two sections accounting for: (a) actions aiming to overcome emergency situations and (b) actions aiming to restore pre-movement conditions. The level of loss depends on the number of people involved (a) or the cost of actions (b).
For intangible damage, the level of loss depends on the number of people involved.
We examined three phenomena, assessing damage using the SAF and SAFL, customised versions of SAF based on the elements actually present in the analysed municipalities that consider the values of elements in the community frame-work. We show that in less populated, inland, and affluent municipalities, the impact of mass movements is greater than in coastal areas.
Correspondence to:O. Petrucci
The SAF can be useful to sort groups of phenomena ac-cording to their probable future damage, supplying results significant either for insurance companies or for local author-ities involved in both disaster management and planning of defensive measures.
1 Introduction
Mass movements, defined as the movements of masses of soil, rock, debris, or mud, usually occur because of the pull of gravity, and are a source of great concern because they can impact numerous victims and cause severe damage. Al-though many types of mass movements are included in the general term “landslide”, the more restrictive use of the term refers only to mass movements where there is a distinct zone of weakness that separates the slide material from more sta-ble underlying material (USGS, 2009).
From a scientific point of view, many factors of mass movements are clear, while several others are not fully un-derstood. Often, the study of these phenomena starts with lessons from the past: understanding both the causes and the consequences of past phenomena can provide useful insight to prevent or mitigate the effects of future ones.
As in other types of natural disasters (Blong, 2003), the impact of mass movements on society depends on the char-acteristics of the phenomenon, but it is also tied to the social and economic framework of the affected area (Remondo et al., 2005), which influences the social vulnerability (Rygel et al., 2006). The approach to damage assessment must be as straightforward and general as possible, while remaining systematic and rigorous (Alexander, 1989).
Ionian Sea Tyrrhenian
Sea
0 40 km
Italy
A
B
N E W
S
1 2 3 4 5 6
7
1367m 1956m
1420m 1649m
1881m
1239m 2248m 1996m
707m 1714m
Fig. 1.Calabria region maps.(A)300 m a.s.l. contour line and peak
altitudes. (B)Simplified geological sketch of the region and
loca-tion of Calabria. (1) Limestone and dolostone; (2) metamorphic and igneous rocks; (3) clays, marls, and evaporitic rocks; (4) sandstones, marly clays, and limestone marls; (5) flysch and clayey formations; (6) conglomerates, sands, and sandstones; and (7) alluvial deposits.
(a) Assessment of damage after the occurrence of the mass
movements.
Damage intensity scales available in the literature, reviewed by Blong (2003), are not expressly designed for mass move-ments: the effects of hazards like earthquakes and cyclones are most commonly investigated (Hollenstein, 2005; Dou-glas, 2007). Often, the damage assessment is focused on large-scale disasters, such as hurricanes (Crandell and Kochkin, 2005) or earthquakes. The analysis may focus on either a single type of damaged element (e.g., houses) (Horie et al., 2003), or a combination of effects (e.g., dam-aged houses and victims) (Hengjian et al., 2003).
Damage assessment can be complicated when, as often oc-curs during heavy rainfall, several landslides occur simulta-neously (Petrucci et al., 2008; Petrucci and Polemio, 2009). In these cases, the identification of the most damaging mass movements, which needs immediate interventions, can help civil protection authorities managing the emergency phases.
(b) Appraisal of damage that could be caused by future
mass movements.
As in other natural disasters, assessing in advance the im-pact of mass movements can provide important information to planners, who assess the potential consequences of alter-native hazard mitigation measures (Lindell and Pater, 2003). Furthermore, estimating the potential damage can signifi-cantly increase the level of preparedness and the capacity of governmental agencies to cope with the effects of these phe-nomena.
Areas that have never been damaged by mass movements and show signs of instability can be analysed in advance to assess what damage can be expected in case of activation. This information can guide the planning of different types of counter-measures, allowing the identification of phenomena where efforts should be directed first.
The priority for structural remediation can be set based on an appraisal of probable damage, and the costs and ben-efits derived from the implementation of different possible defensive measures can be assessed, as shown by Fuchs et al. (2007) in the case of avalanches.
In the present work, we apply a spreadsheet called the Sup-port Analysis Framework (SAF) to assess damage indices for some mass movements occurred in Calabria, in order to test the suitability of this method for future extensive damage sur-veys.
2 The Support Analysis Framework (SAF)
The Support Analysis Framework is a spreadsheet used to appraise damage caused by past or future mass movements that allow a rapid comparison of effects caused by differ-ent phenomena. The SAF was organised on the basis of a large amount of damage data available in the ASICal database (http://www.camilab.unical.it, 2009) and the Histor-ical Archive of CNR-IRPI of Cosenza, both of which contain data on mass movements that occurred in Calabria during the last two centuries.
Calabria, the southernmost Italian region, has a long his-tory of damaging mass movements (Petrucci and Versace, 2004, 2005, 2007), due to its climatic, geomorphological and anthropogenic framework. The maximum elevation of the region reaches up to 2000 m a.s.l., and the few plain ar-eas are mainly located along the coasts (Fig. 1a). From a geological point of view (Fig. 1b), the region is made up of allochthonous crystalline rocks (Palaeozoic to Jurassic in age), stacked during the middle Miocene (Tortorici, 1982) over carbonate units (Ogniben, 1973). Neogene flysch fills tectonic depressions. Starting in the Quaternary, the region has been subjected to still-active uplift. The tectonic stresses and climatic conditions have caused the rocks to deteriorate, thus predisposing slopes to instability phenomena.
Analysing the above-mentioned datasets of Calabrian mass movements, we created a form (Petrucci et al., 2003; Petrucci and Pasqua, 2008; Petrucci et al., 2008) focusing on direct damage, and used it to assess the effects induced by both mass movements and floods. This form is based on the concept that damage is the product of the value of dam-aged element and the level of loss that it suffered (Varnes and IAEG, 1984). We sorted the damaged elements into sections: for each element we set a relative value (based on an arbitrary scale) and four possible levels of loss.
assessment. Then, we convert it to a spreadsheet that, starting from a series of lettersx, typed in the cells of damaged ele-ments and the related levels of loss, automatically calculates the direct, indirect, intangible and total damage indices. For its simplicity, the SAF can be filled by nonspecialists who should simply be trained on the procedure to mine damage data from documents describing mass movements.
In dealing with an approach designed for historical dam-age data, the SAF does not require detailed on-site surveys: damaged elements and levels of loss are obtained by simply analysing the available descriptive data.
In the present work, we test the SAF for three mass move-ments that occurred in Calabria. This is a fundamental test that must be performed before the SAF is used in extensive damage surveys – of both past and future mass movements – from either local agency or civil protection offices, which could be interested in damage appraisal.
Once tested, the SAF can be used to rapidly assess dam-age, which can help civil protection authorities in managing emergency phases by identifying the most damaging mass movements for which immediate analyses and interventions must be planned. If mass movements affecting a selected area have been mapped, the SAF can be used as a prelimi-nary step for a “consequence analysis,” because it can supply a summary of potential outcomes arising from the activation (or re-activation) of a selected phenomenon, to be included in more sophisticated vulnerability and risk analysis, as pre-sented, e.g., by Bell and Glade (2004).
2.1 Structure of the SAF
In the SAF, damage is classified into three types (Swiss Re, 1998; Aleotti and Polloni, 2005):
(a) Direct damage, including all physical impacts that
lead to either destruction or deformations that reduce the functionality of an element, such as a building or road, and the loss of furnishings and provisions in houses. Effects on people, who may be either killed or injured, are also included.
(b) Indirect damage, which can affect an area several
times larger than the landslide zone itself and includes the decrease in economic productivity and actions aimed at restoring pre-landslide conditions.
(c) Intangible damage, which includes the
psychologi-cal effects and emotional consequences of either permanent house loss or temporary evacuation.
These three types of damage have been expressed in the SAF by means of sections labelled with letters. The identification section (A) accounts for data concerning the location, the time of activation of the analysed mass movement, and details about the documents from which data
Direct damage sections
Sections Elements Levels of loss dl
Public buildings L4 L3 L2 L1
City Hall 1 1 0.75 0.5 0.25 dlB1
Barracks 1 1 0.75 0.5 0.25 dlB2
Hospital 1 1 0.75 0.5 0.25 dlB3
School 0.75 1 0.75 0.5 0.25 dlB4
Church 0.75 1 0.75 0.5 0.25 dlB5
Private houses Inhabited Temporarilyinhabited Uninhabited Levels of loss
0.75 0.5 0.25 1 0.75 0.5 0.25 dlB6
0.75 0.5 0.25 1 0.75 0.5 0.25 dlB7
0.75 0.5 0.25 1 0.75 0.5 0.25 dlB8 1 Building
0.75 0.5 0.25 1 0.75 0.5 0.25 dlB9
1 0.75 0.5 1 0.75 0.5 0.25 dlB10
1 0.75 0.5 1 0.75 0.5 0.25 dlB11
1 0.75 0.5 1 0.75 0.5 0.25 dlB12
2 10 Buildings
1 0.75 0.5 1 0.75 0.5 0.25 dlB13
1 1 0.75 1 0.75 0.5 0.25 dlB14
1 1 0.75 1 0.75 0.5 0.25 dlB15
1 1 0.75 1 0.75 0.5 0.25 dlB16
>10 Buildings
1 1 0.75 1 0.75 0.5 0.25 dlB17
1 Building 0.25 1 0.75 0.5 0.25 dlB18
2-10 Buildings 0.5 1 0.75 0.5 0.25 dlB19 Loss of furnishings
and assets
>10 Buildings 0.75 1 0.75 0.5 0.25 dlB20
1 Building 0.25 1 0.75 0.5 0.25 dlB21
2-10 Buildings 0.5 1 0.75 0.5 0.25 dlB22
B
Buildings
Loss of assets outside the buildings
(i.e. cars) >10 Buildings 0.75 1 0.75 0.5 0.25 dlB23
Bridge 1 1 0.75 0.5 0.25 dlC1
Tunnel 1 1 0.75 0.5 0.25 dlC2 Highway
Roadway 1 1 0.75 0.5 0.25 dlC3
Bridge 1 1 0.75 0.5 0.25 dlC4
Tunnel 0.75 1 0.75 0.5 0.25 dlC5 State road
Roadway 0.75 1 0.75 0.5 0.25 dlC6
Bridge 1 1 0.75 0.5 0.25 dlC7
Tunnel 0.75 1 0.75 0.5 0.25 dlC8 County road
Roadway 0.25 1 0.75 0.5 0.25 dlC9
Bridge 0.75 1 0.75 0.5 0.25 dlC10
Tunnel 0.5 1 0.75 0.5 0.25 dlC11 Municipal road
Roadway 0.25 1 0.75 0.5 0.25 dlC12
C
Roads
Country road Roadway 0.25 1 0.75 0.5 0.25 dlC13
Bridge 1 1 0.75 0.5 0.25 dlD1
Tunnel 1 1 0.75 0.5 0.25 dlD2 State railway
Roadway 0.75 1 0.75 0.5 0.25 dlD3
Bridge 1 1 0.75 0.5 0.25 dlD4
Tunnel 0.75 1 0.75 0.5 0.25 dlD5
D
Railways Regional railway
Roadway 0.5 1 0.75 0.5 0.25 dlD6
Industrial 1 1 0.75 0.5 0.25 dlE1
Commercial 0.75 1 0.75 0.5 0.25 dlE2
Handicraft 0.5 1 0.75 0.5 0.25 dlE3
Tourism 0.75 1 0.75 0.5 0.25 dlE4
E
Productive activities
Farming 0.25 1 0.75 0.5 0.25 dlE5
Gas pipeline 1 1 0.75 0.5 0.25 dlF1
Electric line 1 1 0.75 0.5 0.25 dlF2
Telephone line 0.5 1 0.75 0.5 0.25 dlF3
Aqueduct 0.75 1 0.75 0.5 0.25 dlF4
F
N
etworks services
Drainage system 0.5 1 0.75 0.5 0.25 dlF5
>60 people 60-30 people 30-10 people <10 people
Victims 1 1 0.75 0.5 0.25 dlG1
Badly hurt 1 1 0.75 0.5 0.25 dlG2
Light physical damage 0.5 1 0.75 0.5 0.25 dlG3
G
People
Temporary shock conditions 0.25 1 0.75 0.5 0.25 dlG4
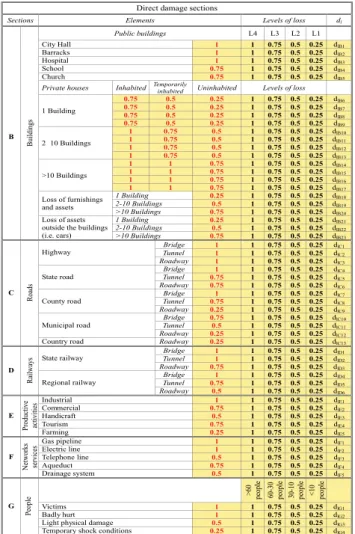
Fig. 2.Structure of the SAF: sections assessing direct damage. The
red numbers are the relative values of the elements. The four levels of loss (black numbers) are set as follows: L4 (1): complete loss; L3 (0.75): high loss; L2 (0.5): medium loss; L1 (0.25): low loss. Eachdlis labelled with the letter of the section to which it belongs, followed by the number of the line that it occupies within the section itself. In the operative version, yellow cells appear empty because the red and black numbers are hidden. When the operator types the
letterxin these cells, the hidden numbers are used to assess damage
indices, by multiplying the value of the element by the level of loss that it suffered.
have been obtained. All of the other sections (from B to
L) are composed of a number of lines, each accounting for damage to a specific element (Figs. 2 and 3). The elements are listed in the SAF according to a simple formatting criterion, irrespective of their intrinsic value.
2.1.1 Direct damage sections
Indirect damage sections
Levels of loss dl
L4 L3 L2 L1
Section
Actions
>60 people 60<people<30 30<people<10 <10 people
Lodging for prolonged periods
(>30days) 1 0.75 0.5 0.25 dlH1
Lodging for short periods
(<30days) 0.75 0.5 0.25 0.25 dlH2
Arrangement of foodstuffs and basic necessities for displaced people
0.25 0.25 0.25 0.25 dlH3
H
Set up of sanitary conditions
for displaced people 0.25 0.25 0.25 0.25 dlH4
Levels of loss dl
L4 L3 L2 L1
Section
Actions
>100,000 100,000 -20,000
20,000 -10,000 <10,000
Removal of debris in order to
re-enable circulation 1 0.75 0.5 0.25 dlI1
Remedial works aiming to re-establish safety conditions for people (retaining walls, removal of unstable rock blocks)
1 0.75 0.5 0.25 dlI2
Studies, surveys and monitoring aiming to organise plans for emergency management and recovering
1 0.75 0.5 0.25 dlI3
Emergency works on unstable
buildings 1 0.75 0.5 0.25 dlI4
Construction of new housing 1 0.75 0.5 0.25 dlI5
Opening of alternative roads
to by-pass damaged areas 1 0.75 0.5 0.25 dlI6
I
Economic loss due to the
decrease of traffic 1 0.75 0.5 0.25 dlI7
Intangible damage section
Levels of loss dl
L4 L3 L2 L1
Section
Actions
>60 people 60<people<30 30<people<10 <10 people
Psychological effects due to the prolonged conditions of displaced people
0.75 0.5 0.25 0.25 dlL1
Psychological effects due to the temporary conditions of displaced people
0.5 0.25 0.25 0.25 dlL2
L
Problems due to the delay of public transportation in the damaged area
0.5 0.25 0.25 0.25 dlL3
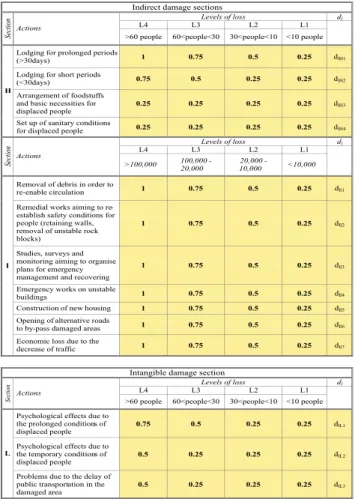
Fig. 3.Structure of the SAF: sections assessing the indirect (H and
I) and intangible (L) damage. Basing on the combination of the
action to be undertaken and the number of people involved (H and
L) or the cost of the action (I), a value grid has been defined. Also in this case, yellow cells appear empty: when the operator types the letterxon a cell, the hidden number contained in it is accounted for in the indirect or intangible damage index.
Each element is characterised by its value, set on an ar-bitrary scale, and indicated in Fig. 2 by a red number. The levels of loss, indicated by black numbers, are set as: L4: complete loss; L3: high loss; L2: medium loss; or L1: low loss. Depending on the section, these levels take different meanings but they always reflect the above-mentioned levels of loss.
In the operating version of the SAF, the yellow cells are empty, because they have to be filled in by the operator: in Fig. 2, these numbers are shown to explain the values used to assess damage indices. By typing the letterxin a cell de-scribing an element and another one in the cell of the suffered level of loss, formulas implemented in hidden columns mul-tiply these two values to obtaindl, which is the contribution to damage of the linel. In Figs. 2 and 3, eachdl has been labelled with the letter of the section to which it belongs, fol-lowed by the number of the line it occupies within the section
itself. In practice, since the actual value ofdl in a selected line depends on the level of loss we choose, we use this rep-resentation to indicate a value derived from the product of level of loss and value of the element. All thedl values are used to assess both direct and total damage indices.
The elements used for direct damage assessment are organised in the following sections:
Section B: Buildings
Buildings are classified as public or private. For public buildings, according to the social function, the strategic coordination role in emergency management and the number of people who can be inside during night and day, a unique value has been set (city hall=1; barracks=1; hospital=1; school=0.75; church=0.75). For private buildings, two criteria have been introduced to better identify their value: the number of buildings (1 building; 2–10 buildings; >10 buildings), and whether they are inhabited, temporarily inhabited or uninhabited. The level of loss can be selected from: L4 (building collapsed), L3 (building unusable due to structural damage), L2 (building unusable due to loss of functionality), and L1 (building habitable with light dam-age). In this section, the loss of furnishing inside or outside the buildings is also included and classified according to the number of buildings involved (1 building; 2–10 buildings;
>10 buildings).
Section C: Roads
Roads are classified into five types according to rele-vance, traffic flow, and possible restoration costs: highway, state road, county road, municipal road and country road. Except for country roads, which are characterised by a simple structure, the damage can affect one or more of the following sub-elements: bridge, tunnel and roadway. Then, except for country roads, the value depends on the damaged sub-element(s). According to the degree and duration of inefficiency, the levels of loss are set as follows: L4: road breakage causing traffic interruption for months; L3: road breakage causing traffic interruption for days; L2: temporary interruption without breakage; L1: light damage without traffic interruption.
Section D: Railways
Section E: Productive activities
These are divided into five types: industrial, commer-cial, handicraft, tourism and farming. The levels of loss are: L4: interruption of production and loss of productive system; L3: interruption of production and loss of products; L2: loss of products; and L1: light damage without loss of products.
Section F: Network services
This category is divided into five types: gas pipeline, electric line, telephone line, aqueduct, and drainage system. The levels of loss have been set according to the duration of the inefficiency and the extent of the suffering area (L4: prolonged service interruption of large areas; L3: temporary service interruption of large areas; L2: local and temporary inefficiencies; and L1: light damage without inefficiencies).
Section G: People
Damage to people is described by the occurrence of four conditions: victims; badly hurt; light physical damage; and temporary shock conditions. The levels of loss have been set according to the number of people concerned (>60 people; 60–30 people; 30–10 people;<10 people).
2.1.2 Indirect damage sections
The indirect damage includes two sections,HandI(Fig. 3). Section H describes actions concerning the dislocation of people, for which the levels of loss are set according to the number of people involved (>60 people; 60–30 people; 30– 10 people;<10 people). Section I accounts for the cost of re-medial works, and the interruption and/or delay of economic activities caused by the mass movement. In this case, the level of loss depends on an appraisal of the economic cost of these works, sorted into four nominal intervals (>100 000 C; 100 000–20 000 C; 20 000–10 000 C;<10 000 C) (Fig. 3).
For direct damage sections, the numbers in Fig. 3 are hid-den in the operating version of the SAF, because the yellow cells must be filled in. For each action, we have to select only one of the four levels of loss, by typing the letterx into the relative cell: in this way, the hidden value is placed in the correspondentdlcell. All of thedlvalues are used to assess both indirect and total damage indices.
2.1.3 Intangible damage section
The intangible damage, assessed in Sect.L, takes into ac-count the psychological consequences affecting people who live in the damaged area. The levels of loss are set according to the number of people involved (>60 people; 60–30 peo-ple; 30–10 peopeo-ple;<10 people) (Fig. 3). For each line of the indirect damage sections, by selecting a single level of loss,
the appropriate numerical value (visible in Fig. 3) is inserted in the corresponding cell ofdl. All of thedl values are used to assess both intangible and total damage indices.
2.2 Assessment of damage indices
The values ofdl obtained from the lines of the SAF are con-verted into damage indices by means of the simple calcu-lations summarised below. For each section, i.e., for the generic section i, we calculate the Damage of the Section
i(DSi)using Eq. 1:
DSi =
n
X
l=1
dl (1)
wheredlis the damage contribution of each of thenlines of sectioni.
For each section, the maximum value ofDSi (MaxDSi)is calculated based on the occurrence of damage to all of the listed elements that are supposed to suffer the highest level of loss. Next, DSi is normalised to MaxDSi to obtain the Normalised Damage of Sectioni(NDSi), as in Eq. 2:
N DSi=
DSi
MaxDSi
(2) To obtain the Index of Damage of Section i (IDSi), the values of NDSi are classified as follows: D4: very high damage (1<D4≤0.75); D3: high damage (0.75<D3≤0.5); D2: medium damage (0.5<D2≤0.25); or D1: low damage (D1<0.25).
The Normalised DIrect Damage (N.DI.D) is obtained us-ing equation 3:
N .DI.D.=
G
P
i=B
N DSi
32.5 (3)
where the value 32.5, which is used to normalise the result, is the maximumNDSi that can be obtained by summing the
DSi of all of the direct damage sections. The calculation is extended to all of the sections of direct damage, fromB to
G. The value ofN.DI.D.is converted into the Index of DIrect Damage (I.DI.D.) by classifying it into one of the four classes described above (D4, D3, D2, or D1).
N .I.D.=
I
P
i=H
DSi
9.25 (4)
The Normalised Indirect Damage (N.I.D.) is calculated using Eq. 4, and the Index of Indirect Damage (I.I.D.) is obtained by classifying the result according to the above-mentioned four classes.
In Eq. 4,H andI are the sections of indirect damage and 9.25 is the maximum indirect damage that SAF can assess.
200 m 700 m
700 m
1100 m
700 m
300 m 600 m
Tyrrhenian Sea
1 0 1km
1
2 3
2
20 m
80 m
80 m
120 m 200 m
Ionian Sea
1 0 1km
3
100 m
200 m
100 m
700 m
1200 m 900 m
N
1 0 1km
A B C
No. of case study 1 2 3 Municipality Cerzeto Cetraro Ciro Marina Surface (km2
) 21.87 65.69 41.60 Mean altitude (m a.s.l) 450 120 5
Maximum altitude (m a.s.l) 1,311 1,118 260 Minimum altitude (m a.s.l) 75 0 0 Number of inhabitants 1,369 10,176 14,674 Population density (inh/ km2
) 63 155 353
Mean income in 2005 (euros) 12,296 14,812 14,922 ‘
1 1
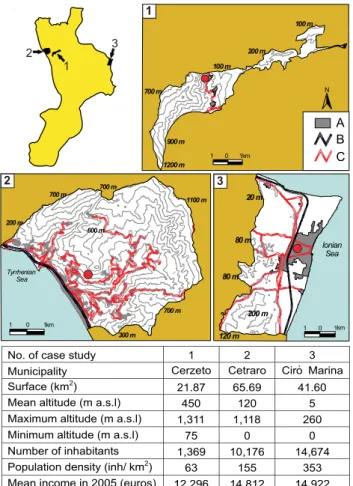
Fig. 4. Main features of the municipalities in which the analysed
mass movements occurred (http://www.comuni-italiani.it, 2008). Top left: Calabria region (yellow), and the municipalities in which the analysed mass movements occurred (black), labelled with the identification number of the case study. (1) Case study 1; (2) case study 2; and (3) case study 3. In the legend, A) urban settlements; B) state and county roads; C) state railways. The red dots in each municipal map roughly indicate areas where the mass movements occurred.
damage section and 1.75 is the maximum sum ofDSiof the
Lsection.
N .I N .D.=
P
L
DSi
1.75 (5)
The Index of INtangible Damage (I.IN.D.) is determined by classifying the value obtained from Eq. 5.
The Normalised Total Damage (N.T.D.) is calculated using Eq. 6, and the Index of Total Damage (I.T.D.) is obtained by classifying the value obtained from Eq. 6.
N .T .D.=
L
P
i=B
DSi
43.5 (6)
In Eq. 6, 43.5 is the maximum value of total damage that can be assessed using the SAF.
2.3 The SAF Local
The first application of SAF (Petrucci and Gull`a, 2009) high-lighted the need to customise the direct damage sections, tak-ing into account the community framework in which a mass movement occurs and the elements that are prone to damage in that area. In practice, for each municipality, we can define a customised SAF version, named SAFL, where L stands for Local. In the direct damage sections of the SAFL, only the elements that are actually present in the analysed mu-nicipality are introduced. In this way, the “weight” of these elements automatically increases. Thus, the maximumDSi used to normalise data decreases, and consequently the value
ofI.DI.D.increases.
Damage to people is considered invariable from place to place and does not need the customised local assessment. In practice, we assume that, when changing the municipal-ity and the number of inhabitants or their mean income, the value of life remains steady: i.e., more than 60 badly hurt people are classified as an L4 loss, in a big town or in a small village. Thus, if for human life there is no scale-related fac-tor, it remains constant using either the SAF or the SAFL.
Indirect and intangible damage are expressed as actions, and therefore do not depend on the presence/absence of some element that can be present in a certain municipality and ab-sent in another. In practice, these lines do not depend on the municipal framework, because their levels of loss are ex-pressed by means of entities (costs or number of people in-volved) that have the same significance from municipality to municipality and do not need local re-scaling. Thus, only direct and total damage indices can change according to the use of SAF or SAFL.
3 An application of saf and SAFL to case studies in
Calabria
In this work, we assess damage caused by three mass move-ments that occurred recently in Calabria using both the SAF and the SAFL approaches, and compare the results.
As regarding the type of phenomenon, cases 1 and 2 can be classified as landslides, whereas case 3 affected a flat and wide area, and caused effects more similar to those induced by subsidence processes than by landslides. In addition, the first two cases concern phenomena that reached a collapse phase, during which they released almost all of their destruc-tive energy. In contrast, in the third case, the effects seem to represent a deformation phase that did not expend all of the energy of the phenomenon. For this reason, in order to both survey the evolution of the phenomenon and avoid damage to people, a monitoring system has been recently developed (Gull`a, 2008).
In the following, we provide a description of each phe-nomenon and assess damage indices using both SAF and SAFL.
3.1 Case study No. 1
The first case is a complex landslide that occurred on 7 March 2005, in the Cerzeto municipality, after prolonged rain and snowfall, and destabilising over 5 million cubic meters of rock. Data regarding this phenomenon were col-lected from various sources (Iovine et al., 2007; Presidenza del Consiglio dei Ministri, 2005; regional newspapers: La Gazzetta del Sud and Il Quotidiano).
Several tectonic units, composed of metamorphic rocks (Palaeozoic-Mesozoic) and overlain by clastic terrains (Cenozoic-Neozoic), crop out in the vicinity of the study area. The main scarp of the slide developed along a N-S-trending normal fault; its crown is mainly located within the cataclastic zone associated with the fault. The landslide af-fected a slope that has been subjected several times to mass movements, as confirmed by historical documents and geo-morphological observations.
3.1.1 Damage indices assessment for case study No. 1 This landslide was preceded by premonitory evidence, such as the opening of cracks that were surveyed as early as Febru-ary 2005. Accordingly, emergency monitoring was started (Rizzo, 2008), and crack openings were measured daily. When the cracks showed accelerated opening, the mayor or-ganised the town’s evacuation, thus saving the inhabitants. Consequently, no physical damage affected the people, ex-cept for “temporary shock conditions” for more than 60 peo-ple (L4).
The two public buildings located in the landslide area (a school and a church) suffered damage classified as level L3 and L2, respectively. The buildings located along the main scarp (>10 buildings) were heavily damaged (L4) (Fig. 5a), as was the roadway of the county road connecting the hamlet to nearby villages (L4) (Fig. 5b) and the municipal and coun-try roads located in the landslide area (L4). Damage suffered by commercial, handicraft, farming activities, aqueduct and
A
B
C
E
D
F
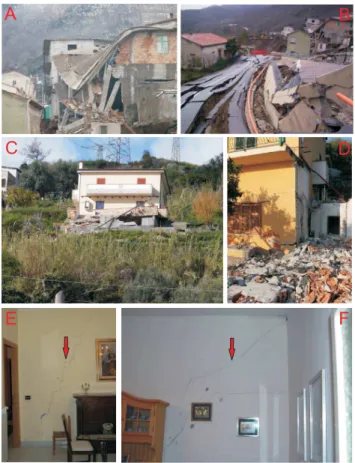
Fig. 5.Some of the effects caused by the analysed mass movements.
Photos(A)and(B): case study 1; photos(C)and(D): case study 2;
photos(E)and(F): case study 3. The arrows in photos (C) and (D)
indicate cracks in one of the damaged houses.
drainage system can be classified as L4, while electric and telephone lines suffered damage of level L2.
For indirect damage, all the lines of Sect.H, except for the second one, are classified as L4. In Sect.I, “studies, surveys, and monitoring aiming to organise plans for emergency man-agement and recovering” and “construction of new housing” are classified as level L4, whereas “removal of debris in or-der to re-enable circulation,” “emergency works on unstable buildings” and “opening of alternative roads to bypass dam-aged areas” are classified as L3. In this case the alternative road was not really built: instead, an old municipal road was modernised to bypass the landslide area.
Intangible damage encompasses “psychological effects due to the prolonged conditions of displaced people” and “problems due to the delay of public transportation in the damaged area,” both for more than 60 people (L4).
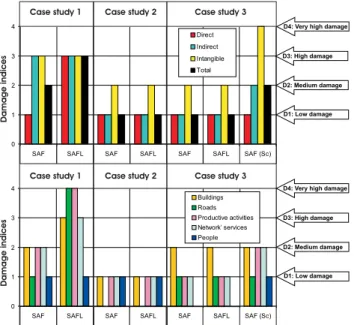
0 1 2 3 4
SAF SAFL SAF SAFL SAF SAFL SAF (Sc)
Direct
Indirect
Intangible
Total
0 1 2 3 4
SAF SAFL SAF SAFL SAF SAFL SAF (Sc)
Buildings Roads Productive activities Network’ services People
Case study 1 Case study 2 Case study 3
Case study 1 Case study 2 Case study 3
D1: Low damage D2: Medium damage D3: High damage D4: Very high damage
Damage
indic
es
Damage
indic
es
D1: Low damage D2: Medium damage D3: High damage D4: Very high damage
Fig. 6.Top: direct, indirect, intangible and total damage indices as-sessed by both SAF and SAFL for the three analysed case studies. For case study 3, the same indices have been assessed for the dam-age scenario (Sc) hypothesised in paragraph 3.4. Bottom: Damdam-age indices for the direct damage section; the results obtained for the hypothesised scenario of case study 3 are labelled as Sc. Railways have been omitted from the diagram because they are not damaged in the analysed cases. The arrows on the right describe the possible values of damage indices: (D1) low damage; (D2) medium damage; (D3) high damage; (D4) very high damage.
To prepare the SAFL for case study No. 1, the elements not present in the analysed municipality (barracks; hospital, highway, state road, regional railway, bridge and tunnel for county and municipal roads, gas pipeline, and industrial and tourism activities) were eliminated. Accordingly, the coeffi-cient in Eq. 3, which takes into account the maximum dam-age that can occur if all of the existing elements are affected, decreases from 32.5 to 14.25. Similarly, in Eq. 6, which as-sesses the Normalised Total Damage, the value of 43.5 is replaced by 25.25.
Then, using the SAFL, the direct damage index increases from D1 to D3, whereas the total damage index increases from D2 to D3 (Fig. 6).
For the direct damage sections, damage indices for the buildings and the network services rise from D2 to D3. Sig-nificant differences are found in the damage index for the roads, increasing from D1 to D4, and productive activities, increasing from D2 to D4.
Thus, as the damage caused by mass movement No. 1 is characterised by a low “absolute value,” the use of SAFL can provide a damage assessment that is more coherent with the local framework. In fact, even though the county road that was destroyed has a low “absolute value,” for people living in the village it is very valuable because it is the only way to
access the village. Thus, the breakage of this road plays an important role in the assessment of damage to roads, which in the local version of the SAF increased from D1 to D4. 3.2 Case study No. 2
Case study No. 2 is a landslide that occurred on 7 March 2007, in La Palazzuola, located in the Cetraro mu-nicipality, for which damage data were gathered from Cal-abria’s newspapers (La Gazzetta del Sud and Il Quotidiano della Calabria).
The bedrock in the area is composed of carbonate rocks that overlie a formation made up of tectonised phyllitic rocks, and the sequence is covered by Holocene carbonate debris (Ietto et al., 1992). The phenomenon occurred on a slope affected by several ancient landslide scarps, and is a roto-translational slide about 140 m wide and 260 m long, the slid-ing surface of which has been assessed at a depth of 10–15 m. At the base of the slope, an artificial cut confined by retaining walls (7 to 10 m high by about 60 m long) has been excavated in order to protect a commercial shed still under construction. The predisposing mechanism of the slide seems to be re-lated to three main elements: (a) the general instability of the slope; (b) the presence of an aquifer in the carbonate rocks that plays a destabilising role; and (c) the destabilising action of the artificial cut excavated at the foot of the slope. Intense rainfall fallen during the four months preceding the move-ment can be considered the final triggering cause (Gull`a and Antronico, 2007).
3.2.1 Damage indices assessment for case study No. 2 Direct damage caused by the landslide mainly affected pri-vate houses (Fig. 5c and d): two inhabited buildings and one uninhabited building were heavily damaged (L4), and two other buildings suffered light damage (L1).
The commercial sector experienced light damage (L1) be-cause a retaining wall, which was built at the base of the slope to protect a commercial warehouse that was still under construction, was damaged. Electric lines suffered damage of level L3, because a pylon located just near the landslide area had to be moved to a safer location, and the entire zone experienced electrical interruption while the works were per-formed. Only one person had to be hospitalised because of an illness (L1).
Indirect damage was mainly related to the temporary dis-placement of people (30–60 people) living in the most dam-aged houses (L3) and remedial works carried out to re-establish the pre-landslide conditions (L3).
In this case, we determined low values for direct, indirect, and total damage indices (D1) using the SAF; meanwhile, the intangible damage index reached level D2. In the direct dam-age sections, D1 damdam-age indices were assessed for buildings, productive activities, network services and people.
Rearranging the damage-prone elements for the SAFL of the Cetraro municipality, no lines in the buildings section had to be eliminated. In the roads section, the highway elements and some elements for a county road (tunnel) and munici-pal road (tunnel and bridge) had to be eliminated, and the same happened for the regional railway, which does not pass through this municipality. Consequently, the coefficient 32.5 in Eq. 3 becomes 25.25, and the coefficient 43.5 in equation 6 becomes 36.25. Thus, in this case study, we obtained the same damage indices obtained using the SAFL as using SAF. 3.3 Case study No. 3
The third case study concerns a mass movement affecting the Cir`o Marina municipality, for which the most recent phase of activity took place between the 28th and 30th of July 2004, and other phases were observed in 1999 and 1980. Data about damage were gathered from two sources: a technical report written by CNR researchers for the regional Civil Pro-tection Office (Sorriso-Valvo et al., 2005) and unpublished documentation collected by the municipal offices.
The phenomenon was tied to several factors (Sorriso-Valvo et al., 2005): (a) an episodic and nonseismic defor-mation occurring along a tectonic line about 4.3 km long; (b) a slow, deep-seated landslide (that extends, in part, under the sea) influenced by tectonic structures; and (c) a consolidation phenomenon caused by the water table drop occurring after periods of low rainfall lasting for one or more years. It is not clear which of these factors played the most important role, or if the combination of all three factors controls the stability of the area.
As a result, an area that extends over about 0.2 km2is af-fected by mainly vertical displacements of the order of sev-eral centimetres, which induce cracks in buildings (Fig. 5e and f).
The effects of factor (a) are demonstrated by the fact that all of the damaged buildings are located along the above-mentioned tectonic line. Clues about the role of factor (b) have been gathered by means of satellite data interpretation, which detected terrain movements (Farina et al., 2007). Fac-tor (c), the consolidation of detritic terrains, is tied to the greater deformability of terrains located on one side of the tectonic line than on the other side.
3.3.1 Damage indices assessment for case study No. 3 Three schools are located along the damaged belt, and they suffered L2 damage, and houses suffered damage of lev-els L4 (5 cases), L3 (4 cases), and L1 (13 cases). Munic-ipal roads passing through the area were affected only by
light damage (L1). Commercial and handicraft activities suf-fered level L2 damages. As regards network services, dam-age affected telephone lines (L1), the aqueduct (L2), and the drainage system (L2). No physical damage to people was recorded.
In the indirect damage, we accounted for “lodging for pro-longed periods” for 30–60 people (L3), and “studies, sur-veys, and monitoring aiming to organise plans for emergency management and recovering” (L4).
In the intangible damage, we counted “psychological ef-fects due to the prolonged condition of displaced people” for more than 60 people (L4).
Using the SAF, we assessed similar results for direct, in-direct, intangible, and total damage indices as were obtained for case study No. 2 (Fig. 6). For the direct damage sections, buildings show D2 damage index, while for roads, produc-tive activities, and network services damage index is D1.
In arranging the SAFL for this case study, only a few modifications had to be carried out: the highway, regional railway, and tunnel for the municipal road are elements not present in the analysed municipality, and were eliminated from the index calculations. The coefficient 32.5 in Eq. 3 becomes 29, and the coefficient 43.5 in Eq. 6 becomes 40. As in case 2, we obtained the same damage indices using SAF and SAFL (Fig. 6).
3.4 Potential damage scenarios: the example of case study No. 3
In the past paragraphs, we use the SAF to appraise the effects caused by mass movements that have already occurred, in or-der to numerically express the different types of damage by means of damage indices. In this paragraph, we applied the SAF to the appraisal of the damage that a mass movement could cause in the future. This kind of application could be obvious dealing with a single phenomenon but can be use-ful in ranking the possible effects of a great number of phe-nomena according to their potential damage, thus allowing the identification of phenomena that most need monitoring or structural works.
For this application, we used case study 3, because it did not reach a collapse phase: the repeating occurrences (in 2004, 1999, and 1980), and the major impact of the most recent case point out that this phenomenon maintains part of its destructive energy and could cause further damage in the future, which we would like to assess in advance.
area, could suffer damage of level 3. The municipal roads could be affected by L4 damage, thus inducing indirect dam-age (“economic loss due to the decrease of traffic”: L3). Be-cause of structural damage to the buildings in which they are located, commercial activities and handicraft may suffer L3 damage. Tourist activity in the affected area could suffer L2 damage. For network services, in this scenario, we assumed damage one level higher than those surveyed during the 2004 event (L2 for telephone lines and L3 for both aqueduct and drainage system).
The presence of the recently developed monitoring system should ensure that the residents are warned in advance. Thus, they would not suffer any serious injuries, but only temporary shock conditions (L3) and light physical damage (L3).
Regarding indirect damage, “lodging for prolonged peri-ods” could be necessary for more than 60 people (L4) living in the most damaged houses. At the same time, “lodging for short periods,” for the time required to survey and re-pair damage (“emergency works on unstable buildings”: L3), could be necessary for more than 60 people (L4) living in the less damaged buildings.
For intangible damage, we must take into account “psy-chological effects due to the condition of displaced people” for more than 60 people (L4), for both prolonged and short periods. At the same time, “problems due to the delay of public transportation in the damaged area” could affect more than 60 people (L4).
In this hypothetical scenario, the direct damage index does not change (D1), both indirect and total damage indices in-crease from D1 to D2, and intangible damage shows the highest increase, from D2 to D4. Concerning direct damage sections, for both productive activities and network services, the damage indices increase from D1 to D2 (Fig. 6).
In practice, the probable outcomes of this phenomenon do not seem very dangerous, mainly because the monitoring system should ensure the safety of people living in the area. For future damage prevention, neither new buildings nor pro-ductive activities should be located in the area, and network services should be rearranged in order to avoid interception with the area involved in the movement.
4 Discussion and conclusions
The Support Analysis Framework is a spreadsheet that con-verts damage descriptions into numerical indices expressing direct, indirect, and intangible damage, and can be used to assess the outcomes of either past mass movements or future re-activations of dormant phenomena.
We applied the SAF on three Calabrian mass movements that occurred in different morphological and anthropogenic frameworks, in order to test it before using it in either dam-age inventories or the appraisal of probable damdam-age in areas prone to mass movements.
Case 1 concerns a small and low populated municipality, located in an internal mountainous sector and characterised by few roads. Cases 2 and 3, on the other hand, pertain to coastal municipalities with more dense population and char-acterised by a large number of damage-prone elements, such as roads and productive activities. When the damage is as-sessed using the SAF, case 1 seems the most damaging, in terms of total, indirect and intangible damage, while it shows a low direct damage index. Cases 2 and 3, on the other hand, show low values of direct, indirect and total damage, and a medium value of intangible damage.
Customised versions of the SAF, named SAFL, based on the elements that are prone to damage in each municipality, have been developed in order to perform damage assessments that are more related to the environmental, anthropogenic, and economic framework in which the phenomena occurred. No rescaling was performed for people in the SAFL versions, as they are considered to have a fixed value. As a result, the direct and total damage indices, which can show different values when assessed by the SAF or SAFL, do not change for cases 2 and 3, and increase for case 1.
Although the three cases cannot be considered sufficient to generalise, the analysed municipalities represent, to some extent, two types of Calabrian municipalities: (a) the in-terior mountainous type, characterised by a low density of damage-prone elements; and (b) the coastal type, showing a higher density of vulnerable elements, in which the presence of main regional roads built along the flat coastal border has accelerated economic development.
Although the number of damage-prone elements is higher in the coastal municipalities, the most vulnerable municipal-ities are those characterised by low densmunicipal-ities of facilmunicipal-ities and productive activities. In this latter type of municipality, the few vulnerable elements become more valuable because they are unique. In this way, the local value of the elements in-creases and a mass movement can cause damage that may be difficult for residents to overcome. For example, in a vil-lage as in case 1, which can only be reached by one county road, the interruption of this road can isolate the community. At the same time, in a small economic system based on a few small productive activities, the interruption of these activities can represent the loss of all income for the local people.
We emphasise that SAF is a first-approach method based on some assumptions that are necessary to speed up the pro-cedure and it need further calibration processes to improve the reliability of the results. One of the problems that we need to overcome is the fact that the procedure does not take into account the temporal vulnerability of elements such as people, who can move inside or outside of the area prone to a landslide (Van Westen et al., 2005). A further improvement will be the conversion of the damage indices into monetary values, in order to take into account the actual costs, espe-cially for rebuilding settlements in different economic con-texts.
In this work, we have considered three cases for testing purposes, although the usefulness of the SAF can be appre-ciated only if it is used on a large number of phenomena that must be sorted according to their probable future effects. The results could be significant for both insurance companies and local authorities involved in disaster management and plan-ning of defensive measures, to develop and prioritise strate-gies to reduce vulnerability, and to determine the effective-ness of those strategies.
For these purposes, the SAF seems to be the correct support at the regional scale, because it supplies an appraisal that could be defined “absolute,” taking into account the values of the elements regardless of the local context. The same sorting procedure, at a municipal scale, can be per-formed using SAFL, which supplies a “relative” assessment of damage, taking into account the elements actually located in the analysed municipality.
Edited by: J. Birkmann
Reviewed by: A. Fekete and another anonymous referee
References
Aleotti, P. and Polloni, G.: Valutazione e mitigazione del rischio frane, Hevelius Edizioni, Benevento (Italy), 125 pp., 2005. Alexander, D.: Urban landslides, Progress in Physical Geography,
13, 157–191, 1989.
Bell, R. and Glade, T.: Quantitative risk analysis for landslides? Ex-amples from B´ıldudalur, NW-Iceland, Nat. Hazards Earth Syst. Sci., 4, 117–131, 2004,
http://www.nat-hazards-earth-syst-sci.net/4/117/2004/.
Blong, R.: A review of damage intensity scales, Natural Hazards, 29, 57–76, 2003.
Crandell, J. and Kochkin, V.: Scientific damage assessment method-ology and practical applications, http://www.asce.org/files/pdf/ hurricane/Structural Performance and Damage assessment, 2005.
Douglas, J.: Physical vulnerability modelling in natural hazard risk assessment, Nat. Hazard Earth Sys. Sci., 7, 283–288, 2007. Farina, P., Casagli, N., and Ferretti, A.: Radar-interpretation of
in-sar measurements for landslide investigations in civil protection practices, 1st North American Landslide Conference (Vail, Col-orado), edited by: Schuster, V. R., Schuster, R. L., and Turner, A. K., Publication no. 23, ISBN 978-0-975-4295-3-2, (CD-ROM, 272-283), AEG, 2007.
Fuchs, S., Th¨oni, M., McAlpin, M. C., Gruber, U., and Br¨undl, M.: Avalanche hazard mitigation strategies assessed by cost effec-tiveness analyses and cost benefit analyses-evidence from Davos, Switzerland, Natural Hazards, 41, 113–129, 2007.
Gull`a, G. and Antronico, L.: Movimento Franoso in localit`a “La Palazzuola” nel Comune di Cetraro (CS), CNR-IRPI, Report for Calabria Civil Protection Office, 42 pp., 2007.
Gull`a, G.: Programma di monitoraggio conoscitivo e di controllo Cir`o Marina (KR), Convenzione tra Regione Calabria, Asses-sorato alla Protezione Civile e CNR-IRPI, Sezione di Cosenza, Relazione Finale, 142 pp., 2008.
Hengjian, L., Kohiyama, M., Horie, K., Maki, N., Hayashi, H., and Tanaka, S.: Building damage and casualties after an earthquake, Natural Hazards, 29, 387–403, 2003.
Horie, K., Maki, N., Kohiyama, M., Lu, H., Tanaka, S., Hashitera, S., Shigekawa, K., and Hayashi, H.: Process of housing damage assessment: the 1995 Hanshin-Awaji earthquake disaster case, Natural Hazards, 29, 341–370, 2003.
Hollenstein, K.: Reconsidering the risk assessment concept: stan-dardizing the impact description as a building block for vulner-ability assessment, Nat. Hazards Earth Syst. Sci., 5, 301–307, 2005,
http://www.nat-hazards-earth-syst-sci.net/5/301/2005/.
Ietto, A., Barilaro, A. Calligaro, G., and Mancuso, C.: Elementi per una revisione dei rapporti Appennino-Arco Calabro, Boll. Soc. Geol. It., 111, 193–215, 1992.
Iovine, G., Petrucci, O., Rizzo, V., and Tansi, C.: The 7 March 2005 Cavallerizzo (Cerzeto) landslide in Calabria – Southern Italy, In: Culshaw et al. (eds), Engineering Geology for Tomorrow’s Cities, Geological Society, London, Engineering Geology Spe-cial Publications, CD paper number 785 (Proc. 10th IAEG Int. Congress, IAEG 2006 – Nottingham, United Kingdom, 6–10 September 2006), 2007.
Lindell, M. K. and Prater, C. S.: Assessing community impacts of natural disasters, Natural Hazard Review, 4(4), 176–185, 2003. Ogniben, L.: Schema geologico della Calabria in base ai dati
odierni, Geologica Romana, 12, 243–585, 1973.
Petrucci, O. and Versace, P.: ASICal: a database of landslides and floods occurred in Calabria (Italy), in: Proc. 1st Italian-Russian Workshop: New Trends in Hydrology, Rende (Italy), edited by: Gaudio, R., 24–26 September 2002, CNR-GNDCI, 2823, 49–55, 2004.
Petrucci, O. and Versace, P.: Frane e alluvioni in provincia di Cosenza agli inizi del 900: ricerche storiche nella documen-tazione del Genio Civile, Editoriale Bios, Cosenza (Italy), ISBN: 88-7740-391-8, 172 pp., 2005.
Petrucci, O. and Versace, P.: Frane e alluvioni in provincia di Cosenza tra il 1930 e il 1950: ricerche storiche nella documen-tazione del Genio Civile, Nuova Bios, Cosenza (Italy), GNDCI, ISBN: 978-88-6093-029, 2913, 247 pp., 2007.
Petrucci, O., De Matteis, V., and Versace, P.: Aspetti metodologici nella identificazione dell’impatto al suolo degli eventi alluvion-ali, La Difesa della Montagna, Convegno Nazionale, Assisi, De-cember 2002, CNR-GNDCI 2830, 522–530, 2003.
Petrucci, O. and Gull`a, G.: A simplified method for landslide dam-age scenario assessment based on historical data, Natural Haz-ards, submitted, 2009.
Haz-ards Earth Syst. Sci., 8, 881–892, 2008,
http://www.nat-hazards-earth-syst-sci.net/8/881/2008/.
Petrucci, O. and Polemio, M.: The use of historical data for the char-acterisation of multiple damaging hydrogeological events, Nat. Hazards Earth Syst. Sci., 3, 17–30, 2003,
http://www.nat-hazards-earth-syst-sci.net/3/17/2003/.
Petrucci, O. and Polemio, M.: The role of meteorological and cli-matic conditions in the occurrence of damaging hydro-geologic events in Southern Italy, Nat. Hazards Earth Syst. Sci., 9, 105– 118, 2009,
http://www.nat-hazards-earth-syst-sci.net/9/105/2009/.
Petrucci, O., Polemio, M., and Pasqua, A. A.: Analysis of damaging hydro-geological events: the case of Calabria region (southern Italy), Environmental Management, 25, 483–495, 2008. Presidenza del Consiglio dei Ministri: Ordinanza 3427, Primi
inter-venti urgenti diretti a fronteggiare i danni conseguenti ai gravis-simi dissesti idrogeologici con connessi diffusi movimenti fra-nosi verificatisi nel territorio del comune di Cerzeto, 9 pp., 2005. Remondo, J., Soto, J., Gonz´alez-D´ıez, A., D´ıaz de Ter´an, J. R., and Cendrero, A.: Human impact on geomorphic processes and hazards in mountain areas in northern Spain, Geomorphology, 66(1–4), 69–84, 2005.
Rizzo, V.: La frana di Cavallerizzo (Cerzeto, Cosenza): criteri uti-lizzati per l’allertamento; aspetti e problematiche, Geologi, 1, 5–33, 2008.
Rygel, L., O’Sullivan, D., and Yarnal, B.: A method for construct-ing a social vulnerability Index: an application to hurricane storm surges in a developed country, Mitigation and Adaptation Strate-gies for Global Change, 11, 741–764, 2006.
Sorriso-Valvo, M., Gull`a, G., and Antronico, L.: Indagini, studio e monitoraggio del dissesto in atto nel centro abitato di Cir`o Ma-rina, Convenzione tra Regione Calabria, Assessorato alla Pro-tezione Civile e CNR-IRPI, Sezione di Cosenza, Relazione Fi-nale, 162 pp., 2005.
Swiss Re: Floods-an insurable risk?, Zurich, 48 pp., 1998. Tortorici, L.: Lineamenti geologico-strutturali dell’Arco
Calabro-Peloritano, Rendiconti della Societ`a Italiana di Mineralogia e Petrologia, 38, 972–940, 1982.
USGS: http://pubs.usgs.gov/fs/2004/3072/fs-2004-3072.html, last access: March 2009.
Van Westen, C. J., Van Asch, T. W. J., and Soeters, R.: Landslide hazard and risk zonation-why is it still so difficult?, B. Eng. Geol. Env., 65, 176–184, 2005.