www.biogeosciences.net/5/407/2008/
© Author(s) 2008. This work is distributed under the Creative Commons Attribution 3.0 License.
Biogeosciences
Dynamics of dimethylsulphoniopropionate and dimethylsulphide
under different CO
2
concentrations during a mesocosm experiment
M. Vogt1,2, M. Steinke2,*, S. Turner2, A. Paulino3, M. Meyerh¨ofer5, U. Riebesell5, C. LeQu´er´e2,4, and P. Liss2 1Max-Planck-Institut f¨ur Biogeochemie, Postfach 100164, 07701 Jena, Germany
2Lab. for Global Marine and Atmospheric Chemistry, School of Environ. Sci., Univ. of East Anglia, Norwich NR4 7TJ, UK 3Department of Biology, University of Bergen, Box 7800, 5020 Bergen, Norway
4British Antarctic Survey, High Cross, Madingley Road, Cambridge CB3 0ET, UK 5IFM-GEOMAR, Dienstgeb¨aude Westufer, D¨usternbrooker Weg 20, 24120 Kiel, Germany
*now at: Department of Biological Sciences, University of Essex, Wivenhoe Park, Colchester, CO4 3SQ, UK Received: 19 September 2007 – Published in Biogeosciences Discuss.: 11 October 2007
Revised: 15 February 2008 – Accepted: 22 February 2008 – Published: 18 March 2008
Abstract. The potential impact of seawater acidification on the concentrations of dimethylsulfide (DMS) and dimethyl-sulfoniopropionate (DMSP), and the activity of the enzyme DMSP-lyase was investigated during a pelagic ecosystem CO2 enrichment experiment (PeECE III) in spring 2005. Natural phytoplankton blooms were studied for 24 days under present, double and triple partial pressures of CO2 (pCO2; pH=8.3, 8.0, 7.8) in triplicate 25 m3enclosures. The results indicate similar DMSP concentrations and DMSP-lyase activity (DLA) patterns for all treatments. Hence, DMSP and DLA do not seem to have been affected by the CO2 treatment. In contrast, DMS concentrations showed small but statistically significant differences in the temporal development of the low versus the high CO2treatments. The low pCO2enclosures had higher DMS concentrations during the first 10 days, after which the levels decreased earlier and more rapidly than in the other treatments. Integrated over the whole study period, DMS concentrations were not sig-nificantly different from those of the double and triple pCO2 treatments. Pigment and flow-cytometric data indicate that phytoplanktonic populations were generally similar between the treatments, suggesting a certain resilience of the marine ecosystem under study to the induced pH changes, which is reflected in DMSP and DLA. However, there were sig-nificant differences in bacterial community structure and the abundance of one group of viruses infecting nanoeukaryotic algae. The amount of DMS accumulated per total DMSP or chlorophyll-adiffered significantly between the present and future scenarios, suggesting that the pathways for DMS pro-duction or bacterial DMS consumption were affected by
sea-Correspondence to: M. Vogt
water pH. A comparison with previous work (PeECE II) sug-gests that DMS concentrations do not respond consistently to pelagic ecosystem CO2enrichment experiments.
1 Introduction
Dimethylsulphide (DMS) is a volatile sulfur compound pro-duced from the algal secondary metabolite dimethylsulfonio-propionate (DMSP) by complex biotic interactions in marine ecosystems (Stefels et al., 2007). DMS is the main natural source of sulfate aerosol to the atmosphere and the major route by which sulfur is recycled from the ocean to the con-tinents. The particulate atmospheric oxidation products of DMS can act as cloud condensation nuclei and thereby affect the radiative properties of the atmosphere by reflecting solar radiation (Charlson et al., 1987).
The physiological roles of algal DMS and DMSP are not fully understood. DMSP is a compatible solute with mul-tifunctional properties that is synthesized by marine phy-toplankton for osmoregulation and cellular cryoprotection (Stefels, 2000). DMSP and its cleavage products DMS and acrylate have been suggested to serve as antioxidants under light or nutrient stress (Sunda et al., 2002), and to act as info-chemicals (Nevitt, 1995; Zimmer-Faust et al., 1996; Wolfe, 2000; Steinke et al., 2006) or grazing deterrents (Wolfe et al., 1997; Strom et al., 2003).
isozymes (Steinke et al., 1998) and is able to enzymati-cally cleave DMSP to DMS. Other prymnesiophytes such as Phaeocystis and dinophytes also produce high concentra-tions of DMSP but many other algal taxa are poor DMSP-producers (Liss et al., 1994). Intracellular DMSP is re-leased to the water during cell lysis caused by grazing (Dacey and Wakeham, 1986), or due to natural mortality and after viral infection (Malin et al., 1998). Once in so-lution, DMSP can be utilized by many bacteria as a sul-fur, carbon or energy source via catabolic demethylation to 3-methylmercaptopropionate and 3-mercaptopropionate (Kiene and Linn, 2000; Howard et al., 2006). Bacteria have also been shown to enzymatically cleave DMSP to DMS and acrylate (Kiene, 1993; Ledyard and Dacey, 1996; Stefels and Dijkhuizen, 1996; Steinke and Kirst, 1996) and novel evi-dence suggests DMSP-dependent DMS-production without the release of acrylate (Todd et al., 2007). DMS can be used as a metabolite by bacteria (Vila-Costa et al., 2006), photo-chemically degraded at the sea surface (Brimblecombe and Shooter, 1986; Kieber et al., 1996), or transferred to the at-mosphere (Liss and Slater, 1974). Since several biological components of the marine microbial food-web add to the physico-chemical processes that are involved in the produc-tion and consumpproduc-tion of DMSP and DMS, the concentra-tions of both may be affected by changes in environmental conditions. Thus, DMS could serve as a sensitive indicator to human-induced climate change.
Ocean acidification is one of the effects of increased an-thropogenic CO2. In the past 200 years, the oceans have ab-sorbed approximately half of the CO2emitted by human ac-tivities such as fossil fuel burning and cement manufacturing (Sabine et al., 2004). This uptake of CO2has led to changes in the chemical equilibrium of the seawater and to a reduction of the pH of the ocean surface waters by 0.1 units. If emis-sions were to continue according to present trends, ocean sur-face pH could decrease by 0.3–0.5 units by the end of the 21st century. This is equivalent to a threefold increase of the concentration of H+ions in the surface ocean (Caldeira and
Wickett, 2005). The impacts of ocean acidification on marine organisms and ecosystems are still poorly understood. Lab-oratory experiments and field studies indicate that acidifica-tion will adversely affect calcificaacidifica-tion (Royal Society, 2005; Kleypas et al., 2006), a process by which marine organisms fabricate shells and plates from calcium and carbonate ions. Coccolithophores, such as E. huxleyi, are one of the phyto-planktonic groups expected to be strongly affected by ocean acidification (Riebesell et al., 2000). E. huxleyi is abundant in temperate oceans and is a prolific producer of DMS (Keller et al., 1989; Holligan et al., 1993; Malin et al., 1993). It is pos-sible that the intracellular production of DMSP or its direct conversion to DMS by E. huxleyi DMSP-lyases is affected by ocean acidification. Additionally, as mentioned above, oceanic DMS production is a result of complex interactions within the marine food-web. Consequently, ocean acidifi-cation may affect DMS concentrations and fluxes by
alter-ing one or more of the various pathways or impactalter-ing some of the species involved. Ocean acidification may therefore affect the feedback of DMS on climate via aerosol forma-tion, as described by the CLAW-hypothesis (Charlson et al., 1987). Previous studies (Avgoustidi, 20061; Avgoustidi et al., 20082) showed reduced DMS concentrations under high CO2in both field and laboratory studies. If the results from these studies can be extrapolated to global scales, reduced DMS emissions could lead to a significant positive feedback on global warming.
Here, we present the concentrations of DMS, DMSP and DMSP-lyase activities (DLA) during a mesocosm study in a Norwegian Fjord in May and June 2005. Our goal was to in-vestigate differences in DMS dynamics under elevated CO2, to address factors that may result in altered DMS dynamics and to compare our findings to results from a previous field experiment (Avgoustidi et al., 20082). Furthermore, we in-vestigate the relevance of our results with respect to global climate change and its impact on global DMS fluxes.
2 Materials and methods
2.1 General experimental set-up
The experiment was conducted at the Espeland Marine Bio-logical Station, University of Bergen (Norway) in May and June 2005. The set-up consisted of 9 polyethylene enclo-sures (ca. 25 m3, 9.5 m water depth) moored to a raft in the Raunefjord (60.3◦N, 5.2◦E): 3 bags with present day pCO2,
hereafter referred to as “1×CO2” (350 ppmv partial pressure of CO2), 3 bags with double pCO2, referred to as “2×CO2” treatments (700 ppmv) and 3 bags with triple pCO2, referred to as “3×CO2” treatments (1050 ppmv). These bags were si-multaneously filled with unfiltered fjord water pumped from a depth of 12 m. Fresh water (0.6 m3) was mixed into the up-per 5 m of the mesocosm bags to stratify the water column. The 2×CO2 and 3×CO2 bags were aerated with CO2 en-riched air, until the water pCO2reached the target values (day 0), the 1×CO2bags were aerated with ambient air. To allow biological processes to alter water pCO2, no further adjust-ments were carried out after day 1. All mesocosm bags were covered with transparent hoods of ethylene tetrafluorethylene foil (Foiltec, Bremen, Germany), which allowed transmis-sion of 95% of incoming light intensity for the complete solar spectrum. The headspaces underneath the hoods were kept at target pCO2by flushing them with CO2-enriched air (23– 35 L min−1). A phytoplankton bloom was triggered via the addition of nutrients on day 0 (16 May 2005; 0.7µmol L−1 PO4, 15µmol L−1NO3)and the bloom was studied over a 1Avgoustidi, V.: Dimethyl sulphide production in a double-CO
2 world, Ph.D. thesis, University of East Anglia, 2006.
2Avgoustidi, V., Joint, I., Nightingale, P. D., Steinke, M. Turner,
period of 24 days. Throughout the study period, the upper 5m of the water column were gently mixed by means of an airlift system. Further details of the set-up and procedures can be found elsewhere (Engel et al., 2005; Schulz et al., 2007). 2.2 Sampling for sulfur compounds
Samples from all nine mesocosms were taken daily at 10:30 h, simultaneous with other measurements conducted during PeECE III. Bubble-free sampling was carried out with nine 5 L polyethylene aspirators. Prior to sampling, all aspi-rators were thoroughly rinsed first with natural fjord water and then with water from the respective mesocosms. The mouths of the aspirators were covered with a 200µm mesh in order to exclude mesozooplankton grazers and taps were left open to release air during sampling. The aspirators were then inverted and slowly immersed through the water surface to a depth of approximately 0.3 m. A minimum of 3 L of water was sampled before closing the taps, slowly turning over and capping off the aspirators and transporting them to a cold-room where the samples were stored at in situ water temperature (9–11.5◦C) and in dim light. Sub-samples were
taken using Teflon tubing and gas-tight syringes (20 mL) af-ter slowly rotating the aspirators to re-suspend particulate matter.
2.3 Quantification of sulfur compounds
Particulate DMSP (DMSPp): Slow syringe filtration was used to filter 5 to 20 mL of sample through 25 mm glass-fibre filters (Whatman GF/F). The filtrate was directly in-jected into a purge vessel for the analysis of DMS (see be-low). Thereafter, the filters were folded and placed into glass vials containing NaOH, using 3 mL of 500 mmol L−1 NaOH in 4 mL screw-capped vials (days 1 to 4) or 13 mL of 500 mmol L−1NaOH in 20 mL crimp-sealed vials (days 5 to 24). The alkaline hydrolysis of DMSP resulted in equimo-lar quantities of DMS. Vials were sealed immediately with Teflon-coated septa, stored in the dark and transported to our laboratory at the University of East Anglia (UEA). The headspace analysis of DMS resulting from DMSPp cleav-age commenced with a 24 h incubation of the vials at a stan-dard temperature of 30◦C before manual injection of 50 to
200µL of headspace for quantitative analysis of DMS using gas chromatography and flame-photometric detection (Shi-madzu GC-2010 with 30 m×0.53 mm CP-Sil 5CB capillary column). DMS standards for calibration were prepared us-ing commercial DMSP standard (Centre for Analysis, Spec-troscopy and Synthesis (CASS), University of Groningen Laboratories, The Netherlands) at a final concentration of 0.3 to 3µmol DMS L−1 added to vials containing 3 or 13 mL 500 mmol L−1NaOH. The detection limit for a 20 ml sample was about 2 nmol L−1 DMSP. The analytical error was less than 12%, as estimated from a comparison of repli-cate samples (n=16).
DMS: After filtration for DMSPp, 5 to 18 mL of the fil-trate was used for DMS analysis. The analytical volumes for the DMS measurements were adjusted during the course of the experiment to accommodate changes in concentra-tion. DMS measurements were conducted within 2 h of sampling using the gas chromatographic system described above, in combination with a purge-and-trap system for cryo-genic enrichment of DMS at −150◦C (details in Vogt et
al. (2008) and Turner et al. (1990)). Calibrations were car-ried out every 3–4 days with DMSP stock solution equivalent to 0.3 to 24.3 nmol L−1and addition of NaOH to more than 500 mmol L−1. The detection limit of the above described gas chromatographic system was less than 0.3 nmol L−1 DMS. The analytical error was 6%, as estimated from repli-cate calibration standards (n=69).
Dissolved DMSP (DMSPd): After purging the water sam-ple for DMS analysis was comsam-pleted, 4 to 13 mL of purged, de-gassed sample was transferred into 20 mL vials and brought to a volume of 13 mL with MilliQ water for analysis of DMSPd. Samples were adjusted to 500 mmol L−1NaOH by adding 684µL of 10 mol L−1NaOH. Vials were immedi-ately capped with Teflon-coated crimp seals and stored in the dark prior to analysis. Samples were incubated at 30◦C for
24 h before manual injection of 200µL of headspace for the analysis of DMS using the gas chromatographic system de-scribed above. DMS concentrations were quantified via the addition of DMSP standard to 13 mL 500 mmol L−1NaOH at a final concentration of 6 to 60 nmol L−1. Detection limit in 13 mL of sample was about 1.3 nmol L−1DMSPd.
Total DMSP (DMSPt): Because of concerns about poten-tial filtration artifacts (Kiene and Slezak, 2006) we also con-sidered total DMSP (DMSPt) concentrations for our anal-yses. DMSPt was calculated as the sum of DMSPd and DMSPpconcentrations.
lyase activity (DLA): Measurements of
DMSP-lyase activity were conducted using headspace measure-ments of DMS using the methods described in Steinke et al. (2000) and Steinke et al. (2007). In brief, 250 to 300 mL of seawater was filtered through polycarbonate fil-ters of 47 mm diameter and 2µm pore size (Whatman Nu-clepore). The filters were folded twice and placed into cryo-vials before snap-freezing in liquid nitrogen and stor-age at −80◦C. DLA samples were transported on dry ice
to our laboratory at UEA. The DMSP-lyase was extracted using sonication on ice with a 3 mm sonotrode (5 bursts of 5 s at 5 W) into 1.8 mL of 300 mmol L−1sterile BTP buffer (1,3-bis[tris(hydroxymethyl)methylamino]propane) that was amended with 0.5 mol L−1NaCl at pH 8.2. Assays were con-ducted with 100 to 295µL of the crude extract and linear pro-duction of DMS was quantified at 30◦C for 15–45 min after
(c)
0 10 20 30 40
0 2 4 6 8 10 12 14 16 18 20 22 24 Day of Experiment
D
M
S [nM
]
M7 - 1xCO2 M8 - 1xCO2 M9 - 1xCO2
(b)
0 10 20 30 40
0 2 4 6 8 10 12 14 16 18 20 22 24 Day of Experiment
D
M
S [nM
]
M4 - 2xCO2 M5 - 2xCO2 M6 - 2xCO2 (a)
0 10 20 30 40
0 2 4 6 8 10 12 14 16 18 20 22 24 Day of Experiment
D
M
S [nM
]
M1 - 3xCO2 M2 - 3xCO2 M3 - 3xCO2
(d)
0 10 20 30 40
0 2 4 6 8 10 12 14 16 18 20 22 24 Day of Experiment
D
M
S
[nM
]
3xCO2
2xCO2 1xCO2
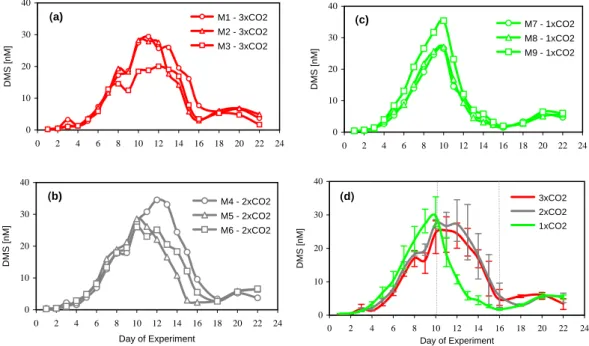
Fig. 1. DMS concentrations in nmol L−1for the 3 enclosures of each treatment (a) 3×CO
2(Mesocosms M1-M3) (b) 2×CO2(Mesocosms M4-M6) (c) 1×CO2(Mesocosms M7-M9) and (d) averages for all 3 treatments with range bars indicating the spread of the data. Green lines show present (1×CO2), grey lines 2×CO2and red lines depict 3×CO2treatments with pCO2of 350 ppmv, 700 ppmv and 1050 ppmv, respectively. Horizontal dotted lines indicate the separation between the 3 phases in DMS development (see text).
2.4 Additional measurements
Chlorophyll-a (chl-a) was determined in 250–500 mL sam-ple filtered through 25 mm glass-fibre filters (Whatman GF/F). Diagnostic pigments were extracted according to Derenbach (1969). Pigment distributions were quantified us-ing reverse-phase high-performance liquid chromatography (HPLC) analysis, using the method described in Barlow et al. (1997). CHEMTAX (Mackey et al., 1996) was used to derive the fraction of chl-aattributable to the dominant phy-toplankton groups. For more information on chlorophyll-a measurements refer to Schulz et al. (2007) and Riebesell et al. (2007). While chlorophyll-aand pigments were not anal-ysed in replicates during this study, the analytical error is estimated to lie within 10–15%, based on the results from previous analyses.
Counts of Emiliania huxleyi cells and other phyto-, bacterio- and virioplankton were conducted using a FAC-SCalibur flow cytometer (Becton-Dickinson) equipped with an air-cooled laser with an output power of 15 mW at 488 nm and a standard filter set-up. Phytoplankton counts were obtained from fresh samples at high flow rate (ca. 100µL min−1). All samples were analysed during 300 s, and populations were discriminated based on dot plots of side scatter and red fluorescence. For details on the flow cytomet-ric measurements, see Paulino et al. (2007). Heterotrophic bacteria and virus were detected and discriminated based on clusters observed in scatter plots of side scatter versus green
fluorescence, using SYBR Green I staining and following the method described in Larsen et al. (2007) and Paulino et al. (2007).
The partial pressure of CO2was quantified as described in Bellerby et al. (2007).
3 Results
3.1 DMS
(c)
0 100 200 300 400 500 600
0 2 4 6 8 10 12 14 16 18 20 22 24
Day of Experiment
D
M
S
Pt
[nm
ol
L
-1]
3xCO2 2xCO2 1xCO2
(a)
0 100 200 300 400 500
0 2 4 6 8 10 12 14 16 18 20 22 24
Day of Experiment
D
M
S
Pp
[nm
ol
L
-1 ]
(b)
0 20 40 60 80 100 120
0 2 4 6 8 10 12 14 16 18 20 22 24
Day of Experiment
D
M
S
Pd
[nm
ol
L
-1 ]
(d)
0 1000 2000 3000 4000 5000 6000
0 2 4 6 8 10 12 14 16 18 20 22 24
Day of Experiment
D
L
A
[n
mo
l L
-1 h -1 ]
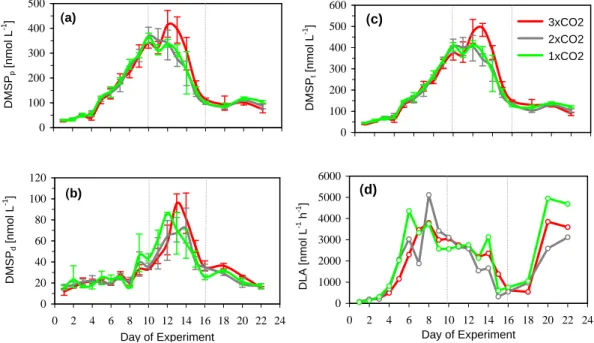
Fig. 2. Average (a) DMSPpin nmol L−1, (b) DMSPdin nmol L−1, (c) DMSPtin nmol L−1(d) DMSP-lyase activity (DLA) for selected bags 2 (3×CO2), 5 (2×CO2) and 8 (1×CO2) in nmol L−1h−1. Green lines show 1×CO2, grey lines 2×CO2and red lines depict 3×CO2 treatments with pCO2of 350 ppmv, 700 ppmv and 1050 ppmv, respectively. The values shown are average values for 3 replicate bags. Vertical bars in (a–c) indicate the range of the data. Horizontal dotted lines indicate the separation between the 3 phases in DMS development (see text).
all 1×CO2 enclosures. In the averages of the 2×CO2 and 3×CO2 treatments, DMS concentrations reached a plateau between day 10 and day 12, with maximum average con-centrations of 27.4 nmol L−1 (2×CO
2) and 25.3 nmol L−1 (3×CO2). In comparison to the 1×CO2treatments, the slope of the DMS decline was less steep in the 2×CO2and 3×CO2 treatments. On day 16, DMS concentrations were below 6 nmol L−1in all treatments. Phase 3 (days 17–22) is char-acterised by the onset of a smaller bloom of Synechococcus and dinoflagellates, which lead to a small increase in DMS concentrations in all treatments.
A two-way analysis of variance (ANOVA) with log trans-formed data for the 3 treatments showed that the tempo-ral development of DMS between the 3 treatments was significantly different (Fig. 1d; F=8.157, df =2, σ <0.001,
p=0.05)3. A posteriori testing with a Bonferroni test showed significant differences between the 1×CO2 and 2×CO2 treatments (σ <0.001, p=0.05). The significance of the differ-ence between 1×CO2and 3×CO2(σ=0.063, p=0.05) proved inconclusive and the difference between 2×CO2and 3×CO2 (σ=0.192, p=0.05) was not significant at the 95% confidence level.
The calculation of time integrated averages of DMS (days 0–22) showed that over the whole duration of the experi-ment, 25% more DMS was produced in 3×CO2 and 14% 3F = ratio of mean squares, df = degrees of freedom,σ=
sig-nificance of F-test and p = level of confidence.
more DMS in 2×CO2than in 1×CO2in absolute terms. Us-ing ANOVA, however, we did not find sufficient evidence to support that these differences in integrated DMS concentra-tions were significant (F=1.799, df =2,σ=0.244, p=0.05) at the 95% confidence level. This is due to the small sample size and a considerable spread in the means for each of the three treatments.
3.2 DMSPp, DMSPd, DMSPt
The differences in DMS concentrations between present and enhanced pCO2treatments were not reflected in the particu-late DMSP concentrations (Fig. 2a). This was also true for the dissolved fraction (Fig. 2b) and for total DMSP (Fig. 2c). As all enclosures showed very similar concentration pat-terns, we only show the mean concentrations for each treat-ment. At the beginning of the experiment, DMSPp con-centrations were below 50 nmol L−1in all treatments. After day 4, DMSPp rapidly increased in all treatments, and was maximal on day 10 in 1×CO2 (366 nmol L−1)and 2×CO2 (370 nmol L−1) and on day 12 in 3×CO
2 (415 nmol L−1). Thereafter, DMSPpdeclined in all treatments. DMSPd con-centrations remained constant at around 20 nmol L−1 until day 8 of the experiment, when it increased for all treat-ments. DMSPdconcentrations peaked on day 12 in 1×CO2 (86 nmol L−1), on day 14 in 2×CO
(a)
0 5 10 15
0 2 4 6 8 10 12 14 16 18 20 22 24
Day of Experiment
C
hl
or
ophy
ll-a
[µ
g L
-1] (b)
0 2 4 6
0 2 4 6 8 10 12 14 16 18 20 22 24
Day of Experiment
E
. hux
ley
i [10
6 c
el
ls
L
-1 ]
3xCO2 2xCO2
1xCO2
Fig. 3. (a) Chl-ainµg L−1and (b) E. huxleyi abundance in 106cells L−1plotted as a function of time. Green lines show 1×CO 2, grey lines 2×CO2and red lines depict 3×CO2treatments with pCO2of 350 ppmv, 700 ppmv and 1050 ppmv, respectively. The values shown are average values for 3 replicate bags. Vertical bars indicate the range of the data. Horizontal dotted lines indicate the separation between the 3 phases in DMS development (see text).
steadily after day 4 and reached a first peak on day 10, with average DMSPt concentrations of 374 nmol L−1in 1×CO2, 405 nmol L−1 in 2×CO2 and 410 nmol L−1 in 3×CO2. DMSPt concentrations in 1×CO2 and 2×CO2 declined af-ter day 10 in a similar fashion. In the 3×CO2 treatments, DMSPt concentrations showed a brief increase and reached a maximal average concentration of 493 nmol L−1on day 13 before declining.
3.3 DMSP-lyase activity
The measured DMSP-lyase activity (DLA) was comprised of the activity of DMSP-lyase from algae and attached bacteria and has been analyzed without replication for each treatment (Fig. 2d). Due to our choice of filter (pore size of 2µm), the potential contribution of many non-attached bacteria to DMSP-lyase activity was not included. We show data from mesocosm bags 2 (3×CO2), 5 (2×CO2), and 8 (1×CO2), because most other measured parameters from collaborat-ing groups are available for these bags. DLA peaked on day 6 for the present (4354 nmol L−1h−1), and on day 8 for 2×CO2and 3×CO2treatments with values of 5116 and 3801 nmol L−1h−1, respectively. After day 8, DLA de-creased gradually in all treatments, until a minimum in ac-tivity was reached in all bags on day 15. After day 18, DLA increased rapidly in all treatments and reached a second maximum on day 20, with 4952 nmol L−1h−1for 1×CO
2, 2590 nmol L−1h−1 for 2×CO
2 and 3849 nmol L−1h−1 for 3×CO2treatments.
3.4 Ecosystem composition
All bags showed similar chl-aconcentrations (Fig. 3a), with chl-a being slightly lower in 1×CO2 than in 2×CO2 and 3×CO2. The maximum of average chl-a occurred on day 10 in all treatments. A succession of different phytoplankton taxa occurred during the course of the experiment (Riebesell et al., 2007). Between days 6 and 10, when most of the DMS was accumulated, the bloom was dominated by diatoms and
prymnesiophytes, including lithed E. huxleyi cells (Fig. 3b). During the whole study period, prasinophytes contributed up to 20% to total chl-a. Towards the end of the bloom, af-ter day 18, dinoflagellate and Synechococcus species con-tributed significantly to total chlorophyll (Riebesell et al., 2007). A similar succession of species was observed in all treatments.
3.5 Contribution of the dominant phytoplankton groups to measured DMSPp
Table 1. Selected Spearman rank correlations (rs) between DMS, DMSPt, DLA and ecosystem parameters (days 0–22). Significance of correlations rejected at the 95% level (ns). Respective treatment (1×CO2, 2×CO2and 3×CO2) determined by the label in each row of the table.
DMS DMSPt DLA
DMS (1×CO2) 1.00 0.8 0.68
DMS (2×CO2) 1.00 0.98 0.8
DMS (3×CO2) 1.00 0.94 0.72
DMSPt (1×CO2) 0.8 1.00 0.49
DMSPt (2×CO2) 0.98 1.00 0.60 DMSPt (3×CO2) 0.94 1.00 0.51 DLA (1×CO2, M8) 0.68 0.49 1.00 DLA (2×CO2, M5) 0.80 0.60 1.00 DLA (3×CO2, M2) 0.72 0.51 1.00
chl-a(1×CO2) 0.82 0.84 ns
chl-a(2×CO2) 0.91 0.92 0.69
chl-a(3×CO2) 0.89 0.86 ns
E. huxleyi (1×CO2) 0.79 0.62 ns
E. huxleyi (2×CO2) 0.63 0.59 ns
E. huxleyi (3×CO2) 0.61 0.52 ns
Total Prymnesiophytes (1×CO2) 0.77 0.81 ns Total Prymnesiophytes (2×CO2) 0.90 0.90 ns Total Prymnesiophytes (3×CO2) 0.92 0.93 ns Total nanophytoplankton (1×CO2) 0.77 ns ns Total nanophytoplankton (2×CO2) 0.56 0.56 0.58 Total nanophytoplankton (3×CO2) 0.72 0.64 ns
3.6 Relationships between DMS, DMSPt, DLA and chlorophyll-a
We used Spearman rank correlation (rs) to study the tempo-ral correlation between DMS, DMSPt, DLA and chl-a con-centrations (Table 1). As a general trend, DMS, DMSPt and chl-a tended to be more closely correlated in 2×CO2 and 3×CO2 than in 1×CO2. DMSPt and chl-a were tempo-rally correlated in all 3 treatments and over the whole du-ration of the experiment (n=16; 1×CO2: rs=0.84, 2×CO2: rs=0.92, 3×CO2: rs=0.86). DMS and chl-a were tempo-rally correlated in all treatments (n=16; 1×CO2: rs = 0.82, 2×CO2: rs=0.91, 3×CO2: rs=0.89), as were DMS and DMSPt (n=19; 1×CO2:rs=0.80, 2×CO2:rs=0.98, 3×CO2: rs=0.94). The lower correlations in 1×CO2in the latter two cases are due to the steep decline of DMS concentrations in 1×CO2after day 10. The high correlations of DMS, DMSPt and chl-a point at a tight temporal coupling of these pa-rameters; indeed there was only a small (1–2 days, 2×CO2, 3×CO2) or no phase lag (1×CO2) between the peaks of these 3 compounds for all 3 treatments.
DLA was correlated with both DMS (n=19; 1×CO2: rs=0.68, 2×CO2: rs=0.80, 3×CO2: rs=0.72) and to a lesser extent with DMSPt(n=19; 1×CO2:rs=0.49, 2×CO2:
(a)
0.00 0.03 0.06 0.09
0 2 4 6 8 10 12 14 16 18 20 22 24
Day of Experiment
DMS
DMS
Pt
-1 [
rel
.
no.
] 3xCO2
2xCO2 1xCO2
(b)
0 20 40 60
0 2 4 6 8 10 12 14 16 18 20 22 24
Day of Experiment
DMS
Pt
chl
-a
-1 [
nmol
g
-1]
(c)
0 1 2 3 4
0 2 4 6 8 10 12 14 16 18 20 22 24 Day of Experiment
DM
S
chl-a
-1 [
nm
ol
g
-1]
Fig. 4. Mean ratios of (a) DMS to DMSPt (b) DMSPt to chl-ain nmolµg−1and (c) DMS to chl-ain nmolµg−1for the 1×CO
2 (green lines), 2×CO2 (grey lines) and 3×CO2 (red lines) treat-ments. Horizontal dotted lines indicate the separation between the 3 phases in DMS development (see text).
rs=0.60, 3×CO2: rs=0.51). However, only in 2×CO2 did DLA correlated with chl-a(rs=0.69).
3.7 Relationships between sulphur compounds and phyto-plankton community composition
As above, we used Spearman rank correlation to study the dynamics of the sulphur compounds and ecosystem vari-ables (Table 1). In all treatments, DMS concentrations were strongly correlated with total prymnesiophyte chl-a (1×CO2: rs=0.77, 2×CO2: rs=0.90, 3×CO2: rs=0.92). DMS and E. huxleyi numbers were well correlated in 1×CO2 (rs=0.79) and slightly less in 2×CO2(rs=0.63) and 3×CO2 (rs=0.61). DMS and E. huxleyi cell numbers showed a lag of ca. 2 days between their respective peaks for all 3 treatments. Furthermore, DMS correlated with total nanophytoplankton abundance (Table 1), which we defined to be the sum of E.
huxleyi, and the abundance of two different
nanophytoplank-ton groups, as determined by flow cytometry (Paulino et al., 2007).
During phase 1, DLA correlated well with dinoflagellate abundances, but correlations throughout the whole duration of the experiment were significant only in 1×CO2(rs=0.57). During phase 3 DLA was linearly related to dinoflagellate abundances, with highR2values (n =4, 1×CO2: R2=0.97, 2×CO2: R2=0.93, 3×CO2: R2=0.88). Only in 2×CO2did DLA correlate significantly with the abundance of total bac-teria (Allgaier et al., 2008). DLA did not correlate signif-icantly with any of the biological rate measurements, such as primary production (Egge et al., 2007), bacterial protein production (BPP) or cell specific BPP (Allgaier et al., 2008).
4 Discussion
Several previous mesocosm studies conducted at the same facility in Bergen report DMSP, DMS and chl-a concentra-tions under present CO2 (Levasseur et al., 1996; Williams and Egge, 1998; Wilson et al., 1998; Steinke et al., 2007). The DMSP and DMS concentrations we found are within the range of concentrations found in previous mesocosm studies, but concentrations vary with respect to the boundary condi-tions of the experiments, i.e. they depend on the organisms dominating the bloom and the manipulations under which the system was investigated. The species composition reported from this experiment is typical for waters in the investigated region and the time of the year. However, temperature and light intensities were unusually low for May, which could have influenced the bloom development and species succes-sion (Schulz et al., 2007).
In contrast to a previous CO2enrichment study (Engel et al., 2005) conducted under very similar experimental con-ditions, only few biological parameters showed CO2-related effects: Neither HPLC pigment analyses nor flow cytome-try detected significant phytoplankton species shifts between treatments. The ecosystem composition, bacterial and phyto-plankton abundances and productivity, grazing rates and total grazer abundance and reproduction were not significantly
af-fected by CO2induced effects (Riebesell et al., 2007; Riebe-sell et al., 2008; Egge et al., 2007; Paulino et al., 2007; Larsen et al., 2007; Suffrian et al., 2008; Carotenuto et al., 2007). This finding suggests that the system under study was surprisingly resilient to abrupt and large pH changes. 4.1 DMSP and DMS
The resilience of the system is well reflected in the suite of marine biogenic sulphur compounds. There were no differ-ences in DMSPp, DMSPd, DMSPt or DLA and only small differences in the temporal development of DMS. These dif-ferences in DMS concentrations may be due to several fac-tors, as discussed below:
Prymnesiophytes such as E. huxleyi are high DMS produc-ers and some have been found to be affected by ocean acid-ification (Riebesell, 2004). Furthermore, prymnesiophytes dominated the phytoplankton bloom in this experiment and possibly were important players in the production of DMSP and DMS during this experiment. DMS and DMSP corre-lated strongly with total prymnesiophyte chl-a in all treat-ments, in particular for the 2×CO2and 3×CO2treatments (Table 1). DMS and DMSP also correlated well with E.
hux-leyi, particularly in the 1×CO2 treatment (Table 1). This finding, along with the fact that significantly more DMSP was produced by all prymnesiophytes than by E. huxleyi points at the presence of other, DMSP-producing prymne-siophyte species unidentified by HPLC analysis or flow cy-tometry during this experiment.
While there were no direct observations of prymnesio-phytes other than E. huxleyi at the species level, indirect ob-servations suggest the presence of at least one other prym-nesiophyte: Larsen et al. (2007) found evidence for the presence of a viruses identified as CeV, a virus infecting the prymnesiophyte Chrysochromulina ericina. The genus
Chrysochromulina can produce DMSP, with a DMSP cell
Differences in viral infection of C. ericina, however, could potentially explain parts of the observed differences in DMS concentration.
Observed small differences in E. huxleyi cell numbers (see Fig. 3b) could only partly account for the differences in DMS concentrations between the treatments. While flow cytome-try determines the number of lithed E. huxleyi cells, unlithed
E. huxleyi cells are measured as part of the other
nanophy-toplankton groups. Changes in the fraction of unlithed or “naked” E. huxleyi could account for changes in DMS. How-ever, the fraction of unlithed cells is expected to be small and constant (A. Paulino, personal communication).
Even though we could exclude major shifts in ecosystem composition (Paulino et al., 2007; Larsen et al., 2007) to ac-count for the differences in DMS, the effect of smaller shifts in species succession could not be studied with our measure-ments. Additionally, changes in algal physiology leading to altered DMS exudation rates or changes in DMSP cell quota of individual taxa were not studied.
During the course of the experiment a statistically signifi-cant difference in the community structure of free-living bac-teria (0.2–5.0µm fraction) was detected for the three differ-ent treatmdiffer-ents (Allgaier et al., 2008). Denaturing Gradidiffer-ent Gel Electrophoresis (DGGE) band pattern analysis showed that while the populations of the 1×CO2 and 2×CO2 treat-ments were similar to the fjord population, the free-living bacterial communities of the 3×CO2 treatments diverged much more from the original population. Despite these clear differences in bacterial community structure, the DMS con-centration patterns of 3×CO2and 2×CO2were very similar. Currently, there is no quantitative evidence for an effect of pCO2on bacteria that degrade DMS or DMSP, but such an effect could lead to different DMSP or DMS consumption rates or to a different microbial DMS yield from DMSP, re-sulting in differences in DMS concentration patterns. The community structure of attached bacteria (>5.0µm) did not exhibit statistical differences between the treatments.
Taken together, processes related to bacterial and viral ac-tivities may explain part of the difference in amount and tem-poral structure of DMS that we observed.
4.2 DLA
In general, DLA was considerably higher than previous mea-surements in E. huxleyi dominated waters in the North At-lantic and North Sea (Steinke et al., 2002a, b) and in a meso-cosm experiment in 2003 (Steinke et al., 2007). No clear difference between the CO2treatments was observed. DLA correlated well with dinoflagellate and prymnesiophyte chl-a during phase 1. Hence, it is likely that phytoplanktonic DMSP-lyase contributed to DMS production during phase 1. Coccolithophores such as E. huxleyi contain the enzyme DMSP-lyase and they dominated the bloom during days 1– 10. Except for the 2×CO2 treatment during days 0–10 (rs=0.82), we did not find significant temporal correlations
between DLA and E. huxleyi abundances. To our knowl-edge there is no published work investigating DMSP-lyase activity in C. ericina. In the beginning of the experiment, di-noflagellate chlorophyll levels were low, but at the end of the bloom (day 18 to day 22), a dinoflagellate bloom occurred in the mesocosms (Riebesell et al., 2007). Some dinoflagel-lates contain high amounts of DMSPpper cell and can show high DMSP-lyase activity. The beginning of their bloom coincided well with the second increase in DLA after day 18. We found a significant linear correlation between DLA and dinoflagellates during phase 3 of the experiment, hence some of the DMSP-lyase activity detected in this phase of the bloom could be due to the increasing abundance of dinoflag-ellates. DLA did not correlate with any of the small phyto-plankton groups, nor with most bacterial parameters. Only in 2×CO2did DLA (anti-)correlate with bacterial abundance.
Unfortunately, we cannot yet assess the importance of al-gal DLA for overall DMS accumulation in this study. DLA correlated much stronger and more consistently with DMS and DMSPt than with any of the phyto- and bacterioplank-ton parameters.
4.3 Comparison with other DMS measurements during PeECE III
Several groups measured DMS during PeECE III. Air con-centrations of DMS were in phase with our observed water measurements (Sinha et al., 2007; Wingenter et al., 2007) and there was a good general agreement between the water measurements (Vogt et al., 2008; Wingenter et al., 2007). While we find our absolute values for the integrated DMS mean concentrations to be very similar to those reported in Wingenter et al. (2007), we cannot confirm the conclusions of these authors that the differences were statistically signif-icant. This discrepancy does not arise at the data level, but through the use of different statistical procedures for the in-terpretation of the results: Firstly, these authors report their differences to be statistically significant at the 80% and 90% confidence level, levels at which the significance of differ-ences is generally rejected (Cowles and Davis, 1982 and ref-erences therein). Secondly, Wingenter et al. (2007) com-pare the means of 3 populations in pairs of 2 with respect to a fixed factor (CO2) using a Student’s t-test, which in-creases the probability of committing type I errors, i.e. the null hypothesis (no differences between populations) is re-jected when in fact it is true (see e.g. Zar, 1999). We use One-way ANOVA, known to decrease the probability of type I errors and decided to adopt a more stringent significance criterion.
experimental set-up and treatment of the mesocosms was similar in both Avgoustidi et al. and our study (Engel et al., 2005). Despite this, chl-a concentrations were approx-imately 3 times higher in the present study. Furthermore, our maximum DMSPpvalues (data not shown) were approx-imately 2 times higher than those reported in Avgoustidi et al. Maximal DMS values were similar in both experiments, but the temporal development of the sulfur compounds was different. Whereas DMS, DMSPp and chl-a were tightly coupled in the present study, the DMS peaks show a distinct lag behind the DMSPp peaks in Avgoustidi et al. Hence, a major difference between the two experiments is the tem-poral yield of DMS from DMSP. Avgoustidi et al. found a significant decrease in DMS concentrations for treatments with elevated pCO2. Despite the clear differences in the tem-poral dynamics of DMS concentrations, our results do not confirm the findings by Avgoustidi et al. when integrated over the whole duration of the experiment, but do when inte-grated up to day 12. This may partly be explained by differ-ences in E. huxleyi cell number between the two experiments. While E. huxleyi cell numbers in our study were low (max. 5×10⁶cells mL−1), cell numbers in Avgoustidi’s experiment were considerably higher (up to 56×106cells mL−1). Both number densities are well within the natural range of cell numbers found for E. huxleyi in the open ocean (J. Egge, personal communication).
The behavior of DMS concentration patterns between per-turbed and unperper-turbed treatments agreed for both studies during the exponential growth phase (days 0–10), but di-verged for the post-bloom phase (days 11–22). Although poorly understood at present, changes in physiology could account for the reduced DMS production in 2×CO2 and 3×CO2during the E. huxleyi bloom until day 10 in this study. Had the cell number been ten-fold, as in Avgoustidi et al., this effect might have been amplified and the results may have been more similar. Additional processes, including bacte-rial uptake and catabolism of DMSP, could have influenced the DMS dynamics after day 12 when the E. huxleyi bloom collapsed. DMS emissions by prymnesiophyte species other than E. huxleyi (such as Chrysochromulina ericina) may have contributed to the prolonged peak in the perturbed treat-ments. However, lack of data on the bacterial cycling of DMSP and DMS under various pCO2 conditions precludes a full assessment of DMS dynamics during the second phase of the present experiment.
4.5 DMS and ocean acidification
The implications of our findings for the future global ocean and climate are still unclear. Firstly, the changes in pCO2 studied here have been triggered abruptly from present values on day 0 to double and triple concentrations on day 2, without allowing the systems under study to fully acclimate or adapt. Future ocean acidification will proceed at a much slower rate and this temporal scale difference could potentially
al-leviate the consequences of ocean acidification. Secondly, blooms of the magnitude we observed in this mesocosm study in terms of chlorophyll-a are rare in the open ocean. DMSPtconcentrations of 300–500 nmol L−1and DMS con-centrations of 40 nmol L−1are untypical in the open ocean, where the 95 percentile of all measured DMS concentration is below 5 nmol L−1(Kettle and Andreae, 2000). As the gions where DMS fluxes are most important are remote re-gions such as the Southern Ocean where chlorophyll is sig-nificantly lower, we cannot extrapolate our results to global scales at this point. Thirdly, mesocosms do not seem to re-spond in a consistent way to manipulations such as in CO2 enrichment studies. We cannot confirm the finding of previ-ous studies (Avgprevi-oustidi et al., 20082) that DMS accumulation was significantly reduced under simulated seawater acidifi-cation. However, DMS concentrations varied between treat-ments in both studies. In particular, DMS proved to be one of the few measured parameters that had a clear response to the CO2perturbation in this mesocosm study.
5 Summary and conclusion
We studied DMS, DMSPp and DMSPd dynamics under 3 different pCO2conditions during a mesocosm experiment in Norway. There were no statistically significant differences in the temporal development of DMSPt, DMSPp and DMSPd concentrations and in DLA, which hints at a certain resilience of the studied system to changes in pCO2. However, we found differences in the temporal development of DMS con-centrations. While DMS stayed elevated in the treatments with elevated pCO2, we observed a steep decline in DMS concentration in the treatment with low pCO2. As the ra-tio of DMS to DMSP varied strongly between treatments, but DMSP per chl-a did not, we hypothesize that the ob-served differences result from differences in DMS produc-tion or degradaproduc-tion mechanisms rather than from large shifts in community structure. Observed differences in bacterial community structure and viral abundances may play a role, but other mechanisms such as differences in exudation rates etc. cannot be excluded.
it be possible to separate physiological processes from the ef-fect of trophic interactions on DMS dynamics and to assess possible implications for DMS fluxes under future climate change.
Acknowledgements. This work was part of the Pelagic Ecosystem CO2Enrichment Study (PeECE III) in 2005. The authors wish to thank all participants in the PeECE III experiment for their work and assistance during the experiment. We thank C. Neil, M. All-gaier, R. Thyrhaug, A. Larsen, K. Suffrian, J. C. Nejstgaard and Y. Carotenuto for providing necessary data for this work and for fruitful discussions. We also thank N. Yassaa, V. Sinha, O. Wingen-ter and A. Colomb for sharing additional DMS data and for stim-ulating collaborations. The staff at the Marine Biological Station, University of Bergen, in particular Tomas Sørlie and Agnes Aadne-sen, and the Bergen Marine Research infrastructure (RI) are grate-fully acknowledged for support in mesocosm logistics We further-more thank A. Grant and T. Urquiza-Haas for advice on statistical methods, and J. Williams and E. Buitenhuis for useful comments on the manuscript.
This work was funded by the Marie Curie Training Network GREENCYCLES, Contract Number MC-RTN- 512464. Support for MS was provided by the UK Natural Environment Research Council (NERC; NER/I/S/2000/00897 and NE/B500282/1).
Edited by: C. Heinze
References
Allgaier, M., Riebesell, U., Vogt, M., Thyrhaug, R., and Grossart, H. P.: Coupling of heterotrophic bacteria to phytoplankton bloom development at different pCO2levels: a mesocosm study, Bio-geosciences Discuss., 5, 317–359, 2008,
http://www.biogeosciences-discuss.net/5/317/2008/.
Bellerby, R. G. J., Schulz, K. G., Riebesell, U., Neill, C., Nondal, G., Johannessen, T., and Brown, K. R.: Marine ecosystem com-munity carbon and nutrient uptake stoichiometry under varying ocean acidification during the PeECE III experiment, Biogeo-sciences Discuss., 4, 4631–4652, 2007,
http://www.biogeosciences-discuss.net/4/4631/2007/.
Bucciarelli, E. and Sunda, W. G.: Influence of CO2, nitrate, phos-phate, and silicate limitation on intracellular dimethylsulfonio-propionate in batch cultures of the coastal diatom Thalassiosira pseudonana, Limnol. Oceanogr., 48, 2256–2265, 2003. Buitenhuis, E. T., De Baar, H. J. W., and Veldhuis, M. J. W.:
Pho-tosynthesis and calcification by Emiliania huxleyi (Prymnesio-phyceae) as a function of inorganic carbon species, J. Phycol., 35, 949–959, 1999.
Brimblecombe, P. and Shooter, D.: Photooxidation of dimethylsul-fide in aqueous solution, Mar. Chem., 19, 4, 343–353, 1986. Brussaard, C. P. D., Kempers, R. S., Kop, A. J., and Riegman, R.:
Virus-like particles in a summer bloom of Emiliania huxleyi in the North Sea, Aquat. Micr. Biol., 10, 105–113, 1996.
Caldeira, K. and Wickett, M. E.: Ocean model predictions of chemistry changes from carbon dioxide emissions to the at-mosphere and ocean, J. Geophys. Res.-Oceans, 110, C09S04, doi:10.1029/2004JC002671, 2005.
Carotenuto, Y., Putzeys, S., Simonelli, P., Paulino, A., Meyerh¨ofer, M., Suffrian, K., Antia, A., and Nejstgaard, J. C.: Copepod
feed-ing and reproduction in relation to phytoplankton development during the PeECE III mesocosm experiment, Biogeosciences Discuss., 4, 3913–3936, 2007,
http://www.biogeosciences-discuss.net/4/3913/2007/.
Charlson, R. J., Lovelock, J. E., Andreae, M. O., and Warren, S. G.: Oceanic phytoplankton, atmospheric sulfur, cloud albedo and climate, Nature, 326, 6114, 655–661, 1987.
Cowles, S. M. and Davis, C.: On the origins of the .05 level of statistical significance, Amer. Psychol., 37, 553–558, 1982. Dacey, J. W. H. and Wakeham, S. G.: Oceanic dimethylsulfide –
production during zooplankton grazing on phytoplankton, Sci-ence, 233, 4770, 1314–1316, 1986.
Egge, J., Thingstad, F., Engel, A., Bellerby, R. G. J., and Riebe-sell, U.: Primary production at elevated nutrient and pCO2 lev-els, Biogeosciences Discuss., 4, 4385–4410, 2007,
http://www.biogeosciences-discuss.net/4/4385/2007/.
Engel, A., Zondervan, I., Aerts, K., Beaufort, L., Benthien, A., Chou, L., Delille, B., Gattuso, J. P., Harlay, J., Heemann, C., Hoffmann, L., Jacquet, S., Nejstgaard, J., Pizay, M. D., Rochelle-Newall, E., Schneider, U., Terbrueggen, A., and Riebesell, U.: Testing the direct effect of CO2concentration on a bloom of the coccolithophorid Emiliania huxleyi in mesocosm experiments, Limnol. Oceanogr., 50, 2, 493–507, 2005.
Geider, R. J., Macintyre, H. L., and Kana, T. M.: Dynamic model of phytoplankton growth and acclimation: Responses of the bal-anced growth rate and the chlorophyll a:carbon ratio to light, nutrient-limitation and temperature, Mar. Ecol.-Prog. Ser., 148, 187–200, 1997.
Holligan, P. M., Fernandez, E., Aiken, J., Balch, W. M., Boyd, P., Burkill, P. H., Finch, M., Groom, S. B., Malin, G., Muller, K., Purdie, D. A., Robinson, C., Trees, C. C., Turner, S. M., and Vanderwal, P.: A Biogeochemical Study of the Coccolithophore, Emiliania-Huxleyi, in the North-Atlantic, Global Biogeochem. Cy., 7, 4, 879–900, 1993.
Howard, E. C., Henriksen, J. R., Buchan, A., Reisch, C. R., Buergmann, H., Welsh, R., Ye, W. Y., Gonzalez, J. M., Mace, K., Joye, S. B., Kiene, R. P., Whitman, W. B., and Moran, M. A.: Bacterial taxa that limit sulfur flux from the ocean, Science, 314, 5799, 649–652, 2006.
Keller, M. D., Bellows, W. K., and Guillard, R. R. L.: Dimethyl sulfide production in marine phytoplankton, ACS Symposium Series, 393, 167–182, 1989.
Kettle, J. and Andreae, M. O.: Flux of dimethylsulfide from the oceans: A comparison of updated data sets and flux models, J. Geophys. Res., 105(26), 793–808, 2000.
Kieber, D. J., Jiao, J. F., Kiene, R. P., and Bates, T. S.: Impact of dimethylsulfide photochemistry on methyl sulfur cycling in the equatorial Pacific Ocean, J. Geophys. Res.-Oceans, 101(C2), 3715–3722, 1996.
Kiene, R. P.: Microbial sources and sinks for methylated sulfur compounds in the marine environment, in: Microbial growth on C1 compounds, Vol. 7., edited by: Kelly, D. P. and Murrell, J. C., 15–36, 1993.
Kiene, R. P. and Linn, L. J.: The fate of dissolved dimethylsul-foniopropionate (DMSP) in seawater: Tracer studies using35 S-DMSP, Geochim. Cosmochim. Ac., 64, 16, 2797–2810, 2000. Kiene, R. P. and Slezak, D.: Low dissolved DMSP concentrations in
Kleypas, J. A., Feely, R. A., Fabry, V. J., Langdon, C., Sabine, C. L., and Robbins, L. L.: Impacts of Ocean Acidification on Coral Reefs and Other Marine Calcifiers: A Guide for Future Research, report of a workshop held 18–20 April 2005, St. Petersburg, FL, sponsored by NSF, NOAA, and the U.S. Geological Survey, 88 pp., 2006.
Larsen, J. B., Larsen, A., Thyrhaug, R., Bratbak, G., and Sandaa R.-A.: Marine viral populations detected during a nutrient induced phytoplankton bloom at elevated pCO2 levels, Biogeosciences Discuss., 4, 3961–3985, 2007,
http://www.biogeosciences-discuss.net/4/3961/2007/.
Ledyard, K. M. and Dacey, J. W. H.: Microbial cycling of DMSP and DMS in coastal and oligotrophic seawater, Limnol. Oceanogr., 41, 1, 33–40, 1996.
Levasseur, M., Michaud, S., Egge, J., Cantin, G., Nejstgaard, J. C., Sanders, R., Fernandez, E., Solberg, P. T., Heimdal, B., and Gosselin, M.: Production of DMSP and DMS during a meso-cosm study of an Emiliania huxleyi bloom: Influence of bacteria and Calanus finmarchicus grazing, Mar. Biol., 126, 4, 609–618, 1996.
Liss, P. S. and Slater, P. G.: Flux of gases across the air-sea interface, Nature, 247, 5438, 181–184, 1974.
Liss, P. S., Malin, G., Turner, S. M., and Holligan, P. M.: Dimethyl sulfide and Phaeocystis – A review, J. Mar. Syst., 5, 1, 41–53, 1994.
Mackey, M. D., Mackey, D. J., Higgins, H. W., and Wright, S. W.: CHEMTAX –A program for estimating class abundances from chemical markers: Application to HPLC measurements of phy-toplankton, Mar. Ecol.-Prog. Ser., 144, 1-3, 265–283, 1996. Malin, G., Turner, S., Liss, P., Holligan, P., and Harbour, D.:
Dimethylsulfide and dimethylsulphoniopropionate in the North-east Atlantic during the summer coccolithophore bloom, Deep-Sea Res. I, 40, 7, 1487–1508, 1993.
Malin, G., Wilson, W. H., Bratbak, G., Liss, P. S., and Mann, N. H.: Elevated production of dimethylsulfide resulting from viral in-fection of cultures of Phaeocystis pouchetii, Limnol. Oceanogr., 43, 6, 1389–1393, 1998.
Nevitt, G. A.: Dimethyl sulfide is part of the olfactory landscape de-tectable to Antarctic Procellariiform seabirds, Chemical Senses, 20, 6, 210–210, 1995.
Paulino, A. I., Egge J. K., and Larsen, A.: Effects of increased atmospheric CO2 on small and intermediate sized osmotrophs during a nutrient induced phytoplankton bloom, Biogeosciences Discuss., 4, 4173–4195, 2007,
http://www.biogeosciences-discuss.net/4/4173/2007/.
Rhodes, L. and Burke, B.: Morphology and growth character-istics of Chrysochromulina species (Haptophyceae = Prymne-siophyceae) isolated from New Zealand coastal waters, New Zealand J. Mar. Freshw. Res., 30, 91–103, 1996.
Riebesell, U., Zondervan, I., Rost, B., Tortell, P. D., Zeebe, R. E., and Morel, F. M. M.: Reduced calcification of marine plankton in response to increased atmospheric CO2, Nature, 407, 6802, 364–367, 2000.
Riebesell, U.: Effects of CO2enrichment on marine phytoplankton, J. Oceanogr., 60, 4, 719–729, 2004.
Riebesell, U., Schulz, K., Bellerby, R., Botros, M., Fritsche, P., Meyerh¨ofer, M., Neill, C., Nondal, G., Oschlies, A., Wohlers, J., and Z¨ollner, E.: Enhanced biological carbon con-sumption in a high CO2 ocean, Nature, 450(7169), 545-U10,
doi:10.1038/nature06267, 2007.
Riebesell, U., Bellerby, R. G. J., Grossart, H.-P., and Thingstad, F.: Mesocosm CO2perturbation studies: from organism to commu-nity level, Biogeosciences Discuss., 5, 641–659, 2008,
http://www.biogeosciences-discuss.net/5/641/2008/.
Royal Society: Ocean acidification due to increasing atmospheric carbon dioxide, 2005.
Sabine, C. L., Feely, R. A., Gruber, N., Key, R. M., Lee, K., Bullis-ter, J. L., Wanninkhof, R., Wong, C. S., Wallace, D. W. R., Tilbrook, B., Millero, F. J., Peng, T. H., Kozyr, A., Ono, T., and Rios, A. F.: The oceanic sink for anthropogenic CO2, Science, 305, 5682, 367–371, 2004.
Schulz, K. G., Riebesell, U., Bellerby, R. G. J., Biswas, H., Mey-erh¨ofer, M., M¨uller, M. N., Egge, J. K., Nejstgaard, J. C., Neill, C., Wohlers, J., and Z¨ollner E.: Build-up and decline of organic matter during PeECE III, Biogeosciences Discuss., 4, 4539– 4570, 2007,
http://www.biogeosciences-discuss.net/4/4539/2007/.
Sinha, V., Williams, J., Meyerh¨ofer, M., Riebesell, U., Paulino, A. I., and Larsen, A.: Air-sea fluxes of methanol, acetone, acetalde-hyde, isoprene and DMS from a Norwegian fjord following a phytoplankton bloom in a mesocosm experiment, Atmos. Chem. Phys., 7, 739–755, 2007,
http://www.atmos-chem-phys.net/7/739/2007/.
Stefels, J. and Dijkhuizen, L.: Characteristics of DMSP-lyase in Phaeocystis sp (Prymnesiophyceae), Mar. Ecol. Prog. Ser., 131, 1–3, 307–313, 1996.
Stefels, J.: Physiological aspects of the production and conversion of DMSP in marine algae and higher plants, J. Sea Res., 43, 3–4, 183–197, 2000.
Stefels, J., Steinke, M., Turner, S., Malin, G., and Belviso, S.: Envi-ronmental constraints on the production and removal of the cli-matically active gas dimethylsulphide (DMS) and implications for ecosystem modelling, Biogeochemistry, 88, 1–3, 245–275, 2007.
Steinke, M. and Kirst, G. O.: Enzymatic cleavage of dimethyl-sulfoniopropionate (DMSP) in cell-free extracts of the ma-rine macroalga Enteromorpha clathrata (Roth) Grev, (Ulvales, Chlorophyta), J. Exp. Mar. Biol. Ecol., 201, 1–2, 73–85, 1996. Steinke, M., Wolfe, G. V., and Kirst, G. O.: Partial
characterisa-tion of dimethylsulfoniopropionate (DMSP) lyase isozymes in 6 strains of Emiliania huxleyi, Mar. Ecol. Prog. Ser., 175, 215–225, 1998.
Steinke, M., Malin, G., Turner, S. M., and Liss, P. S.: Determina-tions of dimethylsulphoniopropionate (DMSP) lyase activity us-ing headspace analysis of dimethylsulphide (DMS), J. Sea Res., 43, 3–4, 233–244, 2000.
Steinke, M., Malin, G., Archer, S. D., Burkill, P. H., and Liss, P. S.: DMS production in a coccolithophorid bloom: Evidence for the importance of dinoflagellate DMSP lyases, Aqu. Microb. Ecol., 26, 3, 259–270, 2002a.
Steinke, M., Malin, G., Gibb, S. W., and Burkill, P. H.: Vertical and temporal variability of DMSP lyase activity in a coccolithophorid bloom in the northern North Sea, Deep-Sea Res. II, 49, 15, 3001– 3016, 2002b.
Steinke, M., Stefels, J., and Stamhuis, E.: Dimethyl sulfide triggers search behavior in copepods, Limnol. Oceanogr., 51, 4, 1925– 1930, 2006.
of DMSP-lyases in axenic cultures and mesocosm populations of Emiliania huxleyi, Aquat. Sci., 69, 352–359, 2007.
Strom, S., Wolfe, G., Holmes, J., Stecher, H., Shimeneck, C., Lam-bert, S., and Moreno, E.: Chemical defense in the microplankton I: Feeding and growth rates of heterotrophic protists on the DMS-producing phytoplankter Emiliania huxleyi, Limnol. Oceanogr., 48, 1, 217–229, 2003.
Suffrian, K., Simonelli, P., Nejstgaard, J. C., Putzeys, S., Carotenuto, Y., and Antia, A. N.: Microzooplankton grazing and phytoplankton growth in marine mesocosms with increased CO2 levels, Biogeosciences Discuss., 5, 411–433, 2008,
http://www.biogeosciences-discuss.net/5/411/2008/.
Sunda, W., Kieber, D. J., Kiene, R. P., and Huntsman, S.: An an-tioxidant function for DMSP and DMS in marine algae, Nature, 418, 6895, 317–320, 2002.
Todd, J. D., Rogers, R., Li, Y. G., Wexler, M., Bond, P. L., Sun, L., Curson, A. R. J., Malin, G., Steinke, M., and Johnston, A. W. B.: Structural and regulatory genes required to make the gas dimethyl sulfide in bacteria, Science, 315, 5812, 666–669, 2007. Turner, S. M., Malin, G., Bagander, L. E., and Leck, C.: Interlabora-tory calibration and sample analysis of dimethyl sulfide in water, Mar. Chem., 29, 1, 47–62, 1990.
Vila-Costa, M., del Valle, D. A., Gonzalez, J. M., Slezak, D., Kiene, R. P., Sanchez, O. and Sim´o, R.: Phylogenetic identification and metabolism of marine dimethylsulfide-consuming bacteria, En-vironmental Microbiol., 8, 12, 2189–2200, 2006.
Vogt, M., Turner, S., Yassaa, N., Steinke, M.,Williams, J., and Liss, P.: Laboratory inter-comparison of dissolved dimethyl sulphide (DMS) measurements using purge-and-trap and solid-phase mi-croextraction techniques during a mesocosm experiment, Mar. Chem., 108(1–2), 32–39, 2008.
Wanninkhof, R. and Thoning, K.: Measurement of fugacity of CO2 in surface-water using continuous and discrete sampling meth-ods, Mar. Chem., 44, 2–4, 189–204, 1993.
Williams, P. J. L. and Egge, J. K.: The management and behaviour of the mesocosms, Estuar. Coast. Shelf. S., 46, 3–14, 1998. Wilson, W. H., Turner, S., and Mann, N. H.: Population dynamics
of phytoplankton and viruses in a phosphate-limited mesocosm and their effect on DMSP and DMS production, Estuar. Coast. Shelf. S., 46, 49–59, 1998.
Wingenter, O. W., Haase, K. B., Zeigler, M., Blake, D. R., Row-land, F. S., Sive, B. C., Paulino, A., Thyrhaug, R., Larsen, A., Schulz, K., Meyerh¨ofer, M., and Riebesell, U.: Unexpected con-sequences of increasing CO2and ocean acidity on marine pro-duction of DMS and CH2ClI: Potential climate impacts, Geo-phys. Res. Lett., 34(5), L05710, doi:10.1029/2006GL028139, 2007.
Wolfe, G. V. and Steinke, M.: Grazing-activated production of dimethyl sulfide (DMS) by two clones of Emiliania huxleyi, Lim-nol. Oceanogr., 41, 6, 1151–1160, 1996.
Wolfe, G. V., Steinke, M., and Kirst, G. O.: Grazing-activated chemical defence in a unicellular marine alga, Nature, 387, 6636, 894–897, 1997.
Wolfe, G. V.: The chemical defense ecology of marine unicellu-lar plankton: Constraints, mechanisms, and impacts, Biol. Bull., 198, 2, 225–244, 2000.
Zimmer-Faust, R. K., de Souza, M. P., and Yoch, D. C.: Bacterial chemotaxis and its potential role in marine dimethylsulfide pro-duction and biogeochemical sulfur cycling, Limnol. Oceanogr., 41, 1330–1334, 1996.