www.atmos-chem-phys.net/14/11843/2014/ doi:10.5194/acp-14-11843-2014
© Author(s) 2014. CC Attribution 3.0 License.
HO
2
NO
2
and HNO
3
in the coastal Antarctic winter night:
a “lab-in-the-field” experiment
A. E. Jones1, N. Brough1, P. S. Anderson1,*, and E. W. Wolff1,**
1British Antarctic Survey, Natural Environment Research Council, Cambridge, UK *now at: Scottish Association of Marine Science, Scottish Marine Institute, Oban, UK **now at: Dept of Earth Sciences, University of Cambridge, Cambridge, UK
Correspondence to:A. E. Jones ([email protected])
Received: 1 May 2014 – Published in Atmos. Chem. Phys. Discuss.: 20 May 2014 Revised: 12 September 2014 – Accepted: 6 October 2014 – Published: 12 November 2014
Abstract.Observations of peroxynitric acid (HO2NO2) and nitric acid (HNO3) were made during a 4 month period of Antarctic winter darkness at the coastal Antarctic research station, Halley. Mixing ratios of HNO3 ranged from instru-mental detection limits to ∼8 parts per trillion by volume (pptv), and of HO2NO2 from detection limits to ∼5 pptv; the average ratio of HNO3: HO2NO2was 2.0(±0.6) : 1, with HNO3always present at greater mixing ratios than HO2NO2 during the winter darkness. An extremely strong associa-tion existed for the entire measurement period between mix-ing ratios of the respective trace gases and temperature: for HO2NO2, R2= 0.72, and for HNO3, R2=0.70. We focus on three cases with considerable variation in temperature, where wind speeds were low and constant, such that, with the lack of photochemistry, changes in mixing ratio were likely to be driven by physical mechanisms alone. We de-rived enthalpies of adsorption (1Hads) for these three cases. The average1Hadsfor HNO3was−42±2 kJ mol−1and for HO2NO2was−56±1 kJ mol−1; these values are extremely close to those derived in laboratory studies. This exercise demonstrates (i) that adsorption to/desorption from the snow pack should be taken into account when addressing budgets of boundary layer HO2NO2and HNO3at any snow-covered site, and (ii) that Antarctic winter can be used as a natural “laboratory in the field” for testing data on physical exchange mechanisms.
1 Introduction
Peroxynitric acid (HO2NO2, also written as HNO4) and ni-tric acid (HNO3) are acidic gases that are of increasing inter-est to polar tropospheric chemistry. Their primary relevance is that they act as reservoir species for HOxand NOx, which are now recognised to drive the surprisingly vigorous oxida-tion chemistry that has been observed during Antarctic sum-mer (e.g. Davis et al., 2001; Chen et al., 2001). The spatial and temporal distribution of HO2NO2and HNO3across the polar regions thus becomes important for understanding the overall atmospheric chemical system, and models require de-tails of their sources, and any physical exchange process by which they move from one environmental compartment to another. Currently, many of these details are unknown.
The gas-phase chemistry of HO2NO2 and HNO3 is rel-atively straightforward. Peroxynitric acid is a somewhat unstable molecule that forms and dissociates through its temperature-dependent equilibrium reaction:
HO2+NO2+M↔HO2NO2+M, (R1)
which renders an increased stability for HO2NO2 at lower temperatures.
There are a number of photodissociation pathways which drive HO2NO2and HNO3chemistry under sunlit conditions. The most important are thought to be
HO2NO2+hν→HO2+NO2 (R2a)
Peroxynitric acid can also be lost through reaction with OH: HO2NO2+OH→H2O+NO2+O2. (R3) Gas-phase production of nitric acid proceeds via
OH+NO2+M→HNO3+M. (R4)
The major loss processes are reaction with OH and photoly-sis:
HNO3+OH→H2O+NO3HNO3+hν→OH+NO2. (R5) Both HO2NO2 (Ulrich et al., 2012) and HNO3 (Bartels-Rausch et al., 2002; Hudson et al., 2002; Ullerstam et al., 2005) have been shown in laboratory experiments to ad-sorb to ice surfaces. This conclusion is supported by field observations which have confirmed uptake of both HNO3 and HO2NO2 to snow surfaces (Huey et al., 2004; Slusher et al., 2002), and of HNO3 to cirrus clouds (Weinheimer et al., 1998; Popp et al., 2004; Ziereis et al., 2004). In gen-eral, therefore, in snow covered areas, or indeed regions of the atmosphere with lofted snow/ice, such as cirrus clouds or blowing/precipitating snow, physical adsorption of HNO3 and HO2NO2from the air to the snow/ice is likely to occur. The details of this uptake will differ somewhat between the two molecules because the partitioning coefficient of HNO3 is greater than that for HO2NO2. HNO3is thus more sticky than HO2NO2, and a higher fraction of HNO3 can be ex-pected on the ice surface compared with HO2NO2.
High resolution observations of HNO3and HO2NO2in the polar regions are scarce. Critically, both HO2NO2and HNO3 have been measured together during a number of Antarc-tic studies at high temporal resolution. These studies have included both ground-based experiments at the South Pole (Slusher et al., 2002; Huey et al., 2004) and airborne mea-surements across the wider Antarctic Plateau (Slusher et al., 2010).
The ground-based studies have revealed considerable inter-annual variability in summertime HNO3and HO2NO2 mixing ratios, but always of the order of 10 s of pptv at the South Pole. For example, the median observed HNO3 be-tween 16 and 31 December 2000 was 18.2 pptv and for HO2NO2was 23.5 pptv (Davis et al., 2004); over the equiv-alent time period in 2003, the median HNO3 was 84 pptv, and for HO2NO2was 39 pptv (Eisele et al., 2008). Consid-erably greater mixing ratios have also been observed; for ex-ample, the median mixing ratio of HNO3between 15 and 30 November 2003 was 194 pptv, and of HO2NO2was 63 pptv (Eisele et al., 2008). While the specific mixing ratios will be strongly influenced by boundary layer height, overall, these high mixing ratios are fuelled by in situ production from ele-vated levels of NOxand HOxwithin the South Pole boundary layer, in turn driven by photochemical release of trace gases from the surrounding snowpack (Davis et al., 2001, 2008).
The airborne measurements assessed the three-dimensional distribution of HO2NO2 and HNO3 across
the Antarctic Plateau during the ANTCI 2005 campaign (Slusher et al., 2010). They revealed significant vertical gradients in both species, with higher concentrations at the ground, consistent with a source associated with emissions from the snowpack. The measurements also showed a widespread distribution of both HNO3and HO2NO2across the Plateau region.
To date there have been no measurements of high tem-poral resolution HO2NO2and HNO3 in coastal Antarctica, and no measurements at all from Antarctica outside the sum-mer season. We report here observations of HO2NO2 and HNO3 made using a chemical ionisation mass spectrome-ter (CIMS) at Halley research station in coastal Antarctica (75◦35′S, 26◦39′W) from 24 May to 18 September 2007. The data allow us to assess whether HNO3and HO2NO2are present in significant concentrations at other Antarctic loca-tions and seasons than the Antarctic Plateau in summer. They also provide an opportunity to test laboratory-derived phys-ical exchange parameters under semi-constrained, but gen-uine real-world conditions. At Halley, the sun remains be-low the horizon from 30 April to 13 August, such that this new data set includes many weeks of winter darkness. Under these conditions of 24 h per day darkness, atmospheric pho-tochemistry stalls, and trace gas concentrations are controlled entirely by either transport or physical air–snow exchange.
2 Experimental
2.1 CIMS instrumentation
The CIMS instrument used in this study has been described in detail elsewhere (Buys et al., 2013). It was installed in the Clean Air Sector Laboratory (CASLab), which is located roughly 1 km from the main Halley station, and in a sector that rarely receives air from the base (Jones et al., 2008). The CIMS inlet extended∼20 cm above the roof of CASLab, at a height roughly 5 m above the surrounding snowpack. The inlet system was designed to minimise residence time and surface losses (Neuman et al., 1999).
While the SF−6 method has been used successfully in pre-vious field campaigns (e.g. Slusher et al., 2002, 2010), it has been demonstrated in laboratory studies (Slusher et al., 2001) that SF−6 reacts with H2O in the sample air flow. This in-troduces an interferent into the technique, the non-linearity of which is evident in the unfiltered data (not shown). How-ever, with their instrument reaction time of∼25 ms, Slusher et al. (2001) also concluded that this interferent was signifi-cant only at dew points greater than−25◦C, and that at lower dew points, the interferent was negligible. During the period of measurements at Halley, the CIMS instrument also oper-ated with a reaction time of∼25 ms, such that the interfer-ent would be equivalinterfer-ent to that of Slusher et al. (2001). At Halley, dewpoint temperatures varied from −12 to−52◦C (mean−31◦C), but were below−25◦C for 81 % of the time.
To remove the potential for H2O interference in our data, all measurements made at dew points above−25◦C are filtered
out from the data set.
2.2 Boundary layer meteorology
Measurements of near-surface boundary layer meteorology were made on a 32 m profiling mast located ∼25 m from the CASLab. Bulk sensors were located at 1, 2, 4, 8, 16, and 32 m above ground level, recording at 1 Hz and averaged to 10 min means; temperatures and humidity were measured with platinum resistance thermometers (0.1 K resolution) and solid state humidity probes (2 % resolution), respectively, us-ing an aspirated HMP35D from Vaisala Corp. 10 min vec-tor average wind speed and direction were measured with R. M. Young propeller vanes at 0.1 ms−1and 2◦resolution.
Three three-axis Metek USA-1 ultrasonic anemome-ter/thermometers were deployed at the 4, 16, and 32 m levels, sampling at 20 Hz. The data were tilt corrected and the rele-vant co-variances calculated over 1 min means.
3 Results and discussion
3.1 Overall data series
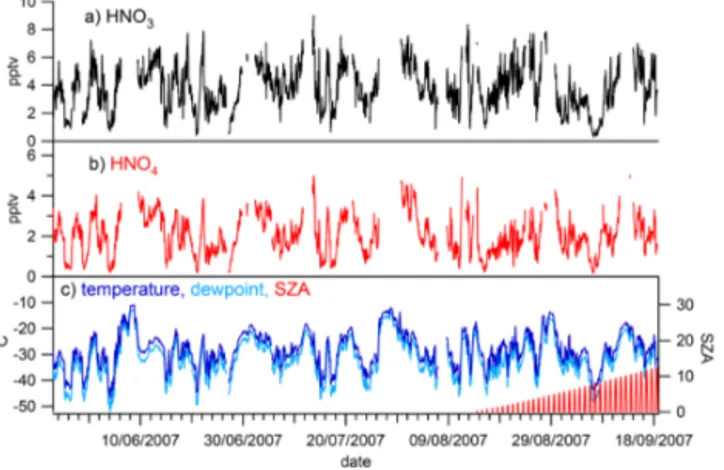
The time series of filtered HO2NO2 and HNO3 data, av-eraged to hourly means, is shown in Fig. 1, together with hourly means of ambient temperature, dew point tempera-ture, and solar zenith angle. The solar zenith angle shows that the sun was below the horizon for the majority of this time period, and observations of NO and NO2(made using a Sonoma Tech. Dual channel chemiluminescence analyser (Bauguitte et al., 2012; Cotter et al., 2003), with detection limits of 2 pptv for NO and 6 pptv for NO2, not shown) were consistently below the instrumental detection limits.
Regardless of this apparent lack of photochemical activity, there is considerable variability in the HNO3and HO2NO2 observations. Mixing ratios of HNO3 ranged from instru-mental detection limits to ∼8 parts per trillion by vol-ume (pptv) and of HO2NO2varied from detection limits to
Figure 1.Time series of(a)HNO3,(b)HO2NO2, and(c)ambient temperature, dewpoint, and solar zenith angle (SZA) (hourly aver-ages) for the entire measurement period discussed in this paper, 24 May to 18 September 2007.
Figure 2.Nitric acid (HNO3) vs. peroxynitric acid (HO2NO2); hourly averages of measurements made from 24 May to 18 Septem-ber 2007.
∼5 pptv. These values are considerably lower than those ob-served at the South Pole in summer, where photochemical production is fuelled by emissions of NOx from the snow-pack, and where mixing ratios of HNO3and HO2NO2were generally in the 10 s of pptv, and sometimes over 100 pptv, as discussed earlier.
Figure 3. (a) Nitric acid (HNO3) and (b) peroxynitric acid (HO2NO2) vs. ambient temperature; 10 min averages of measure-ments made from 24 May to 18 September 2007.
The time series presented in Fig. 1 also clearly shows the very strong association between mixing ratios of HNO3 and HO2NO2and ambient (and dewpoint) temperature. This association is further demonstrated in Fig. 3, which shows both HNO3 and HO2NO2 plotted against ambient temper-ature, again for the entire period of measurements. Calcu-lated correlation coefficients with temperature are high, with
R2=0.70 and 0.72 for HNO3and HO2NO2respectively. Given that mixing ratios of HNO3 and HO2NO2 are so strongly associated with ambient temperature, Table 1 gives the mean and standard deviation of HNO3 and HO2NO2 measured between 24 May and 18 September 2007, calcu-lated within specific temperature ranges. The statistics are derived using only the filtered data that were above 3σ de-tection limits. At the South Pole during the summer, ambient temperature ranged from−31.5 to−23.6◦C, with a mean of
−27.7◦C; within this temperature range, HNO3mixing ra-tios ranged from < 5 to 54 pptv (mean 25 pptv) and HO2NO2 ranged from < 5 to 68 pptv (mean 22 pptv). For the equivalent temperature range at Halley (also with a mean of−27.7◦C), mean and maximum mixing ratios for HNO3were 4.4 and 9 pptv respectively, and for HO2NO2were 2.5 and 5 pptv re-spectively, clearly significantly below those observed at the South Pole, for the reasons outlined above.
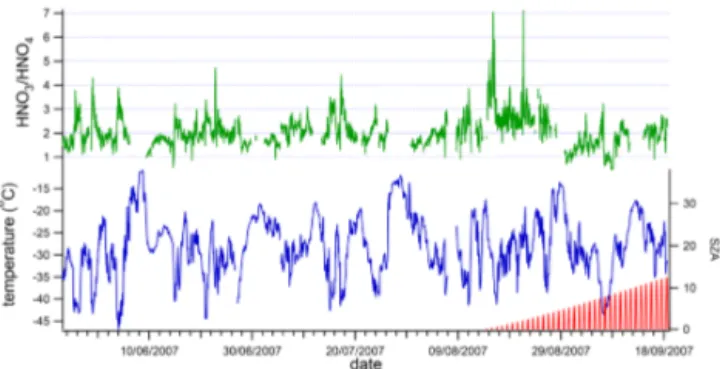
Differences between South Pole summer and Halley win-ter are also evident in the ratio of HNO3: HO2NO2, aris-ing through differences in the species’ lifetimes. Through-out the Halley measurement period, the average ratio of HNO3: HO2NO2 was 2.0(±0.6) : 1, with HNO3 always (apart from a few outliers) present at greater mixing ratios than HO2NO2during the winter darkness (see Fig. 4). This finding is in contrast to observations from the South Pole dur-ing sunlit summer time, when mixdur-ing ratios of HNO3 and HO2NO2were roughly equal for much of the measurement period (Slusher et al., 2002). Figure 1 of Slusher et al. (2002) shows that HO2NO2was present at higher mixing ratios than HNO3for roughly 2 out of the 7 days of measurements; dur-ing the roughly 4 months of measurements at Halley, the only
Figure 4.Ratio of HNO3:HO2NO2(hourly average data) for the May to September measurement period. Also shown, for reference, are ambient temperature and solar zenith angle.
occasion when the mixing ratio of HO2NO2exceeded that of HNO3was on the 6 and 7 September, a period when temper-atures were particularly low but there was a limited amount of sunlight.
3.2 Short-term variability in HNO3and HO2NO2and link to ambient temperature
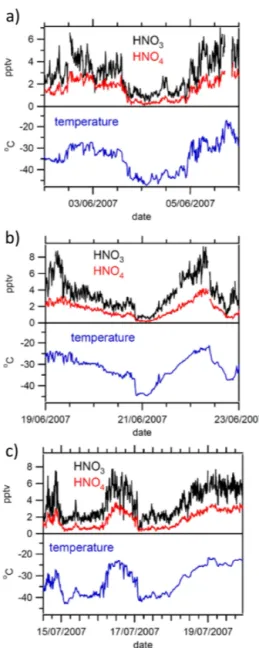
The short-term variability in the HNO3 and HO2NO2 is shown more clearly in Fig. 5. The three examples show periods when ambient air temperatures varied rapidly and considerably, but where they remained below the −25◦C dewpoint threshold such that no chemical data filtering was required. These 10 min averages show that even very small-scale features of temperature change are reflected in the chemical measurements. For example, at midnight on 5 June, the short-lived peak in temperature is reflected also in HNO3and HO2NO2; the temperature peak around 11 a.m. on 21 June is apparent with similar, small, peaks in HNO3and HO2NO2; and the short-lived temperature peak around noon on 15 July is also evident in short-lived increases in HNO3 and HO2NO2 mixing ratios. While large-scale variability in HNO3 and HO2NO2 could be linked to air mass origin, such fine-scale variability can only be explained by a lo-cal, fast-acting, source/sink mechanism. The association be-tween variability in HNO3and HO2NO2and changes in am-bient temperature strongly suggest a temperature-dependent mechanism. Given our understanding of the interaction be-tween acidic gases and ice gained through laboratory stud-ies (e.g. Huthwelker et al., 2006), one possible mechanism is temperature-dependent adsorption/desorption at the snow surface.
3.3 Evidence for HO2NO2and HNO3air/snow exchange
ap-Table 1.Mean and standard deviation of nitric acid and peroxynitric acid according to ambient air temperature range. The statistics were derived using only data above the 3σdetection limit.
Nitric acid Peroxynitric acid
Ambient air temperature (◦C) no. points mean (pptv) SD (pptv) no. points mean (pptv) SD (pptv)
−45 to−47.4 24 0.96 0.12 0
−40 to−45.9 579 1.36 0.42 472 0.58 0.14
−35 to−39.9 1575 2.13 0.74 1615 0.99 0.38
−30 to−34.9 3638 3.09 0.92 3732 1.6 0.44
−25 to−29.9 4821 4.32 1.18 4942 2.29 0.62
−21.2 to−24.9 1954 5.67 1.19 2013 3.23 0.62
proach, we minimise any influence that air flow through the snow (e.g. via ventilation/wind pumping) may have on air/snow exchange processes. We derive a mixing diffusiv-ity to determine the timescale for vertical mixing (via tur-bulent diffusion) between the snow surface and the CIMS inlet height, in order to confirm that the CIMS HNO3 and HO2NO2observations can be used to analyse processes oc-curring at the ground-level air/snow interface. The mixing diffusivity is roughly equal to k.z.u∗, where k is von
Kar-man’s constant (0.4), zis CIMS inlet height (5 m) and u∗
is the friction velocity, derived from the sonic anemometer data (Stull, 1988). Thee-folding time scale,tsc, is given by
z2/diffusivity, that istsc=z/(k u∗). During each case study
tscwill vary, but cannot be negative: this range is presented below derived from log means and standard deviations. Fig-ure 6a shows observations made on 30 May 2007, with a clear gradual increase in both HNO3 and HO2NO2 as am-bient temperatures rose from ∼ −44 to∼ −30◦C. On this day, data from the boundary layer mast (not shown) show that between the surface and 8 m height, there was little or no temperature gradient; to first order, therefore, 8 m tem-peratures can be used as a surrogate for those at the ground. Wind speeds were between 0 and 2 m s−1from the surface to 4 m, and remained at around 2 ms−1at 8 m height. For 95 % of the time,tscwas between 100 and 300 s.
Figure 6b shows data for the period from 9 a.m. to mid-night on 21 June, discussed briefly in Sect. 3.2 above. Again, a gradual increase in mixing ratios of HNO3and HO2NO2is evident (upper panel), as ambient temperatures rose gradu-ally from∼ −38 to∼ −26◦C. Data from the boundary layer met mast show that, during this period, there was no vertical gradient in temperature between the surface and 8 m height; wind speeds from the surface to 8 m were below 2 ms−1. Data from the sonic anemometers show that vertical mixing was again very weak, with mixing time scales between 90 and 600 s.
Figure 6c shows observations from midnight to 9 a.m. on 18 July, another quiescent period, with wind speeds in the lowest 8 m below 1 ms−1, and with no temperature gradient below 32 m. Gradual increases in both HNO3and HO2NO2
Figure 6.Detail of changes in HNO3, HO2NO2and temperature on (a)30 May,(b)21 June, and(c)18 July. These three periods in the measurement series were characterised by low and invariant wind speeds and 24 h per day darkness.
proceed as ambient temperatures rise from−38 to−30◦C.
tscvaried between 30 and 100 s during the event.
Correlation coefficients between mixing ratios of HNO3 (and HO2NO2) and temperature, are extremely high for the time periods presented in Fig. 6: R2 for the correla-tion between HNO3and temperature is 0.72 (30 May), 0.90 (21 June) and 0.72 (18 July); for the correlation between HO2NO2 and temperature, R2 was 0.88 (30 May), 0.94 (21 June), and 0.92 (18 July). The values of R2 show that between 72 and 90 % of the variability in HNO3can be ex-plained by variability in temperature; and between 88 and 94 % of the variability in HO2NO2can be explained by the variability in temperature.
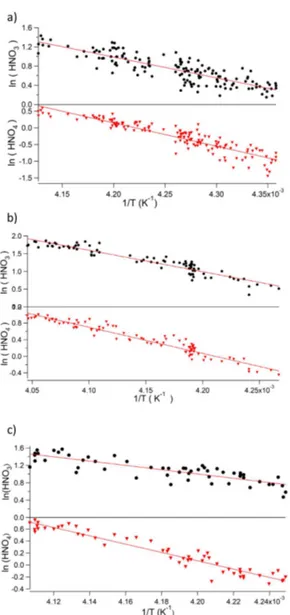
Figure 7.Plots of ln(HNO3) and ln(HO2NO2) vs. 1/T for the time periods shown in Fig. 6, i.e.(a)30 May,(b)21 June, and(c)18 July.
3.4 Deriving enthalpy of adsorption from the Halley field data
The enthalpies of adsorption between HNO3/ice and HO2NO2/ice have been derived in laboratory experiments carried out under environmentally relevant conditions. Ulrich et al. (2012) studied uptake of HO2NO2 at low concentra-tions and temperatures between 230 and 253 K while Bartels-Rausch et al. (2002) and Ullerstam et al. (2005) studied the adsorption enthalpy of HNO3. Field studies carried out dur-ing the 24 h per day darkness of Antarctic winter provide optimum conditions for validating such laboratory-derived physical air/snow exchange parameters under “real-world” conditions.
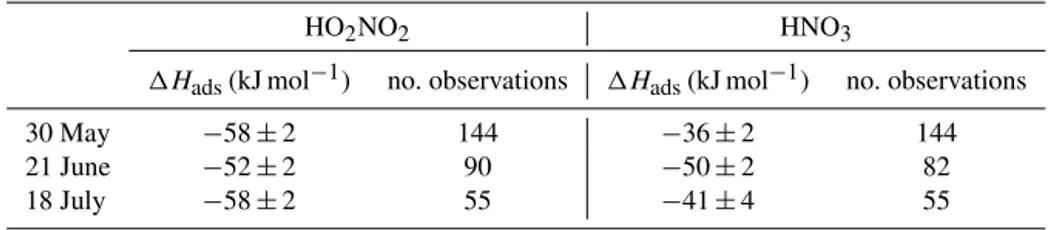
sur-Table 2.The enthalpies of adsorption to ice for HO2NO2and HNO3as derived from three periods of the Halley measurements. The number of observations used for each derivation is also given.
HO2NO2 HNO3
1Hads(kJ mol−1) no. observations 1Hads(kJ mol−1) no. observations
30 May −58±2 144 −36±2 144
21 June −52±2 90 −50±2 82
18 July −58±2 55 −41±4 55
face (Cs) can be expressed as
Kpart=
Cs
Cg
.
As the partition constant will obey the van’t Hoff equation, a new equation can be written as follows:
dlnKpart
dT1
= −1Hads
R ,
where T is the temperature (K), 1H is the en-thalpy of adsorption (J mol−1), R is the gas constant (8.314 J K−1mol−1).
Given our definition ofKpartabove, the equation can then be re-formulated as
dlnCs
Cg
dT1
= −1Hads
R .
At 240 K, roughly the temperatures of our observations, Ul-rich et al. (2012), in their Fig. 4, show Cs/ Cg≈20 cm for HO2NO2and 8000 cm for HNO3. In the firn, the ratio of the surface area of snow to the volume of air is approximately 50 to 500 cm−1(based on a density of snow of 0.3 g cm−3and a specific surface area of 100 to 1000 cm2g−1; Domine et al., 2008). We can therefore calculate that the ratio of the num-ber of molecules of HNO3adsorbed to the snow surface to that in the gas phase, is approximately 4×10⁵to 4×10⁶; for HO2NO2, this ratio is 1000 to 10 000. As a result, for both HNO3 and HO2NO2, exchange between the air and snow will thus have little effect onCs, which can therefore be con-sidered as a constant relative toCg.
If we also assume that, over several hours, and under low and constant wind conditions, the concentration at our inlet tracks the concentration in the firn, then
dlnCg
dT1
=1Hads
R .
It is then possible to derive1Hadsfrom the slope of lnCgvs. 1/T multiplied byR.
For the Halley data, Fig. 7 shows plots of both ln(HNO3) vs. 1/T and ln(HO2NO2) vs. 1/T for the time periods dis-cussed in Sect. 3.3 above. As a reminder, these periods are
characterised by 24 h per day darkness, low wind speeds, and limited vertical mixing from turbulent diffusion, so are as close to laboratory conditions as could be found in our data set. They were also chosen as they spanned a reasonably large temperature range, which would improve the constraint on the linear fit.
The values of 1Hads derived from these fits are given in Table 2. The average 1Hads for HNO3 is −42±2 kJ mol−1which can be compared with laboratory-derived values of Bartels-Rausch et al. (2002) and Uller-stam et al. (2005). Bartels-Rausch et al. (2002) derived
1Hads of −44 kJ mol−1 (with random error 2.3 kJ mol−1, systematic error 13 kJ mol−1); Ullerstam et al. (2005), work-ing at lower concentrations of HNO3, relevant to the nat-ural atmosphere, derived 1Hads of −30.6±6.0 kJ mol−1. For HO2NO2, the average 1Hads derived from our field data is −56±1 kJ mol−1 which can be compared with the laboratory-derived value (Ulrich et al., 2012) of −59 kJ mol−1. For both HO2NO2and HNO3, the agreement between laboratory and field-derived enthalpies of adsorp-tion is remarkably good.
4 Summary and conclusions
We present the first high time resolution observations of HNO3and HO2NO2in coastal Antarctica, and the first from Antarctica during the dark winter period. Mixing ratios of HNO3ranged from instrumental detection limits to∼8 parts per trillion by volume (pptv) and of HO2NO2varied from de-tection limits to∼5 pptv. These values are on average lower than those observed at the South Pole in summer, where mix-ing ratios of HNO3and HO2NO2were generally in the 10s of pptv, and sometimes over 100 pptv.
The Antarctic, during winter, is an ideal natural laboratory for studying physical air/snow exchange processes. The envi-ronmental system is considerably simplified compared with other times of the year because of the lack of photochemical activity which must otherwise be taken into account when interpreting data.
NaCl aerosols. In a follow-up study that further analysed our field data, Bartels-Rausch (2014) considered both the case of Langmuir adsorption to the ice surface, and solubility in ice forming a solid solution. He found that equilibrium air/snow partitioning was able to describe our field data well, both in terms of absolute mixing ratios and trend with temper-ature. He also found that the reservoir of adsorbed HNO3 and HO2NO2 in the upper snow pack was sufficient to fuel the observed emissions. In contrast, while calculations based on reversible solid-solution/air partitioning were able to de-scribe mixing ratios of HNO3, they were not able to repro-duce the observed trend with temperature. Further, the reser-voir of HNO3in the outer part of the snow crystals was too small to explain observed increases in mixing ratio.
The measurements of HNO3 and HO2NO2 from Hal-ley are consistent with laboratory experiments showing a temperature-dependence in the partitioning of both HNO3 and HO2NO2to ice. They further support the conclusion that HO2NO2/ice interactions are stronger than those between HNO3and ice, as shown by the higher enthalpy of adsorp-tion of HO2NO2compared with HNO3(Ulrich et al., 2012). On short timescales, therefore, HNO3 and HO2NO2 that is adsorbed to snow/ice can be re-released as temperatures rise. The snowpack can thus act as a source of HNO3 and HO2NO2to the overlying atmosphere at all times of the year given sufficient reservoir in the snowpack and changing tem-peratures. Similarly, HNO3and HO2NO2adsorbed to cirrus clouds would be desorbed should temperatures rise. Such a reversible, temperature-dependent partitioning also pro-vides a mechanism for re-distributing HNO3and HO2NO2 on a local or regional scale across Antarctica. Snow can be transported considerable distances by storm systems, and adsorbed HO2NO2 and HNO3 can be desorbed as a func-tion of changing temperature experienced along the trans-port pathway. Indeed, transtrans-port of snow from inland Antarc-tica is likely to contribute to the HO2NO2and HNO3 reser-voir in the coastal snowpack. The other likely source for HO2NO2to the winter snowpack is the general shift in equi-libria, as temperatures fall from summer to winter, from gas-phase HO2 and NO2 towards gaseous HO2NO2, and then, by temperature-dependent partitioning, towards snowpack-adsorbed HO2NO2.
While clearly a controlling mechanism during polar night, the importance of air/snow partitioning relative to photo-chemistry will vary according to time of year and loca-tion. However, adsorption to/desorption from the snow pack should be taken into account when addressing budgets of boundary layer HO2NO2 and HNO3 at any snow-covered site, as all are likely to experience varying ambient tempera-ture which would drive such air/snow exchange.
Acknowledgements. The authors thank Greg Huey and Dave
Tanner for providing the CIMS instrument used in this work, and for their help in setting it up at Halley. A. E. Jones thanks Robert Mulvaney for useful discussions around this work. The authors are also grateful for Thorsten Bartels-Rausch for discussions and his subsequent modelling calculations. This study is part of the British Antarctic Survey Polar Science for Planet Earth Programme. It was funded by The Natural Environment Research Council (NERC).
Edited by: J. Roberts
References
Bartels-Rausch, T., Eichler, B., Zimmermann, P., Gäggeler, H. W., and Ammann, M.: The adsorption of nitrogen oxides on crys-talline ice, Atmos. Chem. Phys., 2, 235–247, doi:10.5194/acp-2-235-2002, 2002.
Bartels-Rausch, T.: Ice-air partitioning of HNO3 and HNO4 drives winter mixing ratio, Atmos. Chem. Phys. Discuss., 14, C4673–C4694, 014.
Bauguitte, S. J.-B., Bloss, W. J., Evans, M. J., Salmon, R. A., An-derson, P. S., Jones, A. E., Lee, J. D., Saiz-Lopez, A., Roscoe, H. K., Wolff, E. W., and Plane, J. M. C.: Summertime NOx mea-surements during the CHABLIS campaign: can source and sink estimates unravel observed diurnal cycles?, Atmos. Chem. Phys., 12, 989–1002, doi:10.5194/acp-12-989-2012, 2012.
Buys, Z., Brough, N., Huey, L. G., Tanner, D. J., von Glasow, R., and Jones, A. E.: High temporal resolution Br2, BrCl and BrO observations in coastal Antarctica, Atmos. Chem. Phys., 13, 1329–1343, doi:10.5194/acp-13-1329-2013, 2013.
Chen, G., Davis, D., Crawford, J., Nowak, J. B., Eisele, F., Mauldin, R. L., Tanner, D., Buhr, M., Shetter, R., Lefer, B., Arimoto, R., Hogan, A., and Blake, D.: An investigation of South Pole HOx chemistry: Comparison of model results with ISCAT observa-tions, Geophys. Res. Lett., 28, 3633–3636, 2001.
Cotter, E. S. N., Jones, A. E., Wolff, E. W., and Bauguitte, S. J.-B.: What controls photochemical NO and NO2production from Antarctic snow? Laboratory investigation assessing the wave-length and temperature dependence, J. Geophys. Res., 108, 4147, doi:10.1029/2002JD002602, 2003.
Davis, D., Nowak, J. B., Chen, G., Buhr, M., Arimoto, R., Hogan, A., Eisele, F., Mauldin, L., Tanner, D., Shetter, R., Lefer, B., and McMurry, P.: Unexpected high levels of NO observed at South Pole, Geophys. Res. Lett., 28, 3625–3628, 2001.
Davis, D., Chen, G., Buhr, M., Crawford, J., Lenschow, D., Lefer, B., Shetter, R., Eisele, F., Mauldin, L., and Hogan, A.: South Pole NOxchemistry: an assessment of factors controlling variability and absolute levels, Atmos. Environ., 38, 5375–5388, 2004. Davis, D. D., Seelig, J., Huey, G., Crawford, J., Chen, G.,
Wang, Y., Buhr, M., Helmig, D., Neff, W., Blake, D., Arimoto, R., and Eisele, F.: A reassessment of Antarctic plateau reactive nitrogen based on ANTCI 2003 airborne and ground based measurements, Atmos. Environ., 42, 2831–2848, doi:10.1016/j.atmosenv.2007.07.039, 2008.
Eisele, F., Davis, D., Helmig, D., Oltmans, S., Neff, W., Huey G., Tanner, D., Chen, G., Crawford, J., Arimoto, R., Buhr, M., Mauldin, L., Hutterli, M., Dibb, J., Blake, D., Brooks, S.B., Johnson, B., Roberts, J., Wang, Y., Tan, D., and Flocke, F.: Antarctic tropospheric chemistry investigation (ANTCI) 2003 overview, Atmos. Environ., 42, 2749–2761, doi:10.1016/j.atmosenv.2007.04.013, 2008.
Hudson, P. K., Shilling, J. E., Tolbert, M. A., and Toon, O. B.: Up-take of nitric acid on ice at tropospheric temperatures: Implica-tions for cirrus clouds, J. Phys. Chem. A, 106, 9874–9882, 2002. Huey, L. G., Tanner, D. J., Slusher, D. L., Dibb, J. E., Arimoto, R., Chen, G., Davis, D., Buhr, M. P., Nowak, J. B., Mauldin, R. L., Eisele, F. L., and Kosciuch, E.: CIMS measurements of HNO3 and SO2at the South Pole during ISCAT 2000, Atmos. Environ., 38, 5411–5421, 2004.
Huthwelker, T., Ammann, M., and Peter, T.: The uptake of acidic gases on ice, Chem. Rev., 106, 1375–1444, 2006.
Jones, A. E., Wolff, E. W., Salmon, R. A., Bauguitte, S. J.-B., Roscoe, H. K., Anderson, P. S., Ames, D., Clemitshaw, K. C., Fleming, Z. L., Bloss, W. J., Heard, D. E., Lee, J. D., Read, K. A., Hamer, P., Shallcross, D. E., Jackson, A. V., Walker, S. L., Lewis, A. C., Mills, G. P., Plane, J. M. C., Saiz-Lopez, A., Sturges, W. T., and Worton, D. R.: Chemistry of the Antarctic Boundary Layer and the Interface with Snow: an overview of the CHABLIS campaign, Atmos. Chem. Phys., 8, 3789–3803, doi:10.5194/acp-8-3789-2008, 2008.
Kim, S., Huey, L. G., Stickel, R. E., Tanner, D. J., Crawford, J. H., Olson, J. R., Chen, G., Brune, W. H., Ren, X., Lesher, R., Wooldridge, P. J., Bertram, T. H., Perring, A., Cohen, R. C., Lefer, B. L., Shetter, R. E., Avery, M., Diskin, G., and Sokolik, I.: Measurement of HO2NO2 in the free troposphere during the intercontinental chemical transport experiment – North America 2004, J. Geophys. Res.-Atmos., 112, D12S01, doi:10.1029/2006JD007676, 2007.
Neuman, J. A., Huey, L. G., Ryerson, T. B., and Fahey, D. W.: Study of inlet materials for sampling atmospheric nitric acid, Environ. Sci. Technol., 33, 1133–1136, doi:10.1021/es980767f, 1999. Popp, P. J., Gao, R. S., Marcy, T. P., Fahey, D. W., Hudson, P. K.,
Thompson, T. L., Karcher, B., Ridley, B. A., Weinheimer, A. J., Knapp, D. J., Montzka, D. D., Baumgardner, D., Garrett, T. J., Weinstock, E. M., Smith, J. B., Sayres, D. S., Pittman, J. V., Dhaniyala, S., Bui, T. P., and Mahoney, M. J.: Nitric acid up-take on subtropical cirrus cloud particles, J. Geophys. Res., 109, D06302, doi:10.1029/2003JD004255, 2004.
Slusher, D. L., Pitteri, S. J., Haman, B. J., Tanner, D. J., and Huey, L. G.: A chemical ionization technique for measurement of pernitric acid in the upper troposphere and the polar boundary layer, Geo-phys. Res. Lett., 28, 3875–3878, doi:10.1029/2001GL013443, 2001.
Slusher, D. L., Huey, L. G., Tanner, D. J., Chen, G., Davis, D. D., Buhr, M., Nowak, J. B., Eisele, F. L., Kosciuch, E., Mauldin, R.L., Lefer, B. L., Shetter, R. E., and Dibb, J. E.: Measurements of pernitric acid at the South Pole during ISCAT 2000, Geophys. Res. Lett., 29, 2011, doi:10.1029/2002GL015703, 2002. Slusher, D. L., Neff, W. D., Kim, S., Huey, L. G., Wang, Y.,
Zeng, T., Tanner, D. J., Blake, D. R., Beyersdorf, A., Lefer, B. L., Crawford, J. H., Eisele, F. L., Mauldin, R. L., Kosci-uch, E., Buhr, M. P., Wallace, H. W., and Davis, D. D.: At-mospheric chemistry results from the ANTCI 2005 Antarctic plateau airborne study, J. Geophys. Res.-Atmos., 115, D07304, doi:10.1029/2009JD012605, 2010.
Stull, R. B.: An Introduction to Boundary Layer Meteorology, Kluwer Academic Publishers, Dordrecht, 670 pp., 1988. Ullerstam, M., Thornberry, T., and Jonathan, P. D., and Abbatt, J.
P. D.: Uptake of gas-phase nitric acid to ice at low partial pres-sures: evidence for unsaturated surface coverage, Faraday Dis-cuss., 130, 211–226, doi:10.1039/B417418F, 2005.
Ulrich, T., Ammann, M., Leutwyler, S., and Bartels-Rausch, T.: The adsorption of peroxynitric acid on ice between 230 K and 253 K, Atmos. Chem. Phys., 12, 1833–1845, doi:10.5194/acp-12-1833-2012, 2012.
Weinheimer, A. J., Campos, T. L., Walega, J. G., Grahek, F. E., Ri-dley, B. A., Baumgardner, D., Twohy, C., and Gandrud, B.: Up-take of NOy on wave-cloud ice particles, Geophys. Res. Lett., 25, 1725–1728, 1998.