BGD
12, 19579–19626, 2015
Results from the VAHINE mesocosm
experiment
S. Bonnet et al.
Title Page
Abstract Introduction
Conclusions References
Tables Figures
◭ ◮
◭ ◮
Back Close
Full Screen / Esc
Printer-friendly Version Interactive Discussion
Discussion
P
a
per
|
Discussion
P
a
per
|
Discussion
P
a
per
|
Discussion
P
a
per
|
Biogeosciences Discuss., 12, 19579–19626, 2015 www.biogeosciences-discuss.net/12/19579/2015/ doi:10.5194/bgd-12-19579-2015
© Author(s) 2015. CC Attribution 3.0 License.
This discussion paper is/has been under review for the journal Biogeosciences (BG). Please refer to the corresponding final paper in BG if available.
Dynamics of N
2
fixation and fate of
diazotroph-derived nitrogen in a low
nutrient low chlorophyll ecosystem:
results from the VAHINE mesocosm
experiment (New Caledonia)
S. Bonnet1,2, H. Berthelot1, K. Turk-Kubo3, S. Fawcett4,5, E. Rahav6,7,
S. l’Helguen8, and I. Berman-Frank6
1
Aix Marseille Université, CNRS/INSU, Université de Toulon, IRD, Mediterranean Institute of Oceanography (MIO) UM 110, 13288, Marseille-Noumea, France, New Caledonia
2
Institut de Recherche pour le Développement, AMU/CNRS/INSU, Université de Toulon, Mediterranean Institute of Oceanography (MIO) UM110, 98848, Noumea, New Caledonia 3
Ocean Sciences Department, University of California, Santa Cruz, USA 4
Department of Geosciences, M45 Guyot Hall, Princeton University, Princeton, New Jersey 08544, USA
5
Department of Oceanography, University of Cape Town, Rondebosch, 7701, South Africa 6
BGD
12, 19579–19626, 2015
Results from the VAHINE mesocosm
experiment
S. Bonnet et al.
Title Page
Abstract Introduction
Conclusions References
Tables Figures
◭ ◮
◭ ◮
Back Close
Full Screen / Esc
Printer-friendly Version Interactive Discussion
Discussion
P
a
per
|
Discussion
P
a
per
|
Discussion
P
a
per
|
Discussion
P
a
per
|
7
National Institute of Oceanography, Israel Oceanographic and Limnological Research, Haifa, Israel
8
Université de Brest, CNRS/IRD, UMR6539, Laboratoire des Sciences de l’Environnement Marin, OSU-IUEM, 29280 Plouzané, France
Received: 10 November 2015 – Accepted: 13 November 2015 – Published: 10 December 2015
Correspondence to: S. Bonnet ([email protected])
BGD
12, 19579–19626, 2015
Results from the VAHINE mesocosm
experiment
S. Bonnet et al.
Title Page
Abstract Introduction
Conclusions References
Tables Figures
◭ ◮
◭ ◮
Back Close
Full Screen / Esc
Printer-friendly Version Interactive Discussion
Discussion
P
a
per
|
Discussion
P
a
per
|
Discussion
P
a
per
|
Discussion
P
a
per
|
Abstract
N2 fixation rates were measured daily in large (∼50 m
3
) mesocosms deployed in the tropical South West Pacific coastal ocean (New Caledonia) to investigate the spatial and temporal dynamics of diazotrophy and the fate of diazotroph-derived nitrogen (DDN) in a low nutrient, low chlorophyll ecosystem. The mesocosms were
intention-5
ally fertilized with∼0.8 µM dissolved inorganic phosphorus (DIP) to stimulate
diazotro-phy. Bulk N2 fixation rates were replicable between the three mesocosms, averaged
18.5±1.1 nmol N L−1d−1over the 23 days, and increased by a factor of two during the
second half of the experiment (days 15 to 23) to reach 27.3±1.0 nmol N L−1d−1. These
rates are higher than the upper range reported for the global ocean, indicating that the
10
waters surrounding New Caledonia are particularly favourable for N2 fixation. During
the 23 days of the experiment, N2fixation rates were positively correlated with
seawa-ter temperature, primary production, bacseawa-terial production, standing stocks of particulate organic carbon, nitrogen and phosphorus, and alkaline phosphatase activity, and neg-atively correlated with DIP concentrations, DIP turnover time, nitrate, and dissolved
15
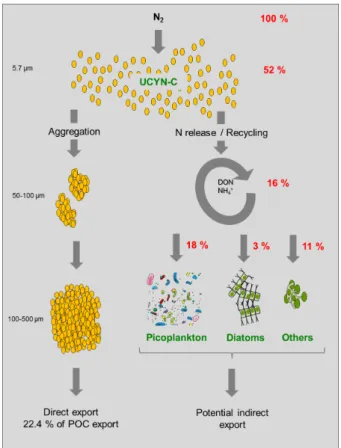
organic nitrogen and phosphorus concentrations. The fate of DDN was investigated during the bloom of the unicellular diazotroph, UCYN-C, that occurred during the sec-ond half of the experiment. Quantification of diazotrophs in the sediment traps indicates
that∼10 % of UCYN-C from the water column were exported daily to the traps,
repre-senting as much as 22.4±5.5 % of the total POC exported at the height of the UCYN-C
20
bloom. This export was mainly due to the aggregation of small (5.7±0.8 µm) UCYN-C
cells into large (100–500 µm) aggregates. During the same time period, a DDN transfer experiment based on high-resolution nanometer scale secondary ion mass
spectrom-etry (nanoSIMS) coupled with15N2isotopic labelling revealed that 16±6 % of the DDN
was released to the dissolved pool and 21±4 % was transferred to non-diazotrophic
25
plankton, mainly picoplankton (18±4 %) followed by diatoms (3±2 %) within 24 h of
BGD
12, 19579–19626, 2015
Results from the VAHINE mesocosm
experiment
S. Bonnet et al.
Title Page
Abstract Introduction
Conclusions References
Tables Figures
◭ ◮
◭ ◮
Back Close
Full Screen / Esc
Printer-friendly Version Interactive Discussion
Discussion
P
a
per
|
Discussion
P
a
per
|
Discussion
P
a
per
|
Discussion
P
a
per
|
particulate organic carbon, nitrogen and phosphorus during the second half of the
ex-periment in the mesocosms. These results offer insights into the fate of DDN during a
bloom of UCYN-C in low nutrient, low chlorophyll ecosystems.
1 Introduction
Next to light, nitrogen (N) is the major limiting factor for primary productivity in much of
5
the low-latitude surface ocean (Falkowski, 1997; Moore et al., 2013). Nitrate (NO−3) is the dominant form of fixed nitrogen (N) in seawater and derives from the remineraliza-tion of sinking organic N in the dark ocean. It is supplied to photic waters by upward mixing and transport, and constitutes the main source of fixed N for photosynthetic organisms in the temperate and high latitude ocean. In the oligotrophic tropical and
10
subtropical oceans, vertical mixing and transport of NO−3 is generally low and surface
waters are often depleted in NO−3.
In these ocean deserts, specialized organisms termed N2-fixers (or diazotrophs) are
able to use N in its simplest and most abundant form on Earth and in seawater, namely
dinitrogen (N2). These diazotrophs possess the nitrogenase enzyme, which cleaves the
15
strong triple bond of the N2molecule to form bioavailable ammonium (NH+4). N2fixation thus introduces a source of new bioavailable N to surface waters, and is considered to be the most important external source of N for the ocean, before atmospheric and riverine inputs (Gruber, 2004).
The dynamics of microbial communities such as diazotrophs can change abruptly in
20
the ocean in response to small perturbations or environmental stressors. In particular,
N2fixation has been described as a very “patchy” process in the ocean (Bombar et al.,
2015). Many factors control the distribution and activity of diazotrophs such as tem-perature (Raveh et al., 2015; Staal et al., 2003), nutrient (mainly phosphate and iron) availability (e.g., Mills et al., 2004),pCO2(e.g. Levitan et al., 2007), ambient
concen-25
trations of fixed N (NO−
3 and NH
+
BGD
12, 19579–19626, 2015
Results from the VAHINE mesocosm
experiment
S. Bonnet et al.
Title Page
Abstract Introduction
Conclusions References
Tables Figures
◭ ◮
◭ ◮
Back Close
Full Screen / Esc
Printer-friendly Version Interactive Discussion
Discussion
P
a
per
|
Discussion
P
a
per
|
Discussion
P
a
per
|
Discussion
P
a
per
|
N2fixation have been undertaken along large oceanic transects; these are particularly
valuable and have recently led to the compilation of a global ocean database of dia-zotrophy (Luo et al., 2012). Spatial variability in N2fixation is thus far better documented and understood than temporal variability, despite the intimate connections between time and space scales in the ocean. Time-series stations with near-monthly
observa-5
tions set up in the late 1980’s under the international JGOFS program in the subtropical North Atlantic, Pacific, and Mediterranean Sea have provided valuable data regarding the controls on N2fixation and its role in biogeochemical cycles on seasonal and inter-annual timescales (Dore et al., 2008; Garcia et al., 2006; Grabowski et al., 2008; Karl et al., 2012; Knapp et al., 2005; Orcutt et al., 2001), and have also revealed novel
10
diazotrophic microorganisms (Zehr et al., 2008) with unexpected metabolic strategies such as UCYN-A cyanobacteria that lack the oxygen-producing photosystem II com-plex (Tripp et al., 2010).
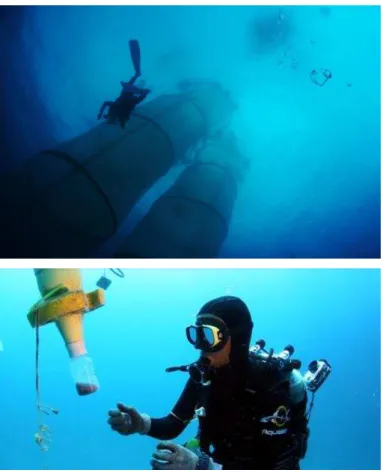
In the framework of the VAHINE project, we deployed three large volume mesocosms
(∼50 m3, Fig. 1) in the tropical South West Pacific coastal ocean, a region known to
15
support diazotrophy during the austral summer (Dupouy et al., 2000; Rodier and Le
Borgne, 2010, 2008) in order to study the temporal dynamics of N2fixation at high
fre-quency (every day for 23 days) in relation to hydrological parameters, biogeochemical stocks and fluxes, and the dynamics of phytoplanktonic and bacterial communities in the same water mass.
20
The mesocosm approach allowed us to investigate the fate of the recently fixed N2
and its transfer from diazotrophs to non-diazotrophic organisms in this oligotrophic ma-rine ecosystem. Diazotrophs can typically release from 10 to 50 % of their recently
fixed N2(or diazotroph derived N, hereafter called DDN) as dissolved organic N (DON)
and ammonium (NH+4) (Glibert and Bronk, 1994; Meador et al., 2007; Mulholland et al.,
25
BGD
12, 19579–19626, 2015
Results from the VAHINE mesocosm
experiment
S. Bonnet et al.
Title Page
Abstract Introduction
Conclusions References
Tables Figures
◭ ◮
◭ ◮
Back Close
Full Screen / Esc
Printer-friendly Version Interactive Discussion
Discussion
P
a
per
|
Discussion
P
a
per
|
Discussion
P
a
per
|
Discussion
P
a
per
|
Over the course of this 23 day mesocosm experiment, diatom-diazotroph
associa-tions (DDAs) were the most abundant N2 fixers during the first half of the experiment
(days 2 to 14), while a bloom of the unicellular N2-fixing cyanobacteria from Group C
(UCYN-C) occurred during the second half of the experiment (days 15 to 23)
(Turk-Kubo et al., 2015). The contribution of N2 fixation to primary production and export
5
was investigated during the two phases of the experiment in a companion paper by Berthelot et al. (2015b). Here, we focus on the short-term fate of DDN in the meso-cosms during the UCYN-C bloom by studying (i) the direct export of diazotrophs into the sediment traps, and (ii) the transfer of DDN to non-diazotrophic plankton using high-resolution nanometer scale secondary ion mass spectrometry (nanoSIMS)
cou-10
pled with15N2isotopic labelling during a 72 h-process experiment.
2 Methods
2.1 Mesocosm description and sampling strategy
Three replicate large-volume mesocosms (volume ∼50 m3, surface 4.15 m2, Fig. 1)
were deployed in the oligotrophic New Caledonian lagoon, 28 km off the coast of
15
Noumea (latitude: 22◦28,855 S; longitude: 166◦26,724 E) from 13 January to 6
Febru-ary 2013 (austral summer). They consisted of large bags made of two 500 µm-thick films of polyethylene (PE) and vinyl acetate (EVA, 19 %), with nylon meshing in between to allow for maximum resistance and light penetration (produced by HAIKONENE KY, Finland). The mesocosm bags were 2.3 m in diameter and 15 m in height, and were
20
equipped with removable sediment traps that enabled the collection of sinking material once a day (Fig. 1b). To alleviate any potential phosphorus limitation of diazotrophy in
the mesocosms, the bags were intentionally fertilized with∼0.8 µmol L−1 of dissolved
inorganic phosphorus (DIP) four days after the start of the experiment. A more detailed description of the mesocosms setup, the selection of the study site, and the deployment
25
BGD
12, 19579–19626, 2015
Results from the VAHINE mesocosm
experiment
S. Bonnet et al.
Title Page
Abstract Introduction
Conclusions References
Tables Figures
◭ ◮
◭ ◮
Back Close
Full Screen / Esc
Printer-friendly Version Interactive Discussion
Discussion
P
a
per
|
Discussion
P
a
per
|
Discussion
P
a
per
|
Discussion
P
a
per
|
Vertical CTD profiles were performed every morning in each of the three mesocosms (hereafter referred to as M1, M2, and M3) and in the surrounding waters (hereafter re-ferred to as lagoon waters) using a SBE Seabird CTD. All discrete samples for the pa-rameters described below were collected daily at 7 a.m. at three depths (1, 6 and 12 m) in each mesocosm and in the lagoon waters using braided PVC tubing
(Holzelock-5
Tricoflex, inner diameter=9.5 mm) connected to a Teflon PFA pump (St-Gobain
Per-formance Plastics) activated by pressurized air. Finally, sediment trap samples were collected daily from each mesocosm by SCUBA divers.
2.2 Sampling, N2fixation measurements, and method intercomparison
Seawater samples for N2fixation rate measurements were dispensed into HCl-washed
10
4.5 L polycarbonate bottles that were sealed with septa and amended with 15N2
-enriched seawater (Mohr et al., 2010; Wilson et al., 2012), hereafter called the15N2
dissolution method. Briefly, the 15N2-enriched seawater was prepared from 0.2
µm-filtered seawater (Sartobrand (Sartorius) cartridges) collected from the same site in a 4.5 L polycarbonate HCl-washed bottle. Seawater was first degassed through a
de-15
gassing membrane (Membrana, Minimodule®, flow rate fixed at 450 mL min−1)
con-nected to a vacuum pump (<200 mbar) for at least 1 h. The bottle was then closed with
a septum cap and amended with 1 mL of15N2 (98.9 atom%
15
N, Cambridge Isotopes Laboratories, Inc) per 100 mL of seawater. The bottle was shaken vigorously to
frag-ment the15N2bubble, and incubated overnight at 20 m depth at the study site (3 bars)
20
to promote 15N2 dissolution. The experiment bottles were amended with 5 % vol:vol
15
N2 enriched seawater (i.e. 225 mL), sealed without headspace with silicon septum
caps, and incubated for 24 h on an in situ mooring line located close to the mesocosms at the appropriate sampling depth. After 24 h, 12 mL of the incubated seawater were
subsampled into Exetainers®. These were preserved upside down in the dark at 4◦C
25
and analyzed less than 6 months after the experiment using a Membrane Inlet Mass
BGD
12, 19579–19626, 2015
Results from the VAHINE mesocosm
experiment
S. Bonnet et al.
Title Page
Abstract Introduction
Conclusions References
Tables Figures
◭ ◮
◭ ◮
Back Close
Full Screen / Esc
Printer-friendly Version Interactive Discussion
Discussion
P
a
per
|
Discussion
P
a
per
|
Discussion
P
a
per
|
Discussion
P
a
per
|
in the incubation bottles. The MIMS analyses yielded an average atom%15N for the
N2pool of 2.4±0.2 (n=10). After collection of the Exetainer ®
subsamples, 2.2 L from
each experiment bottle were filtered under low vacuum pressure (<100 mm Hg) onto
a pre-combusted (4 h at 450◦C) GF/F filter (25 mm diameter, 0.7 µm nominal
poros-ity) for “bulk” N2fixation determination. The remaining volume (2.2 L) was pre-filtered
5
through a 10 µm pore-size polycarbonate filter, and collected on a pre-combusted GF/F filter for analysis of the pico and nanoplanktonic (<10 µm) N2fixation rates. Filters were
stored at−20◦C until the end of the VAHINE experiment, then dried for 24 h at 60◦C
before mass spectrometric analysis. Every day, an extra 2.2 L bottle was filled with
mesocosm surface water (∼1 m), spiked with 15N2, and immediately filtered to
deter-10
mine the natural15N enrichment of the particulate organic N (PON), which is required
for calculations of N2 fixation rates. PON content and PON
15
N enrichment was de-termined using a Delta plus Thermo Fisher Scientific isotope ratio mass spectrometer (Bremen, Germany) coupled with an elemental analyzer (Flash EA, ThermoFisher Sci-entific). N2fixation rates were calculated according to the equations detailed in Montoya
15
et al. (1996). Rates were considered significant when the15N enrichment of the PON
was higher than three times the standard deviation obtained from T0 samples. The
standard deviation was 0.004 µmol for PON and 0.0001 atom% for the15N enrichment.
In the present study, we decided to use the 15N2 dissolution method to measure
N2 fixation rates as several authors (Großkopf et al., 2012; Mohr et al., 2010; Rahav
20
et al., 2013; Wilson et al., 2012) have reported an underestimation of rates when using the bubble method (i.e., when the15N2 gas is injected directly in the incubation bottle
using a syringe, see below) due to incomplete equilibration of the15N2 gas between
the headspace and the seawater in the incubation bottles compared to theoretical
cal-culations. However, the differences observed between the two methods appear to
de-25
BGD
12, 19579–19626, 2015
Results from the VAHINE mesocosm
experiment
S. Bonnet et al.
Title Page
Abstract Introduction
Conclusions References
Tables Figures
◭ ◮
◭ ◮
Back Close
Full Screen / Esc
Printer-friendly Version Interactive Discussion
Discussion
P
a
per
|
Discussion
P
a
per
|
Discussion
P
a
per
|
Discussion
P
a
per
|
were spiked with 4 mL15N2 (98.9 atom%
15
N, Cambridge isotopes Laboratories, Inc) via a gas-tight syringe, hereafter called the bubble method. Each bottle was shaken
20 times to fragment the15N2 bubble and facilitate its dissolution. The six remaining
bottles were treated as described above for the dissolution method. The twelve bottles were then incubated for 24 h in an on-deck incubator at irradiances corresponding to
5
the sampling depth using screening, and cooled with circulating surface seawater. A recent study (Dabundo et al., 2014) reports potential contamination of some com-mercial15N2gas stocks with
15
N-enriched NH+4, NO−3 and/or nitrite (NO−2), and nitrous oxide (N2O). Dabundo et al. (2014) analysed various brands of15N2gas and found that the Cambridge Isotopes stock (i.e., the one used in this study) contained low
concentra-10
tions of15N contaminants, and the potential overestimation of N2fixation rates modeled using this contamination level would range from undetectable to 0.02 nmol N L−1d−1.
The rates measured in this study ranged from 0.5 to 69.6 nmol N L−1
d−1
suggesting that, if present, stock contamination of the magnitude reported by (Dabundo et al., 2014) would be too low to affect the results described here. To verify this, we analyzed
15
one of our Cambridge Isotopes batches and found that the contamination of the15N2
gas stock was 1.4×10⁻⁸ mol of15NO−3mol −1
of15N2, and 1.1×10− 8
mol NH+4mol−1
of 15N2. The application of this contamination level to our samples using the model
described in Dabundo et al. (2014) indicates that our rates may only be overestimated
by∼0.05 % and confirmed that our present results were unaffected by possible15N2
20
stock contamination.
2.3 Phenotypic characterization of UCYN by microscopy
Seawater samples for microscopic analyses were collected every day from 1, 6, and 12 m in each mesocosm in 4.5 L polycarbonate bottles as described above. Samples were immediately filtered onto 2 µm 47 mm polycarbonate filters that were fixed with
25
paraformaldehyde (2 % final concentration) and incubated for 15 min at room
BGD
12, 19579–19626, 2015
Results from the VAHINE mesocosm
experiment
S. Bonnet et al.
Title Page
Abstract Introduction
Conclusions References
Tables Figures
◭ ◮
◭ ◮
Back Close
Full Screen / Esc
Printer-friendly Version Interactive Discussion
Discussion
P
a
per
|
Discussion
P
a
per
|
Discussion
P
a
per
|
Discussion
P
a
per
|
samples were homogenized and 2 mL were filtered onto 2 µm polycarbonate filters. To characterize the phenotype of UCYN (free living cells vs. colonies) in the mesocosms as a function of depth, we performed a detailed microscopic analysis on days 17 and 19 in M2 (during the bloom of UCYN-C and during the DDN transfer experiment described below). Filtered samples from each depth (1, 6, and 12 m) and from the sediment traps
5
(∼15 m) were visualized using a Zeiss Axioplan (Zeiss, Jena, Germany)
epifluores-cence microscope fitted with a green (510–560 nm) excitation filter, which targeted the UCYN phycoerythrin-rich cells. For each filter, 47 photographs of various sections of the filter were taken at random. Each fluorescent particle was automatically delimited as a region of interest (ROI) using an in-house imageJ script. The photographs were
10
then scanned visually to remove ROIs that did not correspond to UCYN cells or UCYN aggregated cells. The area of each ROI was converted to equivalent volume assuming a spherical shape for all the aggregates. The volume of individual cells was deter-mined from the average volume of the ROI represented by only one cell. The resultant cell volume was then used to compute the number of cells in each aggregate.
15
2.4 Quantification of diazotrophs using qPCR in sediment traps and during the
DDN transfer experiment
During the bloom of UCYN-C (days 17 and 19), immediately after sediment trap sam-ples were collected and prior to their fixation with formalin, trap material was homoge-nized and fresh aliquots of 1 mL were subsampled from each jar (trap from M1, M2, and
20
M3) and filtered onto 0.2 µm Supor (Pall-Gelman) filters, flash frozen in liquid N2, and stored at−80◦C until analysis. For the DDN experiment (see below), after each
incuba-tion period, 2 L from each triplicate13C and15N2-labeled 4.5 L bottle were subsampled and filtered through 0.2 µm Supor (Pall-Gelman) filters using gentle peristaltic pump-ing, and stored as described above. The abundance of eight diazotrophic phylotypes
25
was determined using Taqman® qPCR assays: unicellular cyanobacterial groups A1
BGD
12, 19579–19626, 2015
Results from the VAHINE mesocosm
experiment
S. Bonnet et al.
Title Page
Abstract Introduction
Conclusions References
Tables Figures
◭ ◮
◭ ◮
Back Close
Full Screen / Esc
Printer-friendly Version Interactive Discussion
Discussion
P
a
per
|
Discussion
P
a
per
|
Discussion
P
a
per
|
Discussion
P
a
per
|
filamentous, colonial cyanobacteriaTrichodesmiumspp. (Church et al., 2005),Richelia
associated with bothRhizosolenia (het-1, Church et al., 2005) andHemiaulus (het-2,
Foster et al., 2007) diatoms,Calothrixassociated withChaetoceros(het-3, Foster et al.,
2007), as well as a heterotrophic phylotype of gamma proteobacteria (γ-24474A11,
Moisander et al., 2008). All procedures are described extensively in the companion
pa-5
per by (Turk-Kubo et al., 2015). Briefly, DNA was extracted using a Qiagen DNeasy kit with modifications to recover high quality genomic DNA from cyanobacteria including a freeze thaw step, agitation and a proteinase K digestion. Extracts were tested for the presence of inhibitors using either the UCYN-B or UCYN-C qPCR assay, and if
recov-ery of the spiked qPCR standard was <98 %, the sample was considered inhibited,
10
and diluted 1 : 10 with 5kD filtered milliQ water. All extracts from the sediment traps showed inhibition when undiluted, and no inhibition when diluted 1 : 10. DNA extracts from the DDN transfer experiment showed no inhibition. All qPCR reactions were car-ried out on diluted extracts as described in (Goebel et al., 2010). The limit of detection
(LOD) and limit of quantitation (LOQ) was 250 and 2000 nifH copies mL−1,
respec-15
tively, for the sediment trap samples. The LOD and LOQ for DDN transfer experiment
samples was 29 and 229nifH copies L−1
, respectively.
2.5 DDN transfer experiment and nanoSIMS analyses
The fate of the fixed N2 during the UCYN-C bloom was investigated on days 17 to 20
in M2 at 6 m. In addition to N2 fixation measurements, seawater was sampled as
de-20
scribed above into twelve additional 4.5 L HCl-washed polycarbonate bottles equipped
with septum caps. Full bottles were immediately amended with the dissolved15N2gas
(98.9 atom%15N, Cambridge Isotopes Laboratories, Inc) as described above
(dissolu-tion method), and with 1 mL of 80 g L−1NaH13CO3solution (99 atom%13C, Cambridge
Isotopes Laboratories, Inc) and incubated in situ on the mooring line at the appropriate
25
sampling depth close to the mesocosms. After 24, 36, and 72 h of incubation (hereafter
referred to as T24, T36, and T72 h), three replicate 15N2 labelled bottles were
BGD
12, 19579–19626, 2015
Results from the VAHINE mesocosm
experiment
S. Bonnet et al.
Title Page
Abstract Introduction
Conclusions References
Tables Figures
◭ ◮
◭ ◮
Back Close
Full Screen / Esc
Printer-friendly Version Interactive Discussion
Discussion
P
a
per
|
Discussion
P
a
per
|
Discussion
P
a
per
|
Discussion
P
a
per
|
DDN released in the dissolved pool, abundance of targeted diazotrophs using qPCR as described above, picophytoplankton and bacterial counts, and nanoSIMS analyses on UCYN-C and non-diazotrophs (diatoms and the 0.2–2 µm fraction) to assess the
DD15N transfer from diazotrophs to non-diazotrophs. Three 4.5 L bottles were kept as
unamended controls (i.e., without15N2addition) and were immediately subsampled for
5
the same parameters.
Net release of DDN to the N dissolved pool. After each incubation period, 60 mL from
each 15N2-labeled 4.5 L bottle were subsampled and filtered through pre-combusted
(4 h, 450◦C) GF/F filters and immediately frozen for later quantification of 15N release (i.e., DDN release) to the total dissolved N (TDN; i.e., the sum of NO−2, NO−3, NH+4,
10
and DON) pool. The dissolved N was oxidized to NO−
3 using the persulfate oxidation
method (Knapp et al., 2005) with amendments of Fawcett et al. (2011). Briefly, 1 mL of potassium persulfate oxidizing reagent (POR) was added to duplicate 5 mL aliquots of each subsample in 12 mL pre-combusted glass Wheaton vials, and to triplicate vials containing varying quantities of two L-glutamic acid standards, USGS-40 and USGS-41
15
(Qi et al., 2003) used to ensure complete oxidation and quantify the POR-associated N blank. The POR was made by dissolving 6 g of sodium hydroxide and 6 g of four-times recrystallized, methanol-rinsed potassium persulfate in 100 mL of ultra-high purity wa-ter (DIW). Sample vials were capped tightly afwa-ter POR addition, and autoclaved at
121◦C for 55 min on a slow-vent setting. The entire oxidation protocol was performed
20
in duplicate (yielding a total of 4 oxidized aliquots for each subsample).
The denitrifying bacteria (see below) are extremely sensitive to pH; care was thus taken to lower sample pH to 7–8 after oxidation via the addition of 12N ACS grade HCl.
The concentration of the resultant NO−3 (i.e., TDN+the POR-associated N blank) was
measured via chemiluminescent analysis (Braman and Hendrix, 1989), after which the
25
TDN isotopic composition was determined using the “denitrifier method”, wherein den-itrifying bacteria that lack N2O reductase quantitatively convert sample NO−3 to N2O
(Casciotti et al., 2002; Sigman et al., 2001). The15N enrichment of the N2O was
BGD
12, 19579–19626, 2015
Results from the VAHINE mesocosm
experiment
S. Bonnet et al.
Title Page
Abstract Introduction
Conclusions References
Tables Figures
◭ ◮
◭ ◮
Back Close
Full Screen / Esc
Printer-friendly Version Interactive Discussion
Discussion
P
a
per
|
Discussion
P
a
per
|
Discussion
P
a
per
|
Discussion
P
a
per
|
on-line N2O extraction and purification system. The international reference materials,
IAEA-N3, USGS-34, USGS-32, and an in-house N2O standard were run in parallel to
monitor bacterial conversion and mass spectrometry, and each oxidized sample was
analyzed twice. The final TDN concentration and15N atom% were corrected for the
N blank associated with the POR. The DDN released to the TDN pool was
calcu-5
lated according to:15N release (nmol L−1d−1)=(15Nex×TDNcon)/Nsr, where 15
Nex is
the atom% excess of the TDN for a given time point; the TDNcon is the TDN
concen-tration measured at each time point, and Nsris the 15
N enrichment of the source pool (N2) in the experimental bottles (i.e., 2.4±0.2 atom%
15
N; see above).
Picophytoplankton and bacteria counts
10
After each incubation period, 3.6 mL from each15N2-lableled 4.5 L bottle were subsam-pled into cryotubes, fixed with paraformaldehyde (2 % final concentration), flash frozen in liquid N2, and stored at−80◦C until analysis. Flow cytometry analyses were carried out at the PRECYM flow cytometry platform (https://precym.mio.univ-amu.fr/). Samples were analyzed using a FACSCalibur (BD Biosciences, San Jose, CA). For heterotrophic
15
bacterial abundance (BA), 1.8 mL of seawater was fixed with formaldehyde (2 % final concentration, 15 min incubation at room temperature in the dark), frozen and stored in liquid N2until analysis in the laboratory. After thawing, 0.3 mL of each samples was
incubated with SYBR Green II (Molecular Probes, final conc. 0.05 % [v/v], for 15 min
at room temperature in the dark), for the nucleic acid staining, according to Marie et
20
al. (2000). Cells were characterized by 2 main optical signals: side scatter (SSC), re-lated to cell size, and green fluorescence (530/40), rere-lated to nucleic acids staining. Based on these criteria, two subsets of bacteria (referred to low- and high nucleic acid-containing, or LNA and HNA, respectively) were optically (Gasol et al., 1999). Just before analysis, 2 µm beads (Fluoresbrite YG, Polyscience), used as an internal
con-25
BGD
12, 19579–19626, 2015
Results from the VAHINE mesocosm
experiment
S. Bonnet et al.
Title Page
Abstract Introduction
Conclusions References
Tables Figures
◭ ◮
◭ ◮
Back Close
Full Screen / Esc
Printer-friendly Version Interactive Discussion
Discussion
P
a
per
|
Discussion
P
a
per
|
Discussion
P
a
per
|
Discussion
P
a
per
|
fluorescence (670LP, related to chlorophylla content) was used as trigger signal and
phytoplankton cells were characterized by 3 other optical signals: forward scatter (FSC, related to cell size), side scatter (SSC, related to cell structure), and the orange fluo-rescence (580/30, related to phycoerythrin content). The 2 µm beads (Fluoresbrite YG,
Polyscience) were also used to discriminate picoplankton (<2 µm) from nanoplankton
5
(>2 µm) populations. The flow rate was estimated by weighing 3 tubes of samples
be-fore and after a 3 min run of the cytometer. The cells concentration was determined from both Trucount beads and flow rate measurements. All data were collected in log scale and stored in list mode using the CellQuest software (BD Biosciences). Data analysis was performed a posteriori using SUMMIT v4.3 software (Dako).
10
Microscopic cell counts
In parallel with the picoplankton counts, diatoms, dinoflagellates, and ciliates were enu-merated from 100 mL subsamples collected from each mesocosm that were preserved in Lugol’s solution following the Utermöhl method (Hasle, 1978). Cells were counted on a Nikon Eclipse TE2000-E inverted microscope equipped with phase-contrast and
15
a long distance condenser. All groups were quantified in each sample, and diatoms were identified to the lowest possible taxonomic level to examine potential community composition changes and help us to prioritize nanoSIMS analyses.
nanoSIMS analyses
After each incubation period (24, 36 and 72 h), 250 mL from each labeled 4.5 L
bot-20
tle were subsampled, fixed with 25 mL of paraformaldehyde (2 % final concentration)
and incubated for 24 h at 4◦C, then filtered successively through 25 mm diameter 10,
2, and 0.2 µm pore size polycarbonate filters and rinsed with 0.2 µm filtered seawater. All filters were then sputtered with gold and palladium to ensure conductivity prior to nanoSIMS analyses. Diatoms and UCYN-C were analysed on the 10 µm filters, and the
25
BGD
12, 19579–19626, 2015
Results from the VAHINE mesocosm
experiment
S. Bonnet et al.
Title Page
Abstract Introduction
Conclusions References
Tables Figures
◭ ◮
◭ ◮
Back Close
Full Screen / Esc
Printer-friendly Version Interactive Discussion
Discussion
P
a
per
|
Discussion
P
a
per
|
Discussion
P
a
per
|
Discussion
P
a
per
|
were performed for each group of cells of interest (an average of∼25 cells analysed
for UCYN-C and diatoms, and between 62 and 140 cells analysed for the 0.2–2 µm fraction per time point) to assess the variability of their isotopic composition. A total
of ∼400 individual cells were analysed by nanoSIMS in this experiment to ensure
the robustness of the data. NanoSIMS analyses were performed on a N50 (Cameca,
5
Gennevilliers France) at the French National Ion MicroProbe Facility according to
meth-ods previously described (Bonnet et al., 2015). A 1.3–3 pA 16 keV Cesium (Cs+)
pri-mary beam focused onto a∼100 nm spot diameter was scanned on a 256×256 or
512×512 pixel raster (depending on the raster areas, which ranged from 15 µm×15 µm
to 50 µm×50 µm) with a counting time of 1 ms per pixel. Samples were implanted with
10
Cs+ prior to analysis to remove surface contaminants and increase conductivity. For
diatoms, the pre-implant was longer and with higher voltage (2–5 min, 17 pA) to pen-etrate the silica shell. Negative secondary ions 12C−, 13C−, 12C14N−, 12C15N−, and 28
Si− were detected with electron multiplier detectors, and secondary electrons were
imaged simultaneously. Ten to fifty serial quantitative secondary ion mass planes were
15
generated and accumulated in the final image. Mass resolving power was∼8000 in
or-der to resolve isobaric interferences. Data were processed using the look@nanosims software package (Polerecky et al., 2012). All scans were first corrected for any drift of the beam during acquisition, and N isotope ratio images were generated by dividing the12C15N−ion count by the12C14N−ion count for each pixel over all recorded planes,
20
averaged for all pixels and planes. Individual cells were easily identified in nanoSIMS secondary electron,12C−,12C14N−, and28Si images that were used to define regions
of interest (ROI) around individual cells (28Si data are not presented here). For each
ROI, the atom%15N was calculated.
15N assimilation rates from nanoSIMS data
25
15
N assimilation rates were calculated for individual cells analysed by nanoSIMS to
determine the biological compartment to which the15N had been transferred. These
(Fos-BGD
12, 19579–19626, 2015
Results from the VAHINE mesocosm
experiment
S. Bonnet et al.
Title Page
Abstract Introduction
Conclusions References
Tables Figures
◭ ◮
◭ ◮
Back Close
Full Screen / Esc
Printer-friendly Version Interactive Discussion
Discussion
P
a
per
|
Discussion
P
a
per
|
Discussion
P
a
per
|
Discussion
P
a
per
|
ter et al., 2011, 2013): Assimilation (mol N cell−1d−1)=(15Nex×Ncon)/Nsr, where 15
Nex is the excess atom% of the individual cells measured by nanoSIMS after 24 h of
incu-bation; the Ncon is the N content of each cell determined as described below, and Nsr
is the15N enrichment of the source pool (N2) in the experimental bottles (i.e. 2.4±0.2
atom% 15N in this experiment). The cell-specific N assimilation rate was then
multi-5
plied by the cell number enumerated for each group of phytoplankton and bacteria by microscopy and flow cytometry. Standard deviations were calculated using the
vari-ability of15N enrichment measured by nanoSIMS on replicate cells and the standard
deviation of the estimated cellular N content (see below) of UCYN-C, non-diazotrophic phytoplankton, and bacteria. Final standard deviations were calculated according to
10
propagation of errors laws.
To determine the Ncon of diatoms, cell cross section, apical and transapical
dimen-sions were measured on the dominant diatom species present in the mesocosms and analysed by nanoSIMS to calculate biovolumes. All dimensions were measured on at least 20 cells using a Nikon Eclipse TE2000-E inverted microscope equipped with
15
phase-contrast and a long distance condenser. Dimensions were entered into the in-ternational diatom data base (Leblanc et al., 2012) in which bio-volumes are calculated following the geometric model of each cell type as described in (Sun and Liu, 2003).
Carbon (C) content (Ccon) was then calculated for the species of interest using the
equations of (Eppley et al., 1970) and (Smayda, 1978). ForSynechococcusspp. and
20
picoeukaryotes, we used Ccon data from Fu et al. (2007) (249±21 fg C cell−1) and
Yentsch and Phinney (1985) (2100 fg cell−1), respectively. Ccon was then converted to Ncon using the Redfield ratio of 6.6 : 1 (Redfield, 1934). For bacteria, an average Ncon
of 5.8±1.5 fg N cell−1 (Fukuda et al., 1998) was used. For UCYN-C, cell dimensions
were measured and the bio-volume was calculated based on the equations reported
25
in Sun and Liu (2003). Ccon was then calculated using the relationship between
bio-volume and Ccon (Verity et al., 1992) (22 pg cell−1). C
con was then converted to Ncon
BGD
12, 19579–19626, 2015
Results from the VAHINE mesocosm
experiment
S. Bonnet et al.
Title Page
Abstract Introduction
Conclusions References
Tables Figures
◭ ◮
◭ ◮
Back Close
Full Screen / Esc
Printer-friendly Version Interactive Discussion
Discussion
P
a
per
|
Discussion
P
a
per
|
Discussion
P
a
per
|
Discussion
P
a
per
|
2.6 Statistical analyses
Spearman correlation coefficients were used to examine the relationships between N2
fixation rates, hydrological, biogeochemical, and biological variables in the mesocosms
(n=57 to 61,α=0.05). The methods used to analyze the parameters reported in the
correlation table are described in detail in companion papers in this issue (Berthelot
5
et al., 2015b; Bonnet et al., 2015a; Leblanc et al., 2015; Turk-Kubo et al., 2015).
A non-parametric Mann–Whitney test (α=0.05) was used to compare the means
of N2 fixation rates obtained using the dissolution and the bubble method, as well
as to compare the means of N2 fixation between the different phases of the
experi-ment, mean isotopic ratios between15N2-enriched and natural abundance of N (0.366
10
atom%), and mean isotopic ratios between T24 and T72 h in the DDN transfer experi-ment.
3 Results
3.1 N2fixation rates in the mesocosms
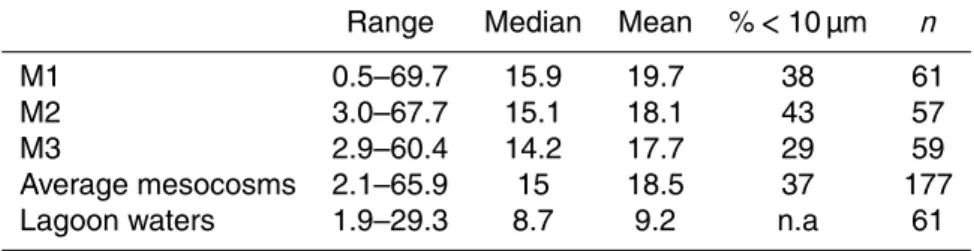
Bulk N2fixation rates averaged 18.5±1.1 nmol N L−1d−1over the 23 days of the
exper-15
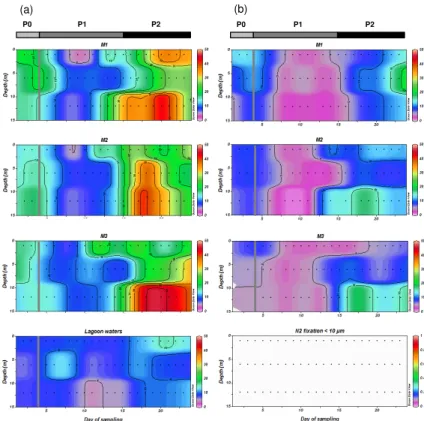
iment in the three mesocosms (all depths averaged together) (Table 1). The variance between the three mesocosms was low, and the temporal dynamics of the rates were similar (Fig. 2, Table 1), indicating good replicability between the mesocosms. Three
main periods were identified based on the N2fixation dynamics; these were also
iden-tified by Berthelot et al. (2015b) based on biogeochemical characteristics and by
Turk-20
Kubo et al. (2015) based on changes in abundances of targeted diazotrophs. During the first period (P0; from day 2 to 4, i.e., prior to the DIP fertilization), the average bulk N2 fixation rate for the three mesocosms was 17.9±2.5 nmol N L−1d−1(Fig. 2a). These N2 fixation rates decreased significantly (p <0.05) by∼40 % from day 5 to∼15 (hereafter
called P1) to 10.1±1.3 nmol N L−1d−1, then increased significantly (p <0.05) from day
BGD
12, 19579–19626, 2015
Results from the VAHINE mesocosm
experiment
S. Bonnet et al.
Title Page
Abstract Introduction
Conclusions References
Tables Figures
◭ ◮
◭ ◮
Back Close
Full Screen / Esc
Printer-friendly Version Interactive Discussion
Discussion
P
a
per
|
Discussion
P
a
per
|
Discussion
P
a
per
|
Discussion
P
a
per
|
15 until the end of the experiment (day 15 to 23, hereafter called P2) to an average of
27.3±1.0 nmol N L−1d−1 (Fig. 2a). Maximum rates were reached during P2 (between
days 18 and 21) with 69.7, 67.7 and 60.4 nmol N L−1d−1in M1 (12 m), M2 (6 m) and M3
(12 m), respectively. From day∼15 to 21, N2 fixation rates were higher at 12 m depth
than in the surface. The difference was significant in M2 and M3 (p <0.05), but not in
5
M1 (p >0.05). Size fractionation experiments indicate that 37±7 % of the measured
N2fixation was associated with the<10 µm size fraction (Fig. 2b), and N2fixation rates in this fraction followed the same temporal trend as bulk N2fixation. These data indicate
that for the experiment as a whole, the majority (∼63 %) of the N2 fixation was
asso-ciated with the>10 µm fraction. N2fixation rates measured in the lagoon waters were
10
half those measured in the mesocosms, and were on average 9.2±4.7 nmol N L−1d−1
over the 23 days of the experiment.
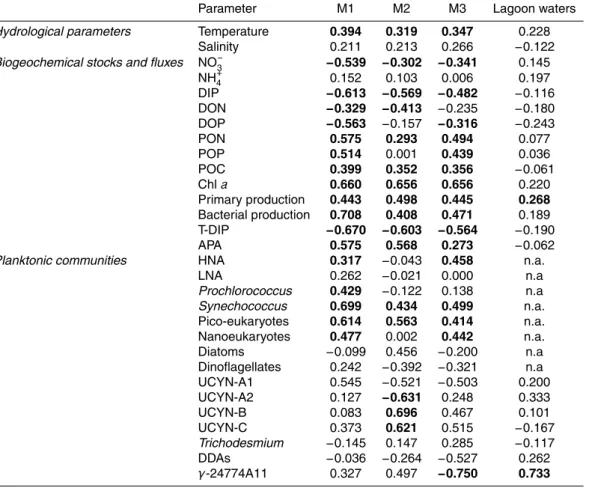
The Spearman correlation matrix (Table 2) indicates that N2 fixation was positively
correlated with seawater temperature in the mesocosms, which was not the case in la-goon waters, although temperature was exactly the same inside and outside the
meso-15
cosms (from 25.4◦C to 26.8◦C) (Bonnet et al., 2015a). N2 fixation in the mesocosms
was also positively correlated with particulate organic carbon (POC), particulate or-ganic nitrogen (PON), and particulate oror-ganic phosphorus (POP) (except in M2)
con-centrations, Chl a concentrations, primary production, bacterial production, alkaline
phosphatase activity (APA), and Synechococcus, picoeukaryote and nanoeukaryote
20
(except in M2) abundances. N2fixation was negatively correlated with NO−3, DIP, DON, dissolved organic phosphorus (DOP) (except in M2) concentrations, and DIP turn-over time.
The intercomparison between the bubble and dissolution methods performed on
day 11 in M2 indicates that rates determined for the 6 replicates were 7.2±
25
0.8 nmol N L−1d−1and 6.4±2.0 nmol N L−1d−1for the dissolution method and the
bub-ble method, respectively, demonstrating that, at least in this study, N2 fixation rates
BGD
12, 19579–19626, 2015
Results from the VAHINE mesocosm
experiment
S. Bonnet et al.
Title Page
Abstract Introduction
Conclusions References
Tables Figures
◭ ◮
◭ ◮
Back Close
Full Screen / Esc
Printer-friendly Version Interactive Discussion
Discussion
P
a
per
|
Discussion
P
a
per
|
Discussion
P
a
per
|
Discussion
P
a
per
|
3.2 Phenotypic characterization of UCYN by microscopy
The size of the UCYN-C cells present in the mesocosms was 5.7±0.8 µm (n=17).
Both free-living and aggregated UCYN-C cells were observed in the mesocosm water column. However, the detailed microscopic analysis performed on day 17 and day 19 in M2 (during the bloom of UCYN-C) (Fig. 3) indicates that the proportion of free-living
5
cells (ROI characterized by one cell or two cells defined as dividing cells) was low
(<1 % on day 17 and <5 % on day 19). The average number of UCYN-C cells per
aggregate increased with depth (Fig. 3a), with the size of the aggregates reaching 50–100 µm at 6 m and 100–500 µm at 12 m depth. On day 17, the number of cells per aggregate averaged 162, 74, and 1273 at 1, 6, and 12 m, respectively. On day
10
19, the aggregates were much smaller (∼50 µm) with only 4, 11, and 19 cells per
aggregate. The sediment traps contained extremely high densities of UCYN-C cells with the average number of cells per aggregate 60 to 50 000 times higher than that measured in the water column aggregates (Fig. 3b–e).
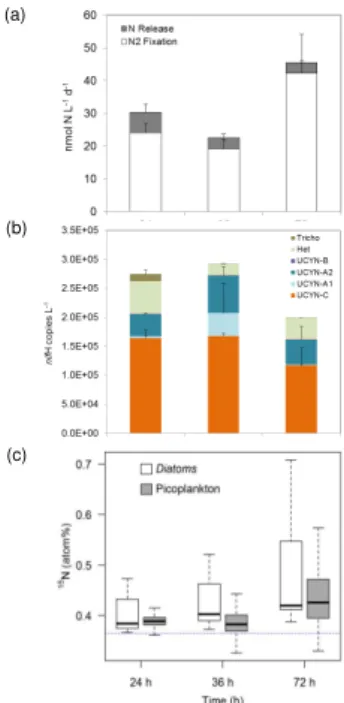
3.3 Quantification of diazotrophs in sediment traps
15
qPCR analysis confirmed that UCYN-C was the most abundant diazotroph in the
sed-iment traps on days 17 and 19, with abundances reaching 2.7×10⁸ to 4×10⁹ nifH
copies L−1(Fig. 4a). UCYN-C accounted for 97.4 to 99.2 % of the totalnifH pool
quan-tified in the traps. Abundances were higher in M2 and M3 (1.8×10⁹in M2 and 3×10⁹
nifH copies L−1 in M3) compared to M1 (2.5
×108 nifH copies L−1) on day 19. Het-1
20
and het-3 were always recovered in the sediment traps, albeit at lower abundances (1.8 to 8.6×10⁶ nifH copies L−1 for het-1 and 4.9×10⁶ to 2.8×10⁷ nifH copies L−1
for het-3) (Fig. 4b). They represented between 0.1 and 1.8 % of the targetednifH pool.
UCYN-B was often detected (except in M1 day 19), and UCYN-A2 andTrichodesmium
were detected in M2 on day 17 but at low abundances (0.05 % of the totalnifH pool)
25
compared to the other phylotypes. Het-2 was never detected in the traps, and neither
BGD
12, 19579–19626, 2015
Results from the VAHINE mesocosm
experiment
S. Bonnet et al.
Title Page
Abstract Introduction
Conclusions References
Tables Figures
◭ ◮
◭ ◮
Back Close
Full Screen / Esc
Printer-friendly Version Interactive Discussion
Discussion
P
a
per
|
Discussion
P
a
per
|
Discussion
P
a
per
|
Discussion
P
a
per
|
Using the volume of each mesocosm (Bonnet et al., 2015a) and the totalnifH copies
for each diazotroph phylotype in the water column (Turk-Kubo et al., 2015) and in
the sediments, we were able to calculate the export efficiency for each phylotype: for
UCYN-C, 10.0 and 9.5 % of the cells present in the water column were exported per
24 h in the traps on day 17 and 19, respectively (assuming onenifH copy per cell). For
5
het-1, 0.2 % of cells were exported into the traps on both days, for het-3, 3.2 and 4.7 % were exported, and for UCYN-B, 3.7 and 45.6 % of UCYN-B were exported on day 17
and 19, respectively. These results indicate that UCYN were more efficiently exported
than DDAs in this experiment.
3.4 DDN transfer experiment performed on day 17
10
Net N2 fixation rates were 24.1±2.8 nmol N L−1d−1 during the first 24 h of the DDN
transfer experiment performed from days 17 to 20 (Fig. 5a). Rates decreased at 48 h to 19.2±2.8 nmol N L−1d−1and increased to 42.2±11.8 nmol N L−1d−1at T72 h.
The DDN released to the TDN pool ranged from 6.2±2.4 nmol N L−1d−1 at T24 h to
3.2±0.5 nmol N L−1d−1 at T72 h. Considering gross N2 fixation as the sum of net N2
15
fixation and DDN release (Mulholland et al., 2004), the DDN released to the TDN pool accounted for 7.1±1.2 to 20.6±8.1 % of gross N2fixation.
During the 72 h targeted experiment (Fig. 5b) the diazotroph assemblage reflected that of the mesocosms from which they were sampled: UCYN-C dominated the
dia-zotrophic community, comprising on average 62 % of the totalnifHpool. The other most
20
abundant phylotypes were UCYN-A2 and het-2, which represented 18 and 13 % of
the totalnifH pool, respectively. UCYN-A1, UCYN-B, het-1, het-3, andTrichodesmium
were also detected but together they comprised less than 8 % of the total targeted community. Phylotype abundances remained relatively stable throughout the 72 h of the experiment.
25
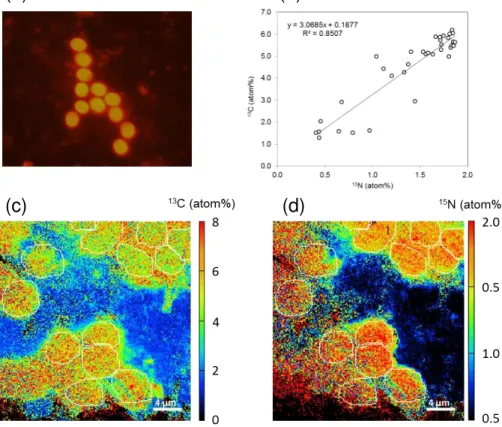
NanoSIMS analyses performed on individual UCYN-C at 24 h (Fig. 6) revealed sig-nificant (p <0.05)13C (1.477±0.542 atom%,n=35) and15N (1.515±0.370 atom%,
ac-BGD
12, 19579–19626, 2015
Results from the VAHINE mesocosm
experiment
S. Bonnet et al.
Title Page
Abstract Introduction
Conclusions References
Tables Figures
◭ ◮
◭ ◮
Back Close
Full Screen / Esc
Printer-friendly Version Interactive Discussion
Discussion
P
a
per
|
Discussion
P
a
per
|
Discussion
P
a
per
|
Discussion
P
a
per
|
tively photosynthesizing and fixing N2. The correlation between
13
C enrichment and 15
N enrichment was significant (r=0.85, p <0.01, Fig. 6b). NanoSIMS analyses
per-formed on diatoms and picoplankton (Fig. 5c) also revealed significant (p <0.05)15N enrichment of non-diazotrophic plankton, demonstrating a transfer of DDN from the diazotrophs to other phytoplankton. Both diatoms and picoplanktonic cells were
signif-5
icantly (p <0.05) more enriched at the end of the experiment (T72 h) (0.489±0.137
atom%, n=12 for diatoms; 0.457±0.077 atom%, n=96 for picopankton) than after
the first 24 h (0.408±0.052 atom%,n=23 for diatoms; 0.389±0.014 atom%,n=63
for picoplankton). Finally, the15N enrichment of picoplankton and diatoms was not
sig-nificantly different (p >0.05) during the DDN experiment.
10
4 Discussion
4.1 The bubble vs. the dissolution method: an intercomparison experiment
The inter-comparison experiment performed on day 11 reveals slightly lower, yet in-significantly different (p >0.05), average N2 fixation rates when using the bubble method compared to the dissolution method. This result is in accordance with some
15
comparisons made by Shiozaki et al. (2015) in temperate waters of the North Pacific.
However, one might expect a lower degree of dissolution of the15N2 bubble in warm
tropical waters such as those near New Caledonia compared to the cooler, temperate
North Pacific waters. In calculating N2 fixation rates using the dissolution method, we
used the value of 2.4±0.2 atom% for the15N enrichment of the N2pool as measured
20
by MIMS. For the bubble method, we used the theoretical value of 8.4 atom%
calcu-lated for seawater with a temperature of 25.5◦C and salinity of 35.3 (as was the case
on day 11). If we assume that equilibration was incomplete in our experiment using the bubble method, i.e., 75 % instead of 100 % as shown by Mohr et al. (2010), we calcu-late higher N2fixation rates for the bubble method (8.3±2.8 nmol N L−
1
d−1) compared
BGD
12, 19579–19626, 2015
Results from the VAHINE mesocosm
experiment
S. Bonnet et al.
Title Page
Abstract Introduction
Conclusions References
Tables Figures
◭ ◮
◭ ◮
Back Close
Full Screen / Esc
Printer-friendly Version Interactive Discussion
Discussion
P
a
per
|
Discussion
P
a
per
|
Discussion
P
a
per
|
Discussion
P
a
per
|
to the dissolution method (7.2±0.8 nmol N L−1d−1), although the difference is still not
significant (p >0.05).
4.2 The temporal dynamics of N2fixation in the mesocosms
Average N2 fixation rates measured in the lagoon waters (outside the mesocosms,
9.2±4.7 nmol N L−1d−1, Table 1) are of the same order of magnitude as those
re-5
ported for the Noumea lagoon during austral summer conditions (Biegala and Raim-bault, 2008). They are within the upper range of rates reported in the global ocean
database (Luo et al., 2012). Indeed, open ocean cruises performed offshore of New
Caledonia in the Coral and Solomon Seas (e.g., Bonnet et al., 2015b; Garcia et al., 2007) also suggest that the South West Pacific Ocean is one of the areas with the
10
highest N2fixation rates in the global ocean.
In the mesocosms, rates were on average twice as high (18.5±1.1 nmol N L−1d−1)
as those measured in lagoon waters (9.2±4.7 nmol N L−1d−1), with the maximum
ob-served rates of>60 nmol N L−1 d−1
ranking among the highest reported for marine
wa-ters (Luo et al., 2012). The predominant difference between the ambient lagoon waters
15
and those of the mesocosms were the modified DIP concentrations. The mesocosms
were fertilized with DIP on day 4, reaching ambient concentrations of∼0.8 µmol L−1
compared to lagoon waters in which DIP concentrations were typically<0.05 µmol L−1. According to our experimental assumption, diazotrophy would be promoted by high
concentrations of DIP. Yet, in all three mesocosms, N2 fixation rates were negatively
20
correlated with DIP concentrations and DIP turnover time and positively correlated with
APA, suggesting that DIP deficiency may have induced favorable conditions for N2
fixa-tion (Table 2). Below, we describe the scenario that likely occurred in the mesocosms, which explains these unexpected negative correlations.
During P0 (day 2 to 4), N2 fixation rates were higher in the mesocosms than in
25
abun-BGD
12, 19579–19626, 2015
Results from the VAHINE mesocosm
experiment
S. Bonnet et al.
Title Page
Abstract Introduction
Conclusions References
Tables Figures
◭ ◮
◭ ◮
Back Close
Full Screen / Esc
Printer-friendly Version Interactive Discussion
Discussion
P
a
per
|
Discussion
P
a
per
|
Discussion
P
a
per
|
Discussion
P
a
per
|
dant diazotrophs in the mesocosms at P0 were het-1 andTrichodesmium, which were
probably the most competitive groups under the initial conditions, i.e., NO−3
deple-tion (concentradeple-tions were below 0.04 µmol L−1
) and extremely low DIP concentrations
(0.03±0.01 µmol L−1).Trichodesmiumis able to use organic P substrates (DOP pool)
under conditions of DIP deficiency (Dyhrman et al., 2006; Sohm and Capone, 2006).
5
24 h after the DIP fertilization (day 5), N2 fixation rates in the mesocosms decreased
by∼40 %, reaching comparable rates as those measured in lagoon waters during P1
(day 5 to 14). Enhanced DIP availability likely enabled non-diazotrophic organisms with lower energetic requirements and higher growth rates to outcompete the diazotrophs
in the mesocosms via utilization of recycled N derived from recent N2 fixation. This is
10
supported by the observation that nano-eukaryotes and non-diazotrophic
cyanobac-teria such asProchlorococcus sp. increased in abundance during P1 (Leblanc et al.,
2015) in the three mesocosms while N2fixation rates declined (Fig. 2).
During P2 (day 15 to 23), N2 fixation rates increased dramatically in all three
meso-cosms. This period was defined by a high abundance of UCYN-C, which were present
15
in low numbers in the lagoon and within the mesocosms during P0 and P1 (Turk-Kubo et al., 2015). The increase in UCYN-C abundance was synchronous with a decrease in DIP concentrations in the mesocosms (Turk-Kubo et al., 2015): UCYN-C abundance first increased in M1 (day 11), subsequently in M2 (day 13), and finally in M3 (day 15). In all cases, the increase in UCYN-C abundance coincided with the day on which
20
the DIP turnover time dropped below 1 d, indicative of DIP limitation (Berthelot et al.,
2015b; Moutin et al., 2005). Under NO−3 depletion and low DIP availability, UCYN-C
ap-peared to be the most competitive diazotroph in the mesocosms, as they exhibited the highest maximum growth rates compared to those calculated for the other diazotrophic
phylotypes for the same period (Turk-Kubo et al., 2015). SomeCyanothecestrains
pos-25
sess the genes enabling the utilization of organic P substrates such as phosphonates
(Bandyopadhyay, 2011). Thus, UCYN-C, which were the major contributors to N2
fix-ation during P2 (see below) may have used DOP as a P source, consistent with the
BGD
12, 19579–19626, 2015
Results from the VAHINE mesocosm
experiment
S. Bonnet et al.
Title Page
Abstract Introduction
Conclusions References
Tables Figures
◭ ◮
◭ ◮
Back Close
Full Screen / Esc
Printer-friendly Version Interactive Discussion
Discussion
P
a
per
|
Discussion
P
a
per
|
Discussion
P
a
per
|
Discussion
P
a
per
|
Table 2), and driving the significant decline in DOP concentrations observed in all three mesocosms during P2 (Berthelot et al., 2015b; Moutin et al., 2005).
While temperature was not correlated with N2 fixation in the lagoon, in the
meso-cosms we observed a significant positive correlation between these parameters (Ta-ble 2), probably because some diazotrophic phylotypes present in the mesocosms
5
and absent in the lagoon waters were particularly sensitive to seawater temperature. UCYN-C reached high abundances inside the mesocosms, but was virtually absent in the lagoon waters outside the mesocosms. Turk-Kubo et al. (2015) showed that UCYN-C abundance was positively correlated with seawater temperature, suggesting that the
optimal temperature for UCYN-C growth is above 25.6◦C. This result is consistent with
10
culture studies performed using three UCYN-C isolates from the Noumea lagoon that are closely related to the UCYN-C observed here, indicating maximum growth rates at
around 30◦C and no growth below 25◦C (Camps, Turk-Kubo, Bonnet, personal
com-munication, 2015). Temperature above 25.6◦C and up to 26.7◦C were reached since
day 12 up to the end in the mesocosm experiment, possibly explaining why UCYN-C
15
was not evident during P0 (when temperature 25.4◦C) even though DIP turn-over time
was∼1d (Berthelot et al., 2015b; Moutin et al., 2005).
If low DIP concentrations (turn-over time less than 1 d) and seawater temperatures
greater than 25.6◦C are prerequisites for UCYN-C growth, an obvious question is why
they did not thrive (despite being present at low abundances) in the lagoon waters
20
during P2 when similar conditions prevailed. Below, we consider three possible expla-nations that are discussed extensively in Turk-Kubo et al. (2015): first, it is possible that UCYN-C are sensitive to turbulence, which was likely reduced in the mesocosms compared to the lagoon waters that are susceptible to trade winds and tides. Second, grazing pressures on UCYN-C may have been reduced as total zooplankton
abun-25
BGD
12, 19579–19626, 2015
Results from the VAHINE mesocosm
experiment
S. Bonnet et al.
Title Page
Abstract Introduction
Conclusions References
Tables Figures
◭ ◮
◭ ◮
Back Close
Full Screen / Esc
Printer-friendly Version Interactive Discussion
Discussion
P
a
per
|
Discussion
P
a
per
|
Discussion
P
a
per
|
Discussion
P
a
per
|
In the mesocosms, the cell specific 15N2 fixation rate measured on day 17 (M2) for
UCYN-C was 6.3±2.0 ×10⁻¹⁷mol N cell−1d−1. Multiplying this rate by the abundance
of UCYN-C indicates that UCYN-C accounted for 90±29 % of bulk N2fixation during
that period. This is consistent with the positive correlation observed between N2fixation rates and UCYN-C abundances in M2 (Table 2). In M1 and M3, the correlation was also
5
positive despite being insignificant, which may be due to the low number of
UCYN-C data points that decreases the sensitivity of the test. UCYN-Coupling between 13C and
15
N incorporation in the mesocosms was significant (r =0.85, p <0.01) (Fig. 6b) and
contrasts with results reported by Berthelot et al. (2015c) for UCYN-C, in which13C
and15N enrichment (and thus inorganic C and N2fixation) was uncoupled in the cells.
10
Based on their observations, these authors suggest that the heterogeneity in the15N
and13C enrichments is explained by a specialization of some cells such as diazocytes
(similar to those that contain the nitrogenase enzyme in the case of Trichodesmium
sp.) that induce variability in cell-specific15N-enrichment. In the present study,
UCYN-C cells were fixing both13C and 15N proportionally, which suggests that the UCYN-C
15
in our experiments did not specialize some cells as diazocytes. This is supported by a previous study showing that diazocyte formation by UCYN depends on the phenotype considered (Foster et al., 2013).
4.3 UCYN aggregation and export
Throughout the 23 days of experiment, the majority of N2fixation (63 %) occurred in the
20
>10 µm size fraction, even during P2 when the small (5.7±0.8 µm) unicellular
UCYN-C dominated the diazotrophic community in the mesocosms. These findings can be explained by the aggregation of UCYN-C cells into large (>10 µm) aggregates (Fig. 7) that were retained on 10 µm filters (Fig. 3). These large UCYN-C aggregates probably formed in part due to the presence of sticky TEP (Berman-Frank et al., 2015) or other
25
BGD
12, 19579–19626, 2015
Results from the VAHINE mesocosm
experiment
S. Bonnet et al.
Title Page
Abstract Introduction
Conclusions References
Tables Figures
◭ ◮
◭ ◮
Back Close
Full Screen / Esc
Printer-friendly Version Interactive Discussion
Discussion
P
a
per
|
Discussion
P
a
per
|
Discussion
P
a
per
|
Discussion
P
a
per
|
and Malfatti, 2007). Their aggregation and subsequent sinking in the mesocosms likely explains why volumetric N2fixation rates were higher at 12 m than at the surface during P2, as well as why the size of the aggregates increased with depth, and why numerous large-size aggregates and extremely high abundances of UCYN-C were recovered in the sediment traps.
5
Colonial phenotypes of UCYN (UCYN-B) have been observed in the water column of the North Tropical Pacific (ALOHA station) (Foster et al., 2013), but to our knowl-edge, this is the first time that UCYN have been detected in sediment traps. Contrary to published data (e.g. White et al., 2012 we demonstrate a greater export efficiency of
UCYN (∼10 % exported to the traps within 24 h) compared to the export of DDAs (effi
-10
ciency of 0.24 to 4.7 %). Diatoms sink rapidly and DDAs have been found in sediment traps at Station ALOHA (Karl et al., 2012, 1997; Scharek et al., 1999a; Sharek et al., 1999b), in the Gulf of California (White et al., 2012), and in the Amazon River plume (Subramaniam et al., 2008). In our study, we observed limited export of het-1 (Richelia
in association withRhizosolenia) and het-3 (Calothrix) during P2, while het-2 (Richelia
15
associated withHemiaulus) was never recovered in the sediment traps. This is likely
becauseHemiaulushas a lower sinking rate thanRhizosoleniadue do its smaller size,
or may be more easily grazed by zooplankton than Rhizosolenia or Calothrix, which
are known to be toxic to crustaceans (Höckelmann et al., 2009).Trichodesmiumwas
very rarely exported in this study, probably due to its extremely limited presence and
20
low growth rates in the mesocosms. Direct comparisons of our export results with find-ings from open ocean studies should be made cautiously as our mesocosms were both shallower (15 m) than typical oceanic export studies (>100 m) and probably character-ized by reduced turbulence (Moisander et al., 1997).
We estimate in M2 that the direct export of UCYN-C accounted for 22.4±5.5 % of
25
the total POC exported in each mesocosm at the height of the UCYN-C bloom (day 17)
and decreased to 4.1±0.8 % on day 19 (Fig. 4c, Fig. 7). This calculation is based on
the total particulate organic C (POC) content measured in the sediment traps