ACPD
6, 11745–11816, 2006Consequences of regional scale nuclear conflicts
O. B. Toon et al.
Title Page
Abstract Introduction
Conclusions References
Tables Figures
◭ ◮
◭ ◮
Back Close
Full Screen / Esc
Printer-friendly Version
Interactive Discussion
EGU
Atmos. Chem. Phys. Discuss., 6, 11745–11816, 2006 www.atmos-chem-phys-discuss.net/6/11745/2006/ © Author(s) 2006. This work is licensed
under a Creative Commons License.
Atmospheric Chemistry and Physics Discussions
Atmospheric e
ff
ects and societal
consequences of regional scale nuclear
conflicts and acts of individual nuclear
terrorism
O. B. Toon1, R. P. Turco2, A. Robock3, C. Bardeen1, L. Oman3, and G. L. Stenchikov3
1
Department of Atmospheric and Oceanic Sciences, Laboratory for Atmospheric and Space Physics, University of Colorado, Boulder, Colorado, USA
2
Department of Atmospheric and Oceanic Sciences, Univ. of California, Los Angeles, USA 3
Department of Environmental Sciences, Rutgers Univ., New Brunswick, New Jersey, USA
Received: 15 August 2006 – Accepted: 8 November 2006 – Published: 22 November 2006
ACPD
6, 11745–11816, 2006Consequences of regional scale nuclear conflicts
O. B. Toon et al.
Title Page
Abstract Introduction
Conclusions References
Tables Figures
◭ ◮
◭ ◮
Back Close
Full Screen / Esc
Printer-friendly Version
Interactive Discussion Abstract
We assess the potential damage and smoke production associated with the detonation of small nuclear weapons in modern megacities. While the number of nuclear war-heads in the world has fallen by about a factor of three since its peak in 1986, the number of nuclear weapons states is increasing and the potential exists for numerous
5
regional nuclear arms races. Eight countries are known to have nuclear weapons, 2 are constructing them, and an additional 32 nations already have the fissile material needed to build substantial arsenals of low-yield (Hiroshima-sized) explosives. Pop-ulation and economic activity worldwide are congregated to an increasing extent in megacities, which might be targeted in a nuclear conflict. Our analysis shows that, per
10
kiloton of yield, low yield weapons can produce 100 times as many fatalities and 100 times as much smoke from fires as high-yield weapons, if they are targeted at city cen-ters. A single “small” nuclear detonation in an urban center could lead to more fatalities, in some cases by orders of magnitude, than have occurred in the major historical con-flicts of many countries. We analyze the likely outcome of a regional nuclear exchange
15
involving 100 15-kt explosions (less than 0.1% of the explosive yield of the current global nuclear arsenal). We find that such an exchange could produce direct fatalities comparable to all of those worldwide in World War II, or to those once estimated for a “counterforce” nuclear war between the superpowers. Megacities exposed to atmo-spheric fallout of long-lived radionuclides would likely be abandoned indefinitely, with
20
severe national and international implications. Our analysis shows that smoke from urban firestorms in a regional war would rise into the upper troposphere due to pyro-convection. Robock et al. (2006) show that the smoke would subsequently rise deep into the stratosphere due to atmospheric heating, and then might induce significant climatic anomalies on global scales. We also anticipate substantial perturbations of
25
ACPD
6, 11745–11816, 2006Consequences of regional scale nuclear conflicts
O. B. Toon et al.
Title Page
Abstract Introduction
Conclusions References
Tables Figures
◭ ◮
◭ ◮
Back Close
Full Screen / Esc
Printer-friendly Version
Interactive Discussion
EGU
They deserve careful analysis by governments worldwide advised by a broad section of the world scientific community, as well as widespread public debate.
1 Introduction
In the 1980s, quantitative studies of the consequences of a nuclear conflict between the superpowers provoked international scientific and political debate, and deep public
5
concern (Crutzen and Birks, 1982; Turco et al., 1983; Pittock et al., 1989). The result-ing recognition that such conflicts could produce global scale damage at unacceptable levels contributed to an ongoing reduction of nuclear arsenals and improvements in relationships between the major nuclear powers. Here we provide the first comprehen-sive quantitative study of the consequences of a nuclear conflict between the emerging
10
smaller nuclear states, including the use of a single nuclear weapon by a state or ter-rorist. Robock et al. (2006) explore the climate changes that might occur due to the smoke emissions from such a conflict.
The potential effects of nuclear explosions having yields similar to those of the
weapons used over Japan during the Second World War (WW-II) are, in relation to
15
yield, unexpectedly large. At least eight countries are capable of transport and detona-tion of such nuclear devices. Moreover, North Korea appears to have a growing stock-pile of warheads, and Iran is suspiciously pursuing uranium enrichment – a necessary precursor to weapons construction. Thirty-two other countries that do not now have
nu-clear weapons possess sufficient fissionable nuclear materials to construct weapons,
20
some in a relatively short period of time. For these nations, a regional conflict involving modest numbers of 15-kiloton (kt, the TNT explosive yield equivalent) weapons to at-tack cities could cause casualties that exceed, in some cases by orders of magnitude, their losses in previous conflicts. Indeed, in some case, the casualties can rival previ-ous estimates for a limited strategic war between the superpowers involving thprevi-ousands
25
contam-ACPD
6, 11745–11816, 2006Consequences of regional scale nuclear conflicts
O. B. Toon et al.
Title Page
Abstract Introduction
Conclusions References
Tables Figures
◭ ◮
◭ ◮
Back Close
Full Screen / Esc
Printer-friendly Version
Interactive Discussion
inated and effectively uninhabitable. Because of the smoke released in fires ignited
by detonations, there is a possibility that 50 to 100 15-kt weapons used against city centers would produce global climate disturbances unprecedented in recorded human history (Robock et al., 2006). An individual in possession of one of the thousands of existing lightweight nuclear weapons could kill or injure a million people in a terrorist
5
attack.
Below we first discuss the arsenals of the existing, and potential, nuclear powers. We then describe the casualties due to blast and to fires set by thermal radiation from an attack on a single megacity with one low yield nuclear weapon. Next we discuss the casualties if current and projected arsenals of such weapons were ever used in a
10
regional conflict. We then discuss the impact of radioactive contamination. Finally, we describe the amounts of smoke that may be generated in a regional scale conflict. At the end of each of these sections we outline the associated uncertainties.
We have attempted to employ realistic scenarios in this analysis. However, we do not have access to the war plans of any countries, nor to verifiable data on existing
nu-15
clear arsenals, delivery systems, or plans to develop, build or deploy nuclear weapons. There are obviously many possible pathways for regional conflicts to develop. Opin-ions concerning the likelihood of a regional nuclear war range from highly improbable to apocalyptic. Conservatism in such matters requires that a range of plausible sce-narios be considered, given the availability of weapons hardware and the history of
20
regional conflict. In the present analysis, we adopt two potential scenarios: i) a single small nuclear device detonated in a city center by terrorists; and ii) a regional nuclear exchange between two newly minted nuclear weapons states involving a total of 100 low yield (15-kt) detonations. We do not justify these scenarios any further except to note that most citizens and politicians today are aware of the potential disaster of an
25
ACPD
6, 11745–11816, 2006Consequences of regional scale nuclear conflicts
O. B. Toon et al.
Title Page
Abstract Introduction
Conclusions References
Tables Figures
◭ ◮
◭ ◮
Back Close
Full Screen / Esc
Printer-friendly Version
Interactive Discussion
EGU
idea that such scenarios as we propose are executable.
2 Nuclear arsenals
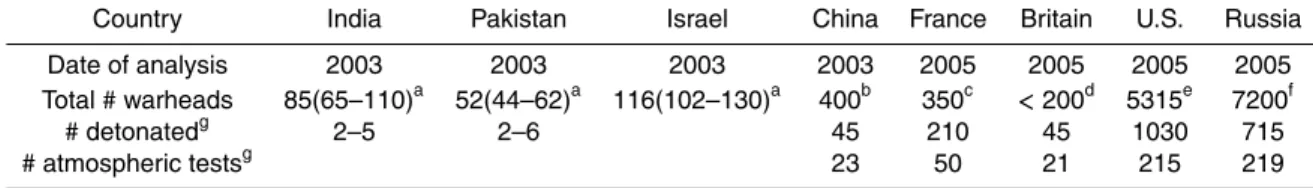
Table 1 lists the world’s known nuclear arsenals. Five countries were recognized as Nuclear Weapons States in the 1968 Treaty on Non-Proliferation of Nuclear Weapons: France, People’s Republic of China, Russia (formerly USSR), United Kingdom and the
5
United States. There are about 30 000 nuclear warheads worldwide, 95% being held by Russia and the U.S. There is enough refined and unrefined nuclear explosive mate-rial in the world to construct another 100 000 weapons (National Academy of Sciences, 2005). No state has revealed the precise number of warheads in its stockpile (National Academy of Sciences, 2005). However, the strategic arsenals of Britain, France,
Rus-10
sia, and the U.S. can be reasonably estimated from treaties that verifiably limit the number and capacity of delivery systems. The U.S. and Russia also have significant stockpiles of strategic warheads in reserve, or in storage, beyond those devoted to cur-rent strategic delivery systems. The numbers of tactical weapons, including mines, ar-tillery shells, depth charges, and bombs are more uncertain; for example, the Russian
15
tactical stockpile is known only to within 5000 devices (National Academy of Sciences, 2005). Figure 1 plots the trends of nuclear warheads (excluding about 10 000 of inde-terminate status in Russia for 2002) during the past several decades. As may be seen the numbers of warheads has declined by roughly a factor of 3 in the past two decades. There are currently three De Facto nuclear weapons states, which have developed
20
weapons outside of the restrictions of the Nuclear Non-Proliferation Treaty: India, Is-rael, and Pakistan. The arsenals of India, Israel and Pakistan (as well as China) are not well documented. The numbers of warheads they control was determined by sev-eral researchers by first estimating the amount of highly enriched uranium (HEU) or of plutonium that could have been produced by each country and allocated to military
25
ACPD
6, 11745–11816, 2006Consequences of regional scale nuclear conflicts
O. B. Toon et al.
Title Page
Abstract Introduction
Conclusions References
Tables Figures
◭ ◮
◭ ◮
Back Close
Full Screen / Esc
Printer-friendly Version
Interactive Discussion
material in military hands may not be assembled into weapons, the numbers in Ta-ble 1 assume it has. We omit possiTa-ble nuclear devices in North Korea, although it is estimated that 10 plutonium weapons in the 10–20 kt range may have been produced (Norris and Kristensen, 2005b).
India and Pakistan conducted nuclear tests in 1998. There are significant differences
5
between the stated yields of the devices in these tests and those estimated from seis-mic studies (Wallace, 1998). However, the yields of some of the devices were similar to the first weapons tested by the U.S., and those dropped on Hiroshima and Nagasaki during WW-II. India claims to have both fusion and fission devices (Norris and Kris-tensen, 2005d). It has been suggested that India may attempt to build nuclear parity
10
with France, Britain, and China in the next 5–7 years by constructing 300–400 war-heads deployed on a triad of delivery systems (missile, aircraft, and submarine) (Norris and Kristensen, 2005d).
Several countries possessed nuclear weapons in the past, but abandoned them. South Africa constructed six devices, which they destroyed, possibly after one
nu-15
clear test (Albright et al., 1997). Belarus, Ukraine, and Kazakhstan inherited nuclear weapons with the fall of the Soviet Union, but have transferred them to Russia.
As summarized in Table 2, there are a large number of countries that possess the raw materials needed to construct nuclear weapons, mainly in their civilian nuclear reactor programs. Altogether, 45 nations are identified in Table 2 as having previous
20
nuclear weapons programs, current weapons stockpiles, or the potential to become nu-clear states. Thirteen countries operate plutonium and/or uranium enrichment facilities,
including Iran. Obtaining fissionable material, the most difficult step in constructing a
weapon, is as straightforward as operating a civilian power reactor system in tandem with a Pu reprocessing facility of appropriate sophistication. All of the necessary
tech-25
ACPD
6, 11745–11816, 2006Consequences of regional scale nuclear conflicts
O. B. Toon et al.
Title Page
Abstract Introduction
Conclusions References
Tables Figures
◭ ◮
◭ ◮
Back Close
Full Screen / Esc
Printer-friendly Version
Interactive Discussion
EGU
programs to develop nuclear weapons, notably Argentina, Brazil, North Korea, South Korea, and Taiwan (Albright et al., 1997). In 1992 the International Atomic Energy Agency safeguarded less than 1% of the world’s HEU and only about 35% of the world inventory of Pu (Albright et al., 1997). Today a similarly small fraction is safeguarded.
The possible number of nuclear devices in Table 2 that could be constructed from
5
existing inventories of Pu and HEU in various countries ranges from one to tens of thousands. We assumed in constructing Table 2, that 10 kg of Pu is needed for each warhead, but we did not distinguish Pu that has been separated from fuel rods from that which has not been separated, and we did not distinguish Pu which is enriched in
the favored isotope,239Pu. Weapons constructed by the U.S. and Russia are thought
10
to contain about 3–4 kg of Pu; it has also been suggested that Indian weapons av-erage 5 kg of Pu. For HEU, 25 kg per device was assumed to derive Table 2. HEU
exists in various states of enrichment of235U, and we do not specifically distinguish
weapons-grade material. However, once uranium is enriched to the level of HEU, most of the work needed to achieve weapons grade has already been done, and HEU itself
15
can be used in weapons. There are 8 current states with nuclear weapons, 1 (North Korea) constructing weapons and one (Iran) believed to be actively seeking such de-vices. Another 32 states possess fissionable material from which weapons could be produced.
Many nuclear weapons are small in size and light in weight and could easily be
trans-20
ported in a car or van. The weapons dropped on Hiroshima and Nagasaki weighed 4040 kg and 4900 kg respectively (Gibson, 1996). Subsequent designs have reduced warhead weight-per-yield and size substantially. For example, 300 of the
Intercontinen-tal Ballistic Missile warheads in the U.S. arsenal weigh only ∼100 kg each, while the
remaining 850 warheads weigh less than 300 kg each (Gibson, 1996). U.S.
submarine-25
based weapons are similarly light in weight. The U.S. also has about 480 non-strategic B61 bombs deployed in six European countries, with yields of 100–500 kt and weights
of∼300 kg (Gibson, 1996). The U.S. produced (and retired) 2000 W33 artillery shells,
ACPD
6, 11745–11816, 2006Consequences of regional scale nuclear conflicts
O. B. Toon et al.
Title Page
Abstract Introduction
Conclusions References
Tables Figures
◭ ◮
◭ ◮
Back Close
Full Screen / Esc
Printer-friendly Version
Interactive Discussion
1996).
The number of nuclear weapons owned by various nations, how many could be suc-cessfully delivered, and where they would be delivered are the major uncertainties in the present analysis. As pointed out by the National Academy of Sciences (2005) and Albright et al. (1997) better estimates of the numbers of weapons will only be obtained
5
if nations agree to disclose such information. As discussed below there are many sce-narios for how wars might be fought. In this paper we have focused on the delivery of about 50 low yield warheads on urban centers, because that is a rough estimate of the numbers currently existing in the smallest known nuclear arsenals (Table 1). One may argue that the smallest nuclear states currently are not capable of delivering even 50
10
low yield weapons. However, history shows that once states develop nuclear weapons, they continue to develop more of them, with higher yields. Our idealized study involves about 0.3% of the world’s arsenal by number and only 0.03% by yield. If regional nu-clear arms races continue to develop, the numbers of weapons and their yields can easily exceed the examples we discuss here.
15
3 Potential fatalities from a Hiroshima-sized explosion in a major city
To compute the number of fatalities or casualties from a nuclear detonation,N, we use
Eq. (1).
Nfatalities/casualties= 2π
Z
0
R
Z
0
rP(r, θ)α(r)d θdr (1)
The integral is numerically evaluated over sectors of a city in which the population
20
density,P, varies in space. The probability of fatality or casualty,α depends on r, the
distance from the detonation point, or “ground zero.” R is the maximum distance from
ground zero for which the product ofP andα yields more than one fatality or casualty
ACPD
6, 11745–11816, 2006Consequences of regional scale nuclear conflicts
O. B. Toon et al.
Title Page
Abstract Introduction
Conclusions References
Tables Figures
◭ ◮
◭ ◮
Back Close
Full Screen / Esc
Printer-friendly Version
Interactive Discussion
EGU
the degree of exposure of the population, the time of day, weather, topography, and
numerous other factors. However, we assumeαonly depends on distance from ground
zero.
Nuclear weapons cause direct destruction, death and injuries mainly through the ef-fects of prompt energetic gamma and neutron radiation, blast overpressure and winds,
5
and thermal radiance from the fireball (thermal pulse). (The subsequent effects of
exposure to radioactive fallout are discussed in Sect. 5). While there have been at-tempts to estimate damage and casualties associated with nuclear detonations of vari-ous yields on the basis of the physical perturbations, there are numervari-ous uncertainties in making such projections. However, for the scenarios considered in this work the
10
explosive yields correspond to those of the Hiroshima and Nagasaki atomic bombs, for which considerable data have been collected documenting deaths and injuries. While the detailed vulnerability of individuals in modern megacities is likely to be significantly
different from that at Hiroshima and Nagasaki, we propose that the overall casualty
probabilities should be similar to first-order, particularly in the central zone of heavy
de-15
struction where most deaths occur. Accordingly, for the purpose of assessing potential fatalities in a future nuclear conflict or terrorist attack, we will rely on the outcomes of the atomic bombing of Japan in World War II.
Figure 2 shows the Hiroshima and Nagasaki fatality rates from two independent studies (Oughterson and Warren, 1956; Ishikawa and Swain, 1981). The fraction of
20
people killed within Hiroshima and Nagasaki is similar, despite the fact that the energy
released by the weapon dropped at Hiroshima was 15±3 kt, while that at Nagasaki
was 21±2 kt. The relatively higher rate of death in Hiroshima is probably due to the
geography of the city. Nagasaki has more hills that shadowed areas from the blast and thermal radiation. The firestorm in Hiroshima was also more violent due to the dry
25
ACPD
6, 11745–11816, 2006Consequences of regional scale nuclear conflicts
O. B. Toon et al.
Title Page
Abstract Introduction
Conclusions References
Tables Figures
◭ ◮
◭ ◮
Back Close
Full Screen / Esc
Printer-friendly Version
Interactive Discussion
injuries that are not immediately life-threatening but could become disabling.
We have fit normal distributions to the probability data in Figs. 2 and 3 using a
stan-dard form: α(r)=exp(−r2/2σ2). Here,α is the relative probability of fatalities or
casu-alties at a given range,r, from ground zero, andσ is the effective scaling distance, or
distribution width, for the effects of interest. Values ofσderived from the data in Figs. 2
5
and 3 are summarized in Table 3. We used the data from Ishikawa and Swain (1981) to calibrate the casualty distributions because these data refer to the period a year following the explosions when the most serious injuries would have been resolved,
and outcomes at each level of effect would be clear. The derived distributions may,
nonetheless, represent a conservative estimate of fatalities in the sense that medical
10
attention following the Japanese wartime atomic bombing may have been more acces-sible than would be the case following an attack on a modern megacity, especially in the developing world.
The Hiroshima and Nagasaki explosions were airbursts. For a ground burst of the same yield, the thermal radiation at a given intensity covers only about 50% of the area
15
of an airburst, because the fractional conversion of yield to radiant energy changes from 0.35 for an airburst to 0.18 for a ground burst (Glasstone and Dolan, 1977). In
addition, the areas affected by overpressure also vary between air and ground bursts.
For example, the area within the 10 pound-per-square-inch (psi) contour for a ground burst is about 50% of that for an airburst, while the area within the 2 psi contour for
20
a ground burst is about 38% of that for an airburst (Glasstone and Dolan, 1977). To adjust the probability curves for computing fatalities and casualties from ground bursts,
we divide the appropriateσ in Table 3 by a factor of√2. This effectively reduces the
impacted area by 50% relative to an airburst of the same yield, roughly compensating
for the reduced range of both overpressure and thermal radiation effects.
25
ACPD
6, 11745–11816, 2006Consequences of regional scale nuclear conflicts
O. B. Toon et al.
Title Page
Abstract Introduction
Conclusions References
Tables Figures
◭ ◮
◭ ◮
Back Close
Full Screen / Esc
Printer-friendly Version
Interactive Discussion
EGU
data base (LandScan, 2003). The LandScan data base provides the 24-h average ambient population. We then chose the most populated of these regions subject to the constraint that the central cell was separated by at least 6 km from the center cell of the nearest alternative high population density group of cells. The population data
are aggregated into cells that are 30 arc-seconds on a side – an area less than 1 km2
5
at the latitudes of interest. In these calculations, we did not consider the accumulated casualties from multiple bursts in overlap zones within 3 km of ground zero. In practice, for the most densely populated regions, fatalities from the blast and thermal radiation of a 15-kt explosion do not occur beyond about 5 km from ground zero, and minor injuries do not occur beyond about 9 km.
10
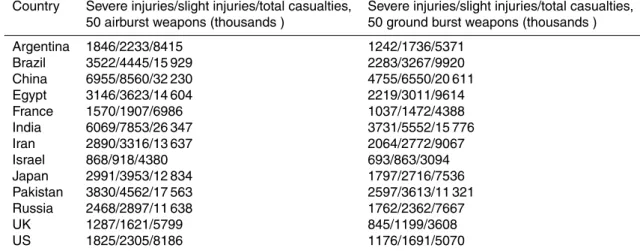
Table 4 presents fatalities and Table 5 casualties for airbursts exploded at “optimum” height over the most densely populated, and second most densely populated, regions in a number of countries, as well as for a ground burst in the most densely populated re-gion. These results could represent the consequences of a terrorist attack, or a limited
nuclear strike or retaliation. Note that the casualties from the direct effects alone using
15
one weapon can number more than one million even though these scenarios assume low yield weapons. Compared to airbursts, explosions at the ground produce compa-rable, but somewhat lower, total fatalities – including deaths attributable to radioactive fallout as discussed below. Several previous researchers have investigated casualties in individual cities; for example McKinzie et al. (2001) use an approach similar to ours
20
for Pakistan and India.
The number of fatalities during WW-II in Hiroshima has been estimated at
140 000±10 000, and in Nagasaki, 70 000±10 000 (Ishikawa and Swain, 1981).
Mod-ern megacities have higher population densities than Hiroshima and Nagasaki, and
consequently would suffer greater fatalities, as indicated in Table 4. Historical wars
25
ACPD
6, 11745–11816, 2006Consequences of regional scale nuclear conflicts
O. B. Toon et al.
Title Page
Abstract Introduction
Conclusions References
Tables Figures
◭ ◮
◭ ◮
Back Close
Full Screen / Esc
Printer-friendly Version
Interactive Discussion
There are numerous uncertainties in computing fatalities and casualties. We believe that the uncertainties in our analysis, such as using the casualty probability curves from Hiroshima, and using the LandScan population database, are relatively small. The greatest uncertainty, as noted in the introduction, is likely to lie in the targeting of the weapons. For example, the populations of some urban areas vary greatly between
5
day and night due to commuting patterns. Hence, casualties will depend on the time of day of the attack. The LandScan data base defines a 24-h average population density, which therefore lies between the extreme possibilities. Casualties will also depend upon whether the urban areas have been evacuated in advance of the attack or whether bomb shelters exist. We have assumed there has been no evacuation,
10
or effective use of shelters. Firstly, urgent evacuation of megacities has never been
successfully attempted. Moreover, few of these cities have nuclear-capable shelters in any number. While some modern buildings are better designed to survive shock waves, and are less likely to ignite, we have implicitly assumed that all buildings would respond like those in Hiroshima during World War II. Some cities may have complex
15
topography that may provide partial sheltering as in Nagasaki. As discussed in Sect. 4 some targets have several times higher populations densities and will therefore have higher fatalities than others. In this section of the paper we chose an example based on
attacks on the most densely populated areas in each country. The effects of choosing
alternative urban targets is discussed in Sect. 4.
20
4 Potential direct casualties in a regional war
Several groups, considering a range of exchange scenarios, estimated the direct casu-alties in a full-scale nuclear war prior to the collapse of the Soviet Union and the easing of tensions between the larger nuclear powers. Tens of thousands of weapons were available in the 1980s with most in the 100 kt to Mt yield range. Varying assumptions
25
about targeting of the weapons, and the number of weapons used led to casualty
ACPD
6, 11745–11816, 2006Consequences of regional scale nuclear conflicts
O. B. Toon et al.
Title Page
Abstract Introduction
Conclusions References
Tables Figures
◭ ◮
◭ ◮
Back Close
Full Screen / Esc
Printer-friendly Version
Interactive Discussion
EGU
casualty estimates is the scaling of casualty probabilities from low yield weapons, such as the one used in Hiroshima, to high yield weapons. Most researchers use blast dam-age to scale casualty probabilities. Others have used fire potential, which leads to a greater damage area and generally higher casualty figures by factors of 2.5–4 (Postol, 1986).
5
At the high end of casualty projections, theAmbiostudy (Middleton, 1982) assumed
14 747 detonations (173 in the Southern Hemisphere) totaling 5569 Mt. Although, as Table 1 indicates, such a conflict could still be fought today, many of the warheads
would need to be taken from storage. TheAmbioanalysis assumed weapons exploded
over nearly every city of modest size in the world (most of Africa, South America, and
10
New Zealand were spared). Of the 1 300 000 000 people then living in urban areas of the Northern Hemisphere, it was estimated that 750 000 000 would die immediately, 340 000 000 would be seriously injured – and of those 200 000 000 would perish soon there after. Harwell (1984) considered an attack confined to the U.S. involving more than 3000 weapons and 1400 Mt yield, and found that 50 000 000–100 000 000 people
15
might die from blast, thermal radiation, and fires. OTA (1979) summarized several U.S. government studies of a range of scenarios, including a full-scale attack on the U.S. against military and economic targets involving thousands of weapons releasing thousands of megatons of explosive energy. They suggested that casualties, primarily due to blast, would lie in the range of 20 000 000–160 000 000 people. The range of
20
casualties was largely due to assumptions about evacuations of urban areas, and use of shelters. They also examined a “counterforce attack,” in which military facilities were attacked while U.S. urban centers were not directly targeted. In this case, fatalities, due largely to fallout, were estimated to be 2 000 000–20 000 000 people. Daugherty et al. (1986) pointed out that many strategic targets lie near population centers. They
25
ACPD
6, 11745–11816, 2006Consequences of regional scale nuclear conflicts
O. B. Toon et al.
Title Page
Abstract Introduction
Conclusions References
Tables Figures
◭ ◮
◭ ◮
Back Close
Full Screen / Esc
Printer-friendly Version
Interactive Discussion
While the use of thousands of high-yield weapons would certainly lead to more ca-sualties than might occur in a small attack or exchange with low-yield weapons, we find that the number of casualties is not reduced in proportion to the total yield. For exam-ple, even today Russia and the U.S. maintain much larger arsenals than are needed to strike all significant military targets as well as every moderate to large city in the world.
5
Many weapons are aimed at the same target, or aimed at missile silos or submarines in unpopulated regions. For high-yield weapons in the Mt range, much of the area inside the destruction zone would be sparsely populated- even in large cities- as the popula-tion density decreases rapidly toward the perimeter. Therefore, based on the present results, relatively small numbers of low yield weapons targeted at densely populated
10
urban centers may lead to similar casualties as in a full-scale counterforce war.
In our computations we have assumed that the densest population centers in each country are targeted. Scenarios that purposefully target population centers with nu-clear weapons, at least in the case of escalating military hostilities between nations, might be challenged on several grounds. For one thing, such an act would invite
re-15
taliation in kind. Further, military facilities, and especially the nuclear assets of an adversary, would seem to be the targets of choice in an actual wartime situation. On the other hand, rapid-fire, intense urban targeting would inflict the greatest damage on an adversary nation. Combined with military bombardment, urban targeting, con-stitutes an all-out engagement aimed at permanently crippling an opponent. In that
20
sense, the “small” war scenarios assumed here are similar in principal, if not in scale, to the strategies of all-out nuclear warfare and warfighting embraced by the superpow-ers in the mid-20th century in the context of “mutually assured destruction.” It is also possible that a country that does not have enough weapons to target the entire military
infrastructure of an opponent to prevent effective retaliation may target urban areas to
25
ACPD
6, 11745–11816, 2006Consequences of regional scale nuclear conflicts
O. B. Toon et al.
Title Page
Abstract Introduction
Conclusions References
Tables Figures
◭ ◮
◭ ◮
Back Close
Full Screen / Esc
Printer-friendly Version
Interactive Discussion
EGU
Below we consider a nuclear war in which 50 weapons of 15 kt yield are detonated on two opposing nations. The total yield in this case is 1.5 Mt, roughly 0.1% or less of the total yields proposed in previous scenarios for a full-scale nuclear war as dis-cussed above. Such a scenario is consistent with the potential arsenals of the smallest recognized nuclear powers, India and Pakistan. One may argue that this scenario is
5
currently implausible because India and Pakistan would need to have their entire arse-nals assembled, and a high success rate of delivery to cause 50 nuclear explosions in each territory. However, other nuclear powers have many more weapons and sophisti-cated delivery systems and could launch such an attack. Moreover, once states begin to assemble nuclear weapons they tend to continue to build their arsenals. For
exam-10
ple, India may be moving toward an arsenal comparable to that of China, Britain and France (Norris and Kristensen, 2005d). North Korea has reactors, which if completed and made fully operational, could produce enough fissionable material to produce 50 warheads per year (Norris and Kristensen, 2005b). Whether Pakistan is planning such a reactor is uncertain, but India has recently signed a treaty with the U.S. allowing
15
the continued, and unmonitored, production of fissionable materials. Numerous coun-tries listed in Table 2 have the uranium and/or plutonium to make very large numbers of weapons. Hence we consider an attack involving two countries using 50 low-yield weapons to be within the range of the smallest nuclear powers today, and potentially attainable by many countries in the near future.
20
Tables 6 and 7 present our estimates of the fatalities and casualties due to targeting 50 15-kt weapons on the leading population centers in a number of countries. The total fatalities in Table 6 range from 2 600 000–16 700 000. An attack on India, for example, would lead to many more fatalities than a similar attack on Pakistan because of India’s greater number of large population centers.
25
ACPD
6, 11745–11816, 2006Consequences of regional scale nuclear conflicts
O. B. Toon et al.
Title Page
Abstract Introduction
Conclusions References
Tables Figures
◭ ◮
◭ ◮
Back Close
Full Screen / Esc
Printer-friendly Version
Interactive Discussion
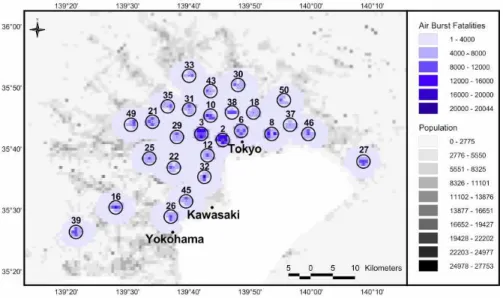
fatalities occur in a single megacity in our scenario, as summarized in Fig. 5.
Figure 6 shows that fatalities are relatively uniformly spread over the 50 targets in most countries, so that fatalities are not strongly dependent on the details of the choice of targets. For instance, in India and for China, 19 explosions account for roughly half the total airburst fatalities from a 50 weapon attack.
5
The fatalities in Table 6 for a 50-weapon attack on the United States are compara-ble to those previously estimated for a limited or counterforce attack involving 3000
weapons and 1300 Mt (OTA, 1979; Daugherty et al., 1986). Scaled against total
weapon yield, the fatalities per kiloton are 100 times greater in the small weapon sce-nario, even when full scale urban targeting has been considered in past scenarios
10
(Harwell, 1984). The high fatality rate of low yield weapons is not due to any non-linear phenomena. Rather, the low fatality per kiloton for large yield weapons results from many weapons being targeted at areas with relatively low population density, in-cluding the suburbs of urban areas and isolated military targets, and weapons being redundantly targeted with respect to overlapping overpressure contours. Table 6 also
15
shows that a regional exchange between India and Pakistan, in which each side used 50 weapons, could lead to more than 21 million fatalities, which is equivalent to about half of the global fatalities in WW-II. Only a small number of weapons are needed to produce the same fatalities in a given country as occurred among that country’s citi-zens during WW-II, or in other major historical wars. For example, three weapons of
20
15-kt yield exploding in the U.S. could lead to more U.S. fatalities than occurred during all of WW-II.
The uncertainties discussed for individual targets in Sect. 3 also apply to a regional scale war. Generally we believe the greatest uncertainties have to do with targeting issues, such as the time of day of the attack and whether cities have been evacuated
25
ACPD
6, 11745–11816, 2006Consequences of regional scale nuclear conflicts
O. B. Toon et al.
Title Page
Abstract Introduction
Conclusions References
Tables Figures
◭ ◮
◭ ◮
Back Close
Full Screen / Esc
Printer-friendly Version
Interactive Discussion
EGU
5 Radioactive fallout
In previous calculations for a full-scale nuclear war, radioactive fallout was a significant source of fatalities. For example, Harwell (1984) predicted about 25% of the United States land area would be exposed to a long-term fatal dose of radiation, resulting
in 50 000 000 to 70 000 000 fatalities in addition to those due to direct effects such
5
as blast. The radioactivity is primarily associated with surface explosions, which are typically used to attack “hardened” or buried military targets, such as missile silos. However, surface bursts generally cause fewer blast or fire fatalities. Harwell (1984), for example, found that when all of the urban explosions were surface bursts, the total number of fatalities was actually reduced by 10 000 000.
10
There have been numerous studies of early radioactive fallout from nuclear surface bursts, and potential exposure to energetic radiation, especially gamma rays, emit-ted by the residual radionuclides. Early fallout consists of the dust-borne radioactive byproducts deposited on the ground during the first day or so after a nuclear surface explosion. Surface bursts raise large amounts of dust, which carries most of the
short-15
lived radioactive isotopes released in fission detonations. Subsequent fallout patterns depend on the dust particle size distribution, height of the stabilized debris cloud, and local weather, among other factors. Airbursts generally are assumed to produce no early fallout unless it is raining, as discussed below. In general, most of the lethal fallout from a small surface burst (e.g., 15 kt) is deposited within one to two hours of
20
detonation, and within several tens of kilometers of ground zero. Moreover, the threat of fallout exposure within 2–3 km of such a burst is secondary to the hazards associated with prompt radiation (emitted at the time of detonation), blast, and thermal radiation.
Since these latter effects are directly accounted for by the casualty curves discussed
above, we will not be concerned here with detailed modeling of the fallout closer than
25
one or two kilometers to ground zero (although the model discussed below will roughly account for this fallout).
ACPD
6, 11745–11816, 2006Consequences of regional scale nuclear conflicts
O. B. Toon et al.
Title Page
Abstract Introduction
Conclusions References
Tables Figures
◭ ◮
◭ ◮
Back Close
Full Screen / Esc
Printer-friendly Version
Interactive Discussion
wind speed, rainfall and dust particle size that cannot be determined in advance, we utilize the simplified fallout model documented by Glasstone and Dolan (1977) to com-pute areas subject to given exposure levels downwind of a surface contact burst.
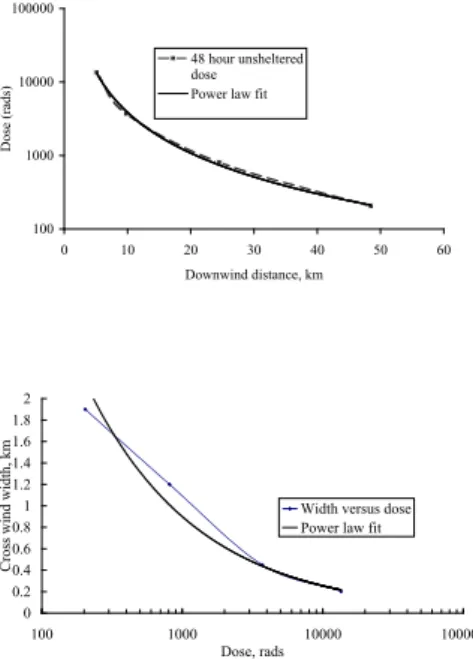
In applying the model, Table 9.93 and Fig. 9.26 of Glasstone and Dolan (1977) are used to characterize the dose rate, and integrated dose, downwind of a 15-kt fission
5
ground burst. The results are summarized in Fig. 7 in terms of the potential external gamma ray dose that would be received after 48 h of continuous exposure over a per-fectly flat surface as a function of distance from the detonation. The derived doses must be corrected for terrain and sheltering as discussed below. Typically, 50–60% of the total fission radioactivity produced by a surface burst is deposited as early fallout,
10
and this factor is incorporated in the model (Glasstone and Dolan, 1977; Shapiro et al., 1986).
The model (Glasstone and Dolan, 1977) assumes there is a steady 24-km/h wind with minimal wind shear. We take the wind to blow directly toward the east, as pre-vailing westerlies. The delay in fallout exposure associated with transport from the
15
detonation point is accounted for by estimating the arrival time using the derived dis-tance and known wind speed. The fallout radiation dose rate decays in proportion to
t−1.2, with time, t, measured in appropriate units (Glasstone and Dolan, 1977). Given
an arrival time, and an exposure interval of 2 days, a dose rate “multiplying factor” can be obtained by time integration of the dose rate. The actual 48-h dose is then the
20
product of the reference time dose rate and the multiplying factor.
Figure 7a shows the potential maximum 48-h whole-body dose as a function of downwind distance from a 15-kt burst. Figure 7b gives the ground zero crosswind width of the contour delimiting that dose. The data in Figs. 7a and 7b have been fit with power law functions for convenience in our analysis. The 48-h unsheltered exposure at
25
each distance directly downwind of a surface detonation can be reasonably estimated using the relation,
ACPD
6, 11745–11816, 2006Consequences of regional scale nuclear conflicts
O. B. Toon et al.
Title Page
Abstract Introduction
Conclusions References
Tables Figures
◭ ◮
◭ ◮
Back Close
Full Screen / Esc
Printer-friendly Version
Interactive Discussion
EGU
where D is the integrated dose in rad, and L is the distance from ground zero in km. Note that Eq. (2) can be inverted to give the maximum downwind extent for any specific dose, D. The simplified model of Glasstone and Dolan (1977) also predicts that, for a 15-kt fission explosion, the width of the dose contour is nearly independent of the range from the detonation point. Hence, we further assume that for a particular dose,
5
the contour width, W (km), remains constant over the range given by Eq. (2). The fit in Fig. 7b gives this width as,
W =40.D0.5486. (3)
Based on the assumptions stated above, the derived exposure footprints for early fallout from a 15-kt surface burst consist of rectangular areas, LxW, defined through
10
Eqs. (2) and (3), that extend to the east of the burst point.
For the scenarios considered here, the population grid cells are generally compa-rable to or larger in width than the exposure contours that fall within the lethal range. Moreover, in multiple burst scenarios, the dose contours often overlap. In cases where
we must estimate the affected population in sub-grid areas, we assume a uniform
pop-15
ulation density within affected grid cells, so that the exposed population is directly
proportional to the fractional area. We also sum exposures from overlapping explo-sion contours. Figure 8a, for example, illustrates the 48-h exposures predicted for unsheltered individuals in the Tokyo-Yokohama megacity complex corresponding to a 50-weapon attack on Japan. Note that there are many areas where a number of
fall-20
out patterns overlap in such an attack, and the total exposure consists of the additive component exposures.
Following Daugherty et al. (1986), we assume that 50% of the population will have a
sheltering factor of 3, and 50% a sheltering factor of 10. Hence, the true exposure, D′
is, D′=D/3 or D/10. The response of a population to a given acute (48-h) dose of
whole-25
ACPD
6, 11745–11816, 2006Consequences of regional scale nuclear conflicts
O. B. Toon et al.
Title Page
Abstract Introduction
Conclusions References
Tables Figures
◭ ◮
◭ ◮
Back Close
Full Screen / Esc
Printer-friendly Version
Interactive Discussion
Daugherty et al. (1986), that the fatality curve is linear with dose, and that the fatality rate would be 100% at 600 rad, and 0% at 300 rad. Then the fraction of fatalities for a given acute exposure (above 300 rad) is:
αradiationfatality=(D′−300)/300; 0< α <1 (4)
The doses used in Eq. (4) are those modified for the effects of sheltering. Hence, the
5
unsheltered dose rate that represents the threshold for lethality (from fallout alone) is
900 rad for 50% of the affected population, and 3000 rad for the other 50%.
Given these parameters the fallout from a 15-kt ground burst could be lethal to all the survivors of blast and fire within a zone extending roughly 8 km downwind, and 0.35 km wide. At distances greater than about 22 km from ground zero, there would
10
be few fallout fatalities, although radiation sickness would affect a substantial number
of individuals exposed to radiation at 100–300 rad (with effects potentially exacerbated
by other stresses, and the absence of an organized medical response). Between the epicenter of the explosion and 22 km, there would be zones of varying widths in which
a fraction of the population suffers lethal exposure. For example, the dark purple areas
15
illustrated in Fig. 8b for the Tokyo-Yokohama megacity attack scenario would be subject to numerous early fallout casualties.
There has been limited consideration in the literature of the effects of rainfall on
radioactive fallout (Glasstone and Dolan, 1977). This is due in part to the fact that most high-yield weapons rise and stabilize in the atmosphere well above the region
20
where rainfall develops. However, the stabilized height of a 15-kt airburst debris cloud is around 6000 m, which is within the middle troposphere (Glasstone and Dolan, 1977). The top of the Nagasaki mushroom cloud was estimated to be 4000–5000 m, with a base near 1200–1300 m (Ishikawa and Swain, 1981). It follows that a 15-kt yield device initially deposits its radioactivity in the middle to lower troposphere. In this case, rapid
25
removal is likely if the atmosphere is unstable and rainfall is occurring in the region. For this reason, atmospheric nuclear tests were detonated in remote locations, in part to
ACPD
6, 11745–11816, 2006Consequences of regional scale nuclear conflicts
O. B. Toon et al.
Title Page
Abstract Introduction
Conclusions References
Tables Figures
◭ ◮
◭ ◮
Back Close
Full Screen / Esc
Printer-friendly Version
Interactive Discussion
EGU
radioactive debris from the plume of an airburst at the same rate as dry sedimentation removes radioactivity from a ground-burst cloud. Moreover, rainfall could potentially deposit twice as much radioactivity locally following an airburst as a ground burst in dry weather, since in the latter case only about half the radioactivity is in the form of particles large enough to be deposited as early fallout.
5
For the scenarios considered here, Tables 4 and 6 provide estimates of the fatalities due to the early fallout from single and multiple ground bursts without rainfall. While the radiation casualties are substantial in the cases treated, the total of blast, fire and radiation fatalities for ground bursts are found to be somewhat lower in general than the direct fatalities of an airburst of equivalent yield. Rainfall has the potential to increase
10
radiation fatalities significantly.
Delayed, as opposed to early, radioactive fallout generally occurs within the first day or two after a nuclear explosion, and far downwind of ground zero. Global-scale fallout is associated mainly with high yield weapons whose radioactivity is deposited initially in the stratosphere, and is then slowly removed over the globe. Intermediate fallout is
15
associated with radioactive debris that remains trapped in the troposphere, and which is deposited regionally. About 500 nuclear weapons were exploded in the atmosphere worldwide prior to the nuclear test ban treaty, with a total yield expended of more than 400 Mt. Of greater relevance here, 100 airburst weapons with an average yield of 10 kt were detonated over the Nevada test site (NTS). About 61 of these devices
20
had a high enough yield to produce measurable radioactivity beyond the NTS (Bouville et al., 2002). The tests were deliberately conducted in locally dry conditions, so that the debris would remain aloft as long as possible, decaying and dispersing before returning to the surface. Occasionally hot spots, such as in northern New York State, occurred as a result of rainfall scavenging. In the U.S., the overall cumulative external
25
population exposure associated with the 100 small weapons exploded at the NTS was comparable to that connected with the global fallout from the 400 Mt of large weapon
tests (Bouville et al., 2002). The smaller bursts were more effective per unit fission
ACPD
6, 11745–11816, 2006Consequences of regional scale nuclear conflicts
O. B. Toon et al.
Title Page
Abstract Introduction
Conclusions References
Tables Figures
◭ ◮
◭ ◮
Back Close
Full Screen / Esc
Printer-friendly Version
Interactive Discussion
(Bouville et al., 2002). The radioactive debris from the larger weapons was injected into the stratosphere, where it decayed significantly before reaching the ground. In counties downwind of the NTS, average exposures of the order of 300 mrad have been estimated (Bouville et al., 2002), which is comparable to the average annual radiation dose from natural radioactivity.
5
In a regional-scale nuclear war, radiation doses over large areas would most likely exceed doses experienced during the NTS series. For one thing, the detonations would occur simultaneously rather than over a decade of time, and would be deposited in the same restricted area. Moreover, local rainfall is more probable in the regions con-sidered here, and could significantly exacerbate the local and regional deposition of
10
radioactivity. The fallout simulation illustrated in Fig. 8a shows, for example, that most of the greater Tokyo area, and extending more than 100 km downwind, is subject to unprotected 48-h doses of 50 to 200 rad. In the same zone, the cumulative dose be-tween 1 day and six months would be roughly half the values for 48-h – still a very substantial exposure equivalent to perhaps a thousand times background. Under such
15
circumstances, it is likely that only a small fraction of the population would remain within the urban complex, being limited mainly to those directly engaged in disaster relief and civil defense activities.
The unorganized evacuation of 10’s of millions of people over days and weeks from a megacity complex would most probably be chaotic and lead to many additional deaths
20
and injuries. The economic impacts of abandonment of a major center of commerce would have national and international dimensions. Individuals would be unlikely to re-turn to such a site for years, and in many cases would seek to relocate permanently. Lessons in this regard are found in recent natural disasters such as the Indonesian tsunami of 2004 and hurricane Katrina in 2005. Although both of these disasters were
25
limited to coastal areas, the longer-term consequences have had much farther reach. Six months after the Katrina event, for example, the U.S. had spent tens of billions of
dollars on relief and rebuilding efforts but had hardly progressed in making the city of
ACPD
6, 11745–11816, 2006Consequences of regional scale nuclear conflicts
O. B. Toon et al.
Title Page
Abstract Introduction
Conclusions References
Tables Figures
◭ ◮
◭ ◮
Back Close
Full Screen / Esc
Printer-friendly Version
Interactive Discussion
EGU
we did not extend our casualty and damage predictions to include potential medical, social or economic impacts following the initial explosions, such analyses have been performed in the past for large-scale nuclear war scenarios (Harwell and Hutchinson, 1989). Such a study should be carried out as well for the present scenarios and physi-cal outcomes.
5
While regional and global fallout are not likely to cause substantial fatalities follow-ing a war between states with small arsenals (Glasstone and Dolan, 1977), it is much more likely that large urban areas around target points would be permanently aban-doned, especially following ground bursts–or airbursts under rainy conditions. A nu-clear explosion releases many short and long-lived radionuclides, amounting to roughly
10
30 000 MCi per kiloton of fission yield at one minute after detonation (Glasstone and Dolan, 1977). Thus, the evacuation of large regions would be necessary immediately after a nearby surface burst. However, the deposition of long-lived radioisotopes, as occurred after the Chernobyl nuclear reactor accident in April 1986, would make early recovery and re-colonization untenable in contaminated zones. Chernobyl released
15
about 2.5 MCi of137Cs and 0.27 MCi of90Sr, (Nuclear Energy Agency, 2002). In
con-trast, 50 nuclear explosions of 15 kt fission yield would be expected to release about
0.2 MCi of137Cs and 0.14 MCi of 90Sr, both with half-lives close to 30 yr. Notably, the
local deposition following Chernobyl was attenuated owing to the small particle sizes re-leased by the reactor, and most of the activity dissipated over long distances, whereas
20
early radioactive fallout would concentrate activity locally. Nevertheless, shortly after
the Chernobyl accident, a region of 2800 km2was evacuated, which exceeds the total
area affected by blast in the nuclear scenarios considered here. Several other
radioac-tive “hotspots” were located within a few hundred kilometers of Chernobyl where
rain-fall deposition occurred. In total, 3100 km2was contaminated by137Cs at levels above
25
40 Ci/km2, 7000 km2at levels between 16 and 40 Ci/km2, and 103 000 km2 between 1
and 5 Ci/km2(Nuclear Energy Agency, 2002). Eventually the Soviet Union adopted a
ground-contamination upper-limit of 40 Ci/km2 of137Cs for permanent resettlement of
ACPD
6, 11745–11816, 2006Consequences of regional scale nuclear conflicts
O. B. Toon et al.
Title Page
Abstract Introduction
Conclusions References
Tables Figures
◭ ◮
◭ ◮
Back Close
Full Screen / Esc
Printer-friendly Version
Interactive Discussion
of contaminated food remains strictly controlled; the 193 000 people living here in 1995 received an annual dose below 500 mrads (where 300 mrads is the average annual dose received from natural background radioactivity) (Nuclear Energy Agency, 2002).
Sixteen years after the accident, 4000 km2 of agricultural land remained abandoned,
including the entire area within 30 km of the reactor. Following the attack scenarios
5
considered here, slightly smaller total areas might be abandoned or strictly controlled, but these areas would be within, or adjacent to, current megacity centers. Accordingly,
the population and economic assets affected would dwarf the Chernobyl values.
The uncertainty in computing the radioactivity deposited from the explosion of 50 weapons with 15 kt yield lies in variables such as the local wind speed, and whether it
10
was raining during the explosion. However, the greatest uncertainty is due to targeting issues, such as whether ground bursts are used. Fatalities due to fallout exposure depend on how well sheltered the population is, and how quickly it can evacuate the region.
6 Smoke emissions
15
During the early 1980s, numerous investigations of smoke emissions from burning cities suggested that significant global-scale climate changes might occur following a nuclear war (Alexandrov and Stenchikov, 1983; Turco et al., 1983; Pittock et al., 1989; Turco et al, 1990). Climate changes could impact non-combatant countries worldwide, and potentially lead to significant global casualties. At that time, significant climate
20
effects were expected from 100 high yield weapons being used on 100 cities, but given
the large numbers of weapons then available such a scenario did not seem likely. Here we estimate the smoke generated from 100 low yield weapons being used on 100 targets, many of which may be co-located in a single megacity. Robock et al. (2006) evaluate the climate changes that may occur from this estimated smoke release.
25
ACPD
6, 11745–11816, 2006Consequences of regional scale nuclear conflicts
O. B. Toon et al.
Title Page
Abstract Introduction
Conclusions References
Tables Figures
◭ ◮
◭ ◮
Back Close
Full Screen / Esc
Printer-friendly Version
Interactive Discussion
EGU
distributions of combustible materials that could be ignited by nuclear bursts. To esti-mate fuel loadings for the present work, we make a basic assumption that within urban zones there is a direct relationship between the quantity of fuel available and the local
population density. Contributing to the fuel load would be dwellings, offices, industries
and infrastructure such as schools, transport and fuel depots, shopping malls, and so
5
on. Given the relationship between fuel loading and population density we can use population density data as a surrogate for fuel loading data. In the next section we discuss the relationship between fuel loading and population density, as well as other parameters needed to determine the smoke emissions. Next we discuss the altitude to which the smoke plumes might rise. We then apply this technique to determine smoke
10
emissions from attacks on a number of cities and countries.
6.1 Estimating fuel loading and smoke emissions
We estimate the mass of carbonaceous smoke (often referred to as elemental carbon, or soot) emitted by fires ignited by a single detonation in a specific location as follows:
Me=
J
X
j=1
PjAj
(
Mf X
i=1,n
FiQiSiCi
!
R
)
(5)
15
Here, Me is the total mass of the potential soot emission. The outer sum, j, is over
all grid cells in the region affected by the explosion and subject to fire ignition. Pj is
the population density (people/km2) within the grid cell j, which can be determined
using an appropriate population database for the area (LandScan, 2003). Aj is the
area of the grid cell, or the fractional area impacted by fire. In summing, we include
20
a total ofJ cells arranged symmetrically around ground zero such that the total area
burned following a 15-kt explosion is 13 km2, equivalent to that consumed at Hiroshima
(Glasstone and Dolan, 1977).
The term within brackets does not vary with location around ground zero in this
treat-ment. The key parameter, Mf, represents the baseline per capita mass of fuel of all
ACPD
6, 11745–11816, 2006Consequences of regional scale nuclear conflicts
O. B. Toon et al.
Title Page
Abstract Introduction
Conclusions References
Tables Figures
◭ ◮
◭ ◮
Back Close
Full Screen / Esc
Printer-friendly Version
Interactive Discussion
types estimated for the nation and locale of interest. In practice, we establish a base-line for the developed world circa 1980, and scale the results for other circumstances (see below). In the past, two techniques have been employed to determine the base-line fuel burden. Turco et al. (1990) analyzed the total quantities of various types of flammable materials that were produced and utilized annually in developed nations.
5
Then, with an estimate of the relevant residence time (in years) for each material, the total quantities of fuel were determined. The most extensive information available at the time related to the 1980’s. The total amount of all fuels in the developed world at
the time was estimated to be 11.4±3.6×10³Tg (teragram, or 1012g=106 metric ton),
where the range represented the minimum and maximum likely values. Dividing by the
10
total population of the developed world in 1980 – about 1.1×10⁹people – a mean value,
Mf=1.1±0.4×10⁷g/person, was derived.
An alternative approach to find Mf was taken by Small (1989) and Bush et al. (1991).
They surveyed land-use in a cross-section of U.S. cites, and incorporated data on the amounts of combustible materials in typical structures, including various types of
res-15
idences, industries and businesses. Their analysis yielded a total quantity of fuel in U.S. urban “target zones” of about 1322 Tg. Specifically, the targeted areas were delim-ited using an attack scenario that involved hundreds of megaton-sized weapons.
How-ever, Small (1989) did not quantify the number of individuals affected within targeted
cities, stating more generally that one-half of the entire urban-suburban area of the
20
U.S. lay within the target zones. Using the entire urban population of the U.S. in 1980
(152 million), a lower limit of the fuel per capita would therefore be 8.7×10⁶g/person.
Assuming that one-half of the population resided in target zones at the time, the inferred
per capita fuel loading would be 1.7×10⁷g/person. These results roughly bracket the
range derived by Turco et al. (1990). Accordingly, a baseline per capita fuel burden,
25
Mf, of 1.1×10
7
g/person is adopted here. Later, we return to the question of modern fuel loadings, and combustibles in other parts of the world.
In Eq. (5),Fi is a fraction that divides the total combustible mass loading into different
ACPD
6, 11745–11816, 2006Consequences of regional scale nuclear conflicts
O. B. Toon et al.
Title Page
Abstract Introduction
Conclusions References
Tables Figures
◭ ◮
◭ ◮
Back Close
Full Screen / Esc
Printer-friendly Version
Interactive Discussion
EGU
assumed to burn following nuclear ignition, andSi is the mean elemental carbon
emis-sion factor for that fuel type (Tables 8 and 9). To adjust the estimated smoke emisemis-sions
for national differences in fuel characteristics, a parameter,Ci, is also specified as the
ratio of the fuel type per person in the city in question to the fuel type per person in the developed world in 1980. Finally, to account for smoke removal in “black rains” induced
5
by firestorms, the average fraction of emitted elemental carbon that is not scavenged
in fire-induced convective columns is specified by the parameter,R, which is assigned
a baseline value of 0.8 (see below).
Assuming for the moment thatCand Qare unity, the value of the bracketed term in
Eq. (5) – based on the data in Table 8 – is 0.016 g(soot)/g(fuel) (Turco et al., 1990).
Al-10
ternatively, using the data in Table 9, the value is 0.020 g(smoke)/g(fuel) (Small, 1989).
An important difference between these estimates is the fraction of fuel in the category
of wood and wood products. A more subtle difference is that Turco et al. (1990)
esti-mate the mass of soot generated by fires, while Small (1989) gives the total amount of smoke, of which soot is a partial component. Comparing specific absorptivities, or
ab-15
sorption cross-sections per unit mass, in m2/g(smoke), we find that Turco et al. (1990)
used 7 m2/g(soot) while Small (1989) assumed 4.4 m2/g(smoke). These numbers are
better normalized by converting specific absorptivity to the absorption coefficient per
unit mass of fuel burned (that is, by combining the emission factor and specific
ab-sorptivity), which yields a value of 1.1×10⁻¹m2/g(fuel) for Turco et al. (1990), and
20
8.6×10⁻²m2/g(fuel) for Small (1989). These two values are in very reasonable
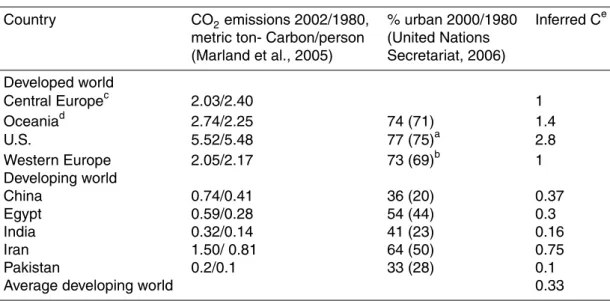
agree-ment. In subsequent paragraphs, we discuss alternative values forMf andC.
To scale fuel loading from population density, we employ a linear relationship that is represented by the solid line in Fig. 9. This relationship corresponds to the baseline
fuel mass per person,Mf=1.1×10⁷ g/person, being distributed over an area of 1 km2
25
(1010cm2), yielding a slope of 0.0011 g/cm2per person/km2. Figure 9 also compares
ACPD
6, 11745–11816, 2006Consequences of regional scale nuclear conflicts
O. B. Toon et al.
Title Page
Abstract Introduction
Conclusions References
Tables Figures
◭ ◮
◭ ◮
Back Close
Full Screen / Esc
Printer-friendly Version
Interactive Discussion
standard land-use categories. Bush et al. (1991) also provided data on the urban population density in each of these areas. We assumed that these urban population densities applied to the roughly 50% smaller urban areas they used to determine fuel loadings. Their results are indicated by the yellow symbols in Fig. 9. After calibrating against population, we carried out a linear regression for the fuel loading versus
pop-5
ulation density data points. The regression yielded a zero-population fuel loading of
about 0.8 g/cm2, which is roughly consistent with the background urban and residential
vegetation fuels assumed by Bush et al. (1991). Because of this mean background fuel component, the average fuel loadings derived by Bush et al. (1991) are higher (by about 40–60% ) at the lowest population densities than the baseline model in Fig. 9.
10
Even so, background vegetation has been ignored in the present analysis in favor of the linear model in Fig. 9. Also shown as a dashed line in Fig. 9 is the extrapolated regression corresponding to the data of Bush et al. (1991), which exhibits curvature at low population densities owing to the background fuel contribution. Significantly, the
two fuel loading models extrapolate to very similar values (within±10%) at the higher
15
population densities typical of megacity centers.
For the cases considered by Bush et al. (1991) the mean fuel loadings are relatively low. This can be explained in large part by the fact that Bush et al. (1991) sought to estimate the average fuel loadings that would apply to large yield nuclear weapon detonations over typical, moderate-sized U.S. cities, such as Nashville, Tennessee.
20
The footprint of a large weapon encompasses areas far removed from a city center. Hence, on an area-weighted basis, the average fuel loading is likely to be dominated by low values in uninhabited areas around cities, and in residential areas. Similarly, low average population densities would be predicted for target zones associated with high-yield detonations. For example, a 150-kt explosion is capable of igniting an area
25
of 100 km2, which would likely include extensive suburban tracts with low population
ACPD
6, 11745–11816, 2006Consequences of regional scale nuclear conflicts
O. B. Toon et al.
Title Page
Abstract Introduction
Conclusions References
Tables Figures
◭ ◮
◭ ◮
Back Close
Full Screen / Esc
Printer-friendly Version
Interactive Discussion
EGU
the larger square footage associated with residential property. Importantly, when Bush et al. (1991) considered higher density housing districts, predicted fuel loadings were
much greater, reaching 9 g/cm2 in one area of Nashville, for example. This points to
the fact that smaller detonations aimed at urban centers should be expected to ignite much higher fuel densities on average than larger yield weapons.
5
Simonett et al. (1998) analyzed components of the fuel load for San Jose, California. They documented the numbers and types of buildings, and used literature-derived fuel
loads for each building type to deduce an average fuel loading of 0.94 g/cm2within the
city boundaries. The analysis omitted various types of fuels, such as stored petroleum
and asphalt in roofing, but estimated that the total fuel load might be 1.34 g/cm2. Using
10
the 1980 San Jose population of 629 246, and a city area of 440 km2, we obtain a
population density of 1370 people/km2at the time. The average San Jose fuel loading
then falls slightly below the baseline curve in Fig. 9.
Several investigators have determined fuel loads for the portions of Hamburg that experienced firestorms during World War II (Fig. 9). The population density in the
15
burned sections of Hamburg was roughly 20 000 people/km2(Lucas et al., 1990). Ebert
(1963) cites fuel estimates by German fire engineers of 32 g/cm2of wood in one area
of the city center. The SCOPE assessment (Pittock et al., 1989) cites the fuel loading
in Hamburg as 47 g/cm2, while OTA (1979) gives 16 g/cm2, although neither source is
clear on the origins of these values. Schubert (1969) carefully investigated the wood
20
loading in two sections of Hamburg with areas of 0.37 km2and 0.45 km2, finding values
of 16 and 12 g/cm2, respectively. Peczkis (1988) described Dresden’s city center in
WW-II as being dominated by 5-story residences covering a significant fraction of the land area; combustible loadings for such buildings were used to estimate an average
fuel burden of 22 g/cm2. This value is likely to be low since it omits the large amounts
25
of coal stored in the city. A population density was not given.