Original Article
Compound soil-tyre chips modified by cement as a road construction material
Panu Promputthangkoon* and Bancherd Kanchanachetanee
College of Industrial Technology and Management
Rajamangala University of Technology Srivijaya, Khanom, Nakhon Si Thammarat, 80210 Thailand.
Received 20 March 2012; Accepted 15 July 2013
Abstract
This research attempts to overcome the two problems of low-quality soil and a growing number of discarded tyres by mixing low-CBR soil with recycled tyre chips. The compound soil-tyre chips was then stabilised by Portland cement with the aim of using them as a new material in road construction in order to reduce the occurrence of shrinkage cracks. To achieve the purposes of this research three standard geotechnical testing programmes were employed: (1) modified compaction tests, (2) California Bearing Ratio tests (CBR), and (3) unconfined compression tests. The modified compaction test results proved that for the mixtures having very low tyre chips and cement content, the behaviour is very complex. It was also observed that the greater the percentage of rubber added the lower the global density. However, this is predictable as the specific gravity of the rubber is much lower than that of the soil. For the relationship between the optimum moisture content (OMC) and the cement content, it was observed that there is no clear pattern.
For the specimens having no cement added, the CBR for unsoaked specimens was observed to be greater than that for soaked specimens. However, when the cement was introduced the CBR test showed that the resistance to penetration for the soaked specimens was significantly greater, indicating the effects of cement added on the strength. In addition, it was found that the CBR values for both soaked and unsoaked specimens gradually increased with the increase of cement content. Lastly, the unconfined compressive strength progressively increased with the increased percentage of cement.
Keyword: tyre chips, cement stabilisation, CBR, shrinkage crack
1. Introduction
Due to the lack of high quality geometerials for the construction of roads and embankments in Thailand, civil engineers have repeatedly attempted to improve whatever materials are available for the task. Suitable materials may exist; however, quite often their location is so far from a construction site that the cost of transportation may not be feasible for the project. According to Hausmann (1990), soil improvement techniques may be classified as mechanical modification, hydraulic modification, physical and chemical modification, and modification by means of inclusions and confinement.
It has been widely recognised that Portland cement can be used to increase the shear strength and stiffness of soils because it can be mixed with almost every soil type having various textures and sizes. The other benefit of cement stabilisation is that the cement-treated soil has a better stability in terms of volume change as well as a higher durability, which are the properties required for road con-struction. Furthermore, the construction of cement-stabilised soil does not require advanced techniques and technologies, i.e., simply spreading cement and mixing, applying water and mixing, and finishing with the conventional compaction. Even though a wide range of soil types may be improved by mixing with cement; nonetheless, the greatest effectiveness and economy are achieved when it is mixed with sands, sandy soils, and clayey soils having low to medium plasticity (FHWA., 1979).
* Corresponding author.
Email address: [email protected]
However, if not well-designed and poorly-controlled during construction, transverse shrinkage cracking may occur, especially at or near a surface. It should be noted that such cracks are normal for soil-cement construction (PCA, 1995). Normally, this will not affect a road base itself in terms of performance. In the case that the shrinkage cracks are too large such as wider than 3 mm, however, damage to the pave-ment may occur. Thus, there have been several techniques to minimise the occurrence of the shrinkage cracks. For example, before placing a cement-treated base a bituminous layer is laid first. Then, the soil-cement is constructed a few days later.
Discarded tyres have been widely regarded as solid waste as a result of industrial development. They have become an increasingly global problem because disposing of them in open areas is a danger to the environment. For example, they are vulnerable to fire. If this happens; they may then contaminate groundwater. The consequences would be disastrous as it may take hundreds of years for the groundwater to become clean again. In addition, the avail-able techniques needed for the task could not assure the outcome. As such, disposing of whole used tyres has been prohibited by the new EU Landfill Directive since July 2003 (Khalid and Artamendi, 2004). Thus, making use of them needs to be considered imaginatively and the solutions must be sustainable.
Each year, in the United States over 250 million of waste tyres are stockpiled (RMA, 2004), and more than 28 million of passenger car tyres are discarded in Canada (Garga and O’Shaughnessy, 2000). In the case of Thailand, the accumulated number of registered cars up to the 31st of
December 2009 was almost 27 million (Department of Land Transport Web Site). Consequently, if each vehicle needs tyre changing every three years; each year the waste tyres would be approximately 36 million. Moreover, it seems that acquiring a car for Thai people is becoming easier as the average income is gradually increasing. Considering these figures, it is apparent that Thailand needs to think sensibly about how to manage the waste tyres in the near future.
Several investigators have studied the shear strength and deformation characteristics of sand mixed with recycled tyre chips. Numerous results indicate that the shear strength of the mixture is increased, depending on tyre chip content as well as on the aspect ratio of the tyre chips. For soils having a low CBR (California Bearing Ratio) value, however, mixing them with the tyre chips may not improve its overall shear strength and stiffness. Thus, this research aimed at improving those low-CBR soils mixed with tyre chips by intro-ducing Portland cement so that the mixture could be used as a road construction material such as sub-base or even base layer.
2. Research Objectives
The main objective of this research was to investigate the possibility of mixing soil having a low-CBR value with
recycled tyre chips. The soil-tyre chips mixtures were then stabilised by introducing Portland cement having various cement contents, resulting in a soil-tyre chips-cement matrix that is suitable for a road base or road sub-base layer. To minimise the variables of the research, only one soil type and one size of tyre chips were investigated. Hence, the only variable remaining was the percentage of Portland cement to be mixed with the compound soil-tyre chips.
The modified compaction test was employed to deter-mine the maximum dry density as well as optimum moisture content (OMC). Then, the OMC values were used to prepare specimens for the California Bearing Ratio (CBR) test, both soaked and unsoaked. Note that the CBR values are the main property that is required for the design of road embankments. In addition, the unconfined compression test was also conducted to obtain the undrained shear strength, which is the most common type of shear strength used for the evalua-tion of soil-cement stabilisaevalua-tion.
3. Materials, Test Programmes, and Methods
This research aimed to improve low-quality soil for the purpose of using it as a road sub-base or base layer because good-quality geomaterials are increasingly difficult to obtain with reasonable cost. To achieve this, cement and tyre chips were employed to be mixed with such soil. It should be noted that cement has been widely used to increase the strength of soil. For tyre chips, however, they are becoming an environ-mental problem and need to be carefully managed. As such, making use of them for road construction would be a sustain-able solution as a vast quantity is required.
The first task of this research was to find a lateritic soil that is abundant in the South of Thailand but not good enough for road construction. The base material, a lateritic soil, was obtained from Satul, a province in the South of Thailand, 973 km from Bangkok. The soil was chosen because its CBR is quite low, i.e., just 18%. It had a specific gravity Gs of 2.64, which is relatively low compared to other similar
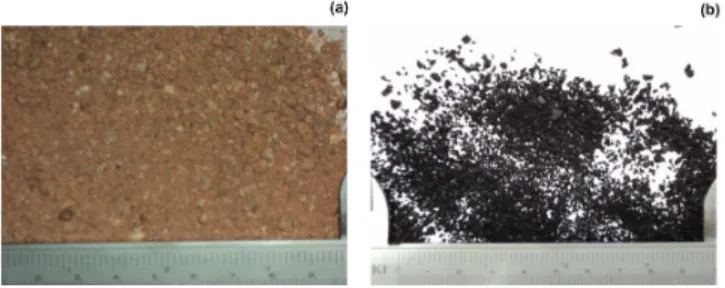
soils in Thailand such as 2.68, as studied by Saowapakpiboon et al. (2010). The true scale picture of the soil is shown in Figure 1(a). The mean particle size of the soil D50 was 1.6 mm,
the coefficient of uniformity Cu = 5.4, and the coefficient of
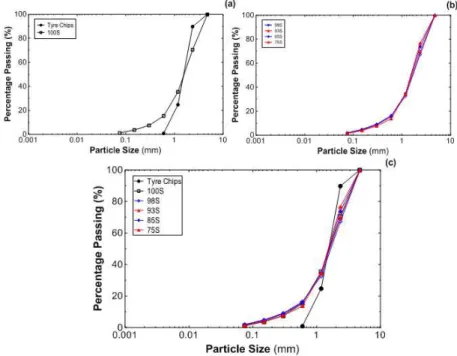
curvature Cg = 0.5. The size distribution curve for the soil is
illustrated in Figure 2(a). In addition, according to the Unified Soil Classification system, the soil has been classified as SP
(Poorly-Graded Sand).
Recycled tyre chips were obtained commercially from KKI Recycle, Nakhonpathom, Thailand. The specific gravity of the tyre chips was 1.11, which is quite similar to those studied by Promputthangkoon and Hyde (2010). The true scale picture of the tyre chips is also shown in Figure 1(b). Note that a common range of Gs for the recycled tyres reported by Edil and Bosscher (1994) is 1.13 to 1.36. The D50 of the rubber was about the same as that of the soil. The size distribution curve for the tyre chips is illustrated in Figure 2(a).
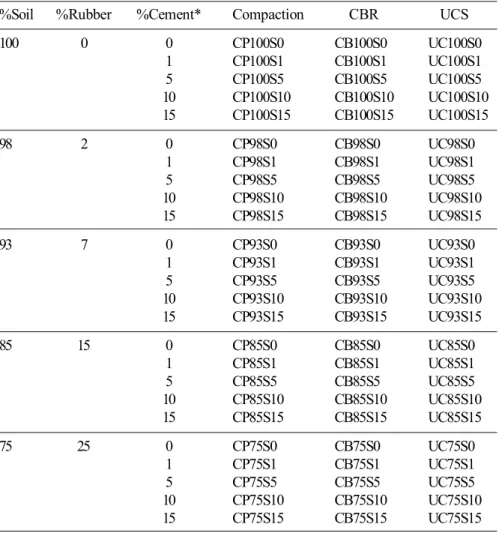
The mixtures were prepared by mixing the soil with the rubber according to weight. This is because it would be easier for controlling the soil and rubber proportions. How-ever, in the field mixing by means of volume would be more convenient. Converting the mixtures prepared by weight to be mixtures by volume can be done by using the specific gravity values for the soil and the tyre chips already reported. The soil to rubber ratios were 100:0, 98:2, 93:7, 85:15, and 75:25; they were named as 100S, 98S, 93S, 85S, and 75S, respectively. These mixtures were weighed accordingly and particle size analysis performed using a simple sieving technique. The size distribution curves for all mixtures including the soil and tyre chips are also illustrated in Figure 2(c). Next, each mixture was mixed with Portland cement ranging from 0, 1, 5, 10, and 15%. Note that the cement portion was calculated based on the soil portion. This resulted in a total of 25 mixtures. To achieve the objectives of this research project three standard test programmes were conducted: (1) modified compaction tests, (2) California Bearing Ratio tests (CBR), and (3) unconfined compression tests.
As the rubber in soil-tyre chip matrices is highly com-pressible, the modified compaction test was chosen over the stand compaction test because it provides a higher energy that is needed to compact the compound soil-rubber. The procedures for the modified compaction test were in accor-dance with ASTM D 1557-02 (2003). For the CBR test the standard test methods provided by ASTM D 1883-99 (1999) were employed. For the mixtures containing high amounts of cement, a universal testing machine (UTM) was utilised to penetrate the specimens because the capacity of the standard CBR machine was not enough (see Figure 3). The unconfined compressive strength was determined by the procedures detailed in ASTM D 1633-00 (2000). The details of all of the mixtures, test numbers, and test methods are shown in Table 1.
Figure 2. Particle size distribution curves for (a) soil and tyre chips (b) compound soil-tyre chips (c) soil, tyre chips, and compound soil-tyre chips
4. Results and Discussion
The test results are summarised in Table 2. It displays sample number, mixtures and corresponding cement content (CC) added, optimum moisture content (OMC), maximum dry density, soaked and unsoaked CBRs, and unconfined com-pressive strength. Details of the results for each test as well as its graphical results are shown and discussed in the respec-tive sections below.
4.1 Modified compaction tests
The maximum dry density d,max and its correspond-ing optimum moisture content OMC for each sand-rubber mixture were plotted against the cement content, as illustrated in Figure 4(a). In addition, the relationship between the OMC and the cement content was plotted and illustrated in Figure 4(b).
Table 1. Summary of mixtures, test programmes, and test numbers.
%Soil %Rubber %Cement* Compaction CBR UCS
100 0 0 CP100S0 CB100S0 UC100S0
1 CP100S1 CB100S1 UC100S1
5 CP100S5 CB100S5 UC100S5
10 CP100S10 CB100S10 UC100S10 15 CP100S15 CB100S15 UC100S15
98 2 0 CP98S0 CB98S0 UC98S0
1 CP98S1 CB98S1 UC98S1
5 CP98S5 CB98S5 UC98S5
10 CP98S10 CB98S10 UC98S10 15 CP98S15 CB98S15 UC98S15
93 7 0 CP93S0 CB93S0 UC93S0
1 CP93S1 CB93S1 UC93S1
5 CP93S5 CB93S5 UC93S5
10 CP93S10 CB93S10 UC93S10 15 CP93S15 CB93S15 UC93S15
85 15 0 CP85S0 CB85S0 UC85S0
1 CP85S1 CB85S1 UC85S1
5 CP85S5 CB85S5 UC85S5
10 CP85S10 CB85S10 UC85S10 15 CP85S15 CB85S15 UC85S15
75 25 0 CP75S0 CB75S0 UC75S0
1 CP75S1 CB75S1 UC75S1
5 CP75S5 CB75S5 UC75S5
10 CP75S10 CB75S10 UC75S10 15 CP75S15 CB75S15 UC75S15
* The cement was calculated based on the soil portion
Overall, it was found that the d,max is gradually decreased with the gradual increase of the tyre chips content (TC). This, however, was predictable as the Gs for the rubber
is significantly smaller than that of the soil. As a result, when the soil was mixed with the rubber, the global unit weight of the mixture was subsequently lower than that of pure soil. When considering Figure 4(a), the compaction characteris-tics may be divided into three groups: group (1) 100S and 98S, group (2) 93S, and group (3) 85S and 75S.
For group (1) the initial d,max (no cement added) was about 1.83-1.84 g/cm3. When 1% of CC was added, however,
the d,max surprisingly decreased to around 1.78-1.79 g/cm3.
Then it increased again after 5% of CC was added; and, this time it was slightly greater than that of the specimens whose mixtures has no CC. However, when the CC was increased to 10% the d,max was lower than that of the mixtures having 5% CC; and, it increased after the CC was increased to 15%. This complex behaviour may be due to the fact that this is
a five-phase composite material, comprising air, water, soil, rubber, and cement. For example, during the mixing and especially the compaction test the void ratio may be altered due to the disturbance as well as the force applied. The alteration of the void ratio then may cause the changes in pore and pore water pressure. In addition, this may also influence the effectiveness of the compaction due to either the increase or the decrease of the pore and pore water pressure. The effects of mixing materials having different particle sizes on minimum and maximum void ratios have been reported and discussed by Lade et al. (1998).
For group (3), it seems that the addition of CC had no effects on the compaction characteristics as the d,max for all of the mixtures was very similar, regardless of how much CC was added. For group (2) the initial d,max was much lower than that of 100S. However, it progressively increased with the increase of the CC. This distinguishing behaviour of group (2) suggests that it may represent a transitional condi-Table 2. Summary of test results.
Compaction CBR (%) %Soil %Rubber %Cement* OMC Max. Dry Density Unsoaked Soaked
(%) (g/cm3)
100S 100 0 0 12.7 1.832 19 18 227
1 15.3 1.796 23 25 291
5 12.5 1.871 145 181 1063
10 13.1 1.844 488 566 1481
15 10.7 1.890 624 691 1804
98S 98 2 0 12.0 1.819 10 6 195
1 12.7 1.780 26 14 223
5 10.2 1.868 98 111 715
10 11.8 1.812 297 330 978
15 11.5 1.829 468 570 1213
93S 93 7 0 14.5 1.624 4 2 37
1 12.1 1.678 10 5 87
5 14.9 1.688 52 60 416
10 13.6 1.731 101 121 712
15 11.9 1.786 298 336 750
85S 85 15 0 13.4 1.580 3 1 15
1 13.2 1.591 5 4 53
5 13.4 1.588 24 44 287
10 12.8 1.600 59 66 511
15 12.6 1.592 121 132 532
75S 75 25 0 14.1 1.410 1.3 0.6 8.2
1 14.0 1.412 2 2 29
5 13.1 1.418 11 8 181
10 13.5 1.454 22 23 211
15 13.1 1.453 39 42 287
* Based on the soil portion
UCS, qu (kPa) Sample
tion between group (1) and group (3). In other words, the transitional condition is where the mixture containing the rubber content between 2% and 15% causes the maximum dry density to increase virtually linearly, unlike the other two groups. This, however, needs to be further studied. For the OMC behaviour, it was observed that there is no clear pattern for any of the mixtures. Nonetheless, overall when the CC was greater the OMC required was generally lower, as evident in Figure 4(b).
4.2 California bearing ratio tests
The values of the CBR tests for both unsoaked and soaked specimens of 100S, 98S, 97S, 85S, and 75S were plotted and are shown in Figures 5(a), (b), (c), (d), and (e), respectively. In addition, the values of CBR for all of the unsoaked specimens and for all of the soaked specimens were plotted together and are illustrated in Figures 6(a) and (b), respectively, in order to be able to compare the behaviour when the rubber portion was varied.
For the CBR tests for all mixtures having zero CC, it was found that generally the CBR values for the unsoaked specimen were slightly greater than those of the soaked ones. However, when the cement was introduced the CBR values for the soaked specimens were much greater. These results indicate the effects of the cement on the CBR in terms of the
increase of the strength and stiffness. Predictably, it was observed that as the percentage of rubber was gradually increased from 2% to 25%; a gradual decrease of the CBR was observed. This may lie on the fact that the compressi-bility of the rubber is greater than that of the soil. As a result, resistance to penetration was observed to be lower than that of pure soil, as observed in the CBR test results.
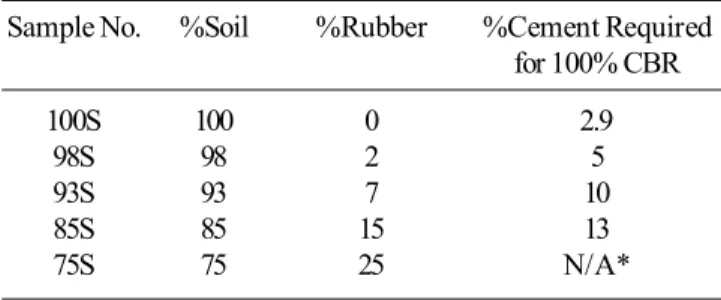
Presumably, the CBR value required for a road base is 100%. For pure soil (100S) specimens, both soaked and unsoaked, without the addition of cement, it can be seen that the CBR is just 18% to 19%; but, it was substantially increased to over 600% when 15% of cement was added. Nonetheless, the unsoaked specimen required only approxi-mately 3% cement to attain the CBR of 100%, as evident in Figure 5(a). Thus, it was interesting to apply this analogy to all of the other mixtures. The summary of the percentage of CC required for the mixtures to attain the 100% CBR is shown in Table 3. Notice that for 75S, the CBR values were very low even when the CC was at a maximum of 15%. Thus, it may be suggested that this particular mixture is not suitable as a road base structure.
From Table 3, the results were further analysed by plotting the relationship between the cement content required for the mixture to attain the CBR of 100% (CC(CBR100) in %) versus the tyre chip contents (TC in %), as illustrated in Fig-ure 7. Subsequently, the following polynomial equation was
obtained:
CC(CBR100) = 2.76+1.13(TC) - 0.04(TC)2 (1)
This equation could be used to predict how much cement content is required for a soil-rubber mixture having a certain amount of rubber to attain the 100% CBR. From these results and discussion, it may be suggested that recycled rubber regarded as solid waste together with Portland cement may be used to mix with poor-quality soil to increase the shear strength and stiffness in order to be used as a road construction material. It should be noted that equation (1) was derived based on a specific soil. However, it could also be employed for other soils having similar gradation and properties.
4.3 Unconfined compression tests
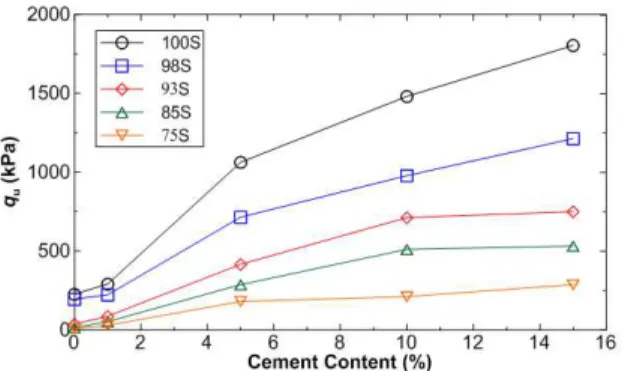
The unconfined compressive strengths (qu) summa-rised in Table 2 were plotted and are shown in Figure 8. Overall, it was found that the qu gradually increased with the increase in cement content. When there was no cement added, the qu values for 100S and 98S were very similar, indi-cating that the behaviour of compound soil-rubber was still dominated by the soil; moreover, the rubber was just floating in the soil-rubber matrices.
The characteristics of the qu versus cement content graphs for all mixtures indicate that the qu behaviour may be categorised into two groups: group (1) 100S and 98S, and
group (2) 93S, 85S, and 75S. The maximum qu for 100S having
15% of cement was 1804 kPa. This is similar to that of fine-grained soil mixed with the same amount of cement as reported by FHWA (1979). It was also observed that when a small amount of cement of just 1% was added, the qu was
quite similar to that of the specimen having no cement, indi-cating a very small effect of the cement. However, when the cement content was increased to 5% the qu was dramatically
increased. After that, the qu was progressively increased
almost linearly. This behaviour for 100S was also observed for 98S, except that the qu was quite smaller; i.e., the
maximum qu for 98S was just 1213 kPa.
For group (2), the initial qu values (no cement added)
for 93S, 85S, and 75S were 37, 15, and 8.2 kPa, respectively. Notice that these values are very low compared to those of group (1). When a small amount of cement content of 1% was added, the qu values were observed to be slightly
increased: they were 87, 53, and 29 kPa, for 93S, 85S, and 75S, respectively. They continued to increase almost linearly when the cement was increased from 5% to 10%. However, it can be seen that at a maximum cement content of 15%, the qu
values are very similar to those mixtures having 10% cement content. This indicates that the effectiveness of the cement added as high as 15% is no better when a mixture contains high proportions of rubber. The maximum qu values for 93S,
85S, and 75S were 750, 532, and 287 kPa, respectively.
5. Conclusions
A lateritic soil that is abundant is the South of Thai-land, Satul province, was chosen as a base soil to be mixed with recycled tyre chips and stabilised by Portland cement for the purpose of using them as a road construction material. The soil to tyre chips ratios by weight were 100:0, 98:2, 93:7, 85:15, and 75:25. Each mixture was mixed with Portland cement ranging from 0, 1, 5, 10, and 15%, based on the soil portion.
To achieve the aims of the research three standard geotechnical testing programmes were conducted: (1) modi-fied compaction tests, (2) California Bearing Ratio (CBR) tests, and (3) unconfined compression tests. The purpose of the modified compaction test was to obtain the attainable maximum dry density as well as its corresponding water
Figure 6. CBR values for all mixtures (a) unsoaked samples (b) soaked samples
Table 3. Cement content required for unsoaked specimens attaining a CBR of 100
Sample No. %Soil %Rubber %Cement Required for 100% CBR
100S 100 0 2.9
98S 98 2 5
93S 93 7 10
85S 85 15 13
75S 75 25 N/A*
content, in the other word, Optimum Moisture Content, known as OMC. The OMCs then were used to prepare speci-mens for the CBR tests, both soaked and unsoaked. The CBR values would give a very important parameter indicating whether a mixture is suitable for road construction. The un-confined compression test was conducted to provide another property that is essential for geomaterial stabilised by cement, which is unconfined compressive strength. Based on the experiences, test results, and analyses, the following conclusions have been drawn.
(1) The specific gravity values for the soil and tyre chips are 2.64 and 1.11, respectively.
(2) The mean particle sizes for the soil and the rubber are very similar; they are about 1.6 mm.
(3) The coefficient of uniformity Cu and the coefficient of curvature Cg for the soil are 5.4 and 0.5, respectively. These result in the soil classified as SP, according to the Unified Soil Classification system.
(4) Overall, the maximum dry density d,max is gradu-ally increased with increased cement content. However, the
d,max values for 100S and 98S having 1% of cement are actually lower than those specimens having no cement. This may be due to the fact that the mixture is a five-phase com-posite material comprising soil, rubber, cement, water, and air, whose behaviour is very complex and needs to be further studied.
Figure 7. Cement content at CBR = 100 vs. tyre chips content.
Figure 8. qu values for all mixtures vs. cement contents.
(5) It was found that there is no clear pattern for the OMC values against the cement content.
(6) The CBR values for both soaked and unsoaked are gradually increased with the increase of cement content.
(7) For the mixtures having no cement added the CBR for unsoaked specimens is slightly greater than those of soaked specimens. However, this is contrary for the mixtures that were mixed with cement, i.e., the CBR values for soaked specimens are greater.
(8) As predicted, the unconfined compressive strength is gradually greater with the increase of cement content.
(9) Discarded tyres are vulnerable to fire. Thus, dis-posing of them in open areas is a danger to the environment. For example, the burnt tyres would contaminate the ground-water. It then may take over hundreds of years for the groundwater to become clean again. It is therefore suggested that making use of them as a road construction material by placing them at lower layer could prevent the disaster.
Acknowledgements
The authors wish to thank College of Industrial nology and Management, Rajamangala University of Tech-nology Srivijaya, for their financial aid by means of the annual government statement expenditure 2011 (BE 2554). Special thanks are due to Assist. Prof. Thaveechai Kalasin for his invaluable comments and suggestions, both during the research and writing the paper. In addition, the authors would like to extend their gratitude to Mr Michael Radosevic for his help and assistance in preparing the manuscript.
References
American Society for Testing and Materials (ASTM). 2003. ASTM D1557 – 12 Standard Test Methods for Labora-tory Characteristics of Soil Using Modified Effort (56,000 ft-lbf/ft3(2,700 kN-m/m3)), ASTM, Pennsylva-nia, USA.
American Society for Testing and Materials (ASTM). 2000. ASTM D 1633 – 00 Standard Test Methods for Com-pressive Strength of Molded Soil-Cement Cylinders), ASTM, Pennsylvania, USA.
American Society for Testing and Materials (ASTM). 1999. ASTM D 1883 – 99 Standard Test Methods for CBR (California Bearing Ratio) of Laboratory-Compacted Soils, , ASTM, Pennsylvania, USA.
Edil, T. B., and Bosscher, P. J. 1994. Engineering Properties of Tire Chips and Soil Mixtures, Geotechnical Testing Journal. 7(4), 453-464.
Department of Land Transport Website http://www.dlt.go.th. Garga, V.K., and O’Shaughnessy, V. 2000. Tire-Reinforced Earth Fill, Part 1: Construction of a Test Fill, Per-formance and Retaining Wall Design. Canadian Geotechnical Journal. 37, 75-96.
Khalid, H. A., and Artamendi, I. 2004. Mechanical properties of used-tyre rubber. Engineering Sustainability. 157 (1), 37-43.
Lade, P. V., Liggio, jr., C. D., and Yamamuro, J. A. 1998. Effects of Non-plastic Fines on Minimum and Maximum Void Ratios of Sand. Geotechnical Testing Journal. 21(4), 336-347.
PCA. 1995. Soil-Cement Construction Handbook, Portland Cement Association, Illinois, USA.
Promputthangkoon, P., and Hyde, A. F. L. 2010. Liquefaction Mitigation by means of Sand-Tyre Chip Mixtures. Proceeding of 17th South East Asian Geotechnical
Conference, Taipei, Taiwan, May 10-13, 2010, 371-374.
Rubber Manufactures Association. 2004. US Scrap Tire Markets 2003 Edition, Rubber Manufactures Associa-tion, Washington D.C., USA
Saowapakpiboon, J., Bergado, D. T., and Kritpuckkrapong, T. 2010. Increasing Engineering Properties of Laterite Soil by using Portland Cement Type I and Chamroad. Proceeding of 15th National Conference on Civil
Engi-neering, Ubon Ratchathani, Thailand, May 12-14, 2010.