1135
A CONFIRMATORY APPROACH TO MEASURING RISKS IN SUPPLY CHAINS
Constangioara Alexandru
Oradea University, Department of Management and Marketing, Oradea, Romania [email protected]
Abstract: In order to achieve the desired performances and the increased value added to the final consumer, organizations need not only to integrate their core businesses and align them to business strategy but also to handle disturbances in their environment. Existing literature on supply chain management underlines the need for adequate risks management in supply chains. Supply chain risks, if not managed properly do have a negative impact on business performance (Shah, 2009, Florian, 2013, Hendricks and Singhal, 2005). Supply chain risks management (SCRM) emerged as a response to the
increasing volatility in today’s global supply chain environment.
We first review the existing theoretical framework for identification of risks in the supply chains. There is general agreement on the general framework for coping with risks in the context of supply chain. Thus SCRM involves (a) risks identification, (b) assessment, (c) mitigation and (d) responsiveness (Wagner and Neshat, 2012).Also it is generally accepted that supply chain integration and lean management are the main strategy for reducing uncertainty whereas agile supply chains and quantitative modeling are the main solutions to coping uncertainty.
The empirical researchfocuses on measuring risks in supply chains. We propose a confirmatory factor analysis of the measurement model of risks in supply chains. Existing literature on confirmatory factor analysis agrees that this technique provides extensive possibilities to analyze the complexity of the relationships among the variables.
Results show that all estimated coefficients corresponding to indicator variables are statistically significant and have the desired positive sign. Also all the estimated variances and covariances among latent variables are statistically significant.
Our proposed research methodology reveals the advantages of a confirmatory factor analysis over an exploratory principal component analysis in the context of risks management in supply chains. Moreover, as Sodhi and Tang (2012) reveals, more than half of papers in existing SCRM literature are either conceptual or qualitative empirical (case studies). Our proposed quantitative methodology contributes to reducing the above mentioned gap, providing results that can be used for statistical inferences and for enhancing the efficiency of the managerial decisional process.
Keywords: supply chain risks management, confirmatory analysis, risks drivers
JEL classification:M10, C54
1.Risks drivers and strategies in supply chains
1136
Table 1. The scope of supply chain risks management
What is supply chain risks management? How SCRM differs from SCM?
Dealing with supply-demand stochastic SCRM is a subset of SCM Dealing with risk within supply chain
operations
SCRM is a subset of SCM, with additional focus on risks
Focus on low probability – high impact events
SCRM is something outside SCM
Dealing with the unknown SCRM is a subset of SCM but additional focus on supply sources Dealing with disruptions/disasters SCRM overlaps with SCM and risks
management / finance Dealing with risks within supply chain
strategy
Dealing with stochastic but need new probability –based approaches
Source: adapted from Sodhi, Son and Tang (2012)
As it can be seen in table 1, dealing with risks, uncertainties or stochastic are recurrent in SCRM literature. While there are authors which clearly differentiate between risks and uncertainties (Hillson, 2006), for others distinction is blurred to the point it does not exist (Peck, 2006). It is agreed that both risks and uncertainties are deriving from the increasing complexity of the supply chain networks.
In what follows we focus on the problematic of SCRM, identifying the drivers of risks in the supply chain, the strategies to cope with them. We also propose a confirmatory model to measure risks in supply chains.
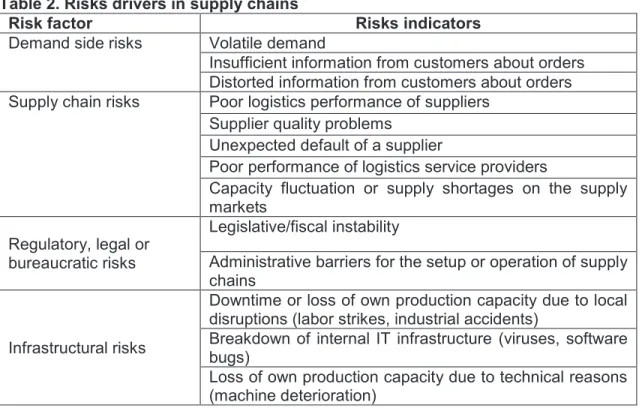
Supply chain risk can be broadly classified as shown in table 2.
Table 2. Risks drivers in supply chains
Risk factor Risks indicators
Demand side risks Volatile demand
Insufficient information from customers about orders Distorted information from customers about orders Supply chain risks Poor logistics performance of suppliers
Supplier quality problems Unexpected default of a supplier
Poor performance of logistics service providers
Capacity fluctuation or supply shortages on the supply markets
Regulatory, legal or bureaucratic risks
Legislative/fiscal instability
Administrative barriers for the setup or operation of supply chains
Infrastructural risks
Downtime or loss of own production capacity due to local disruptions (labor strikes, industrial accidents)
Breakdown of internal IT infrastructure (viruses, software bugs)
1137
Risk factor Risks indicators
Infrastructural risks Perturbation or breakdown of external IT infrastructure
Catastrophic risks
Wars, civil unrest or other socio-political crisis Diseases or other epidemics
Natural disasters Terrorist attacks Source: Wagner and Bode, 2008, p. 323
According to Wagner and Bode (2008), coping with supply chain risks necessitates adequate strategies. Indicators of supply chain risk management are:
§ Collaboration with suppliers to develop transparent supply chains and an open sharing of information;
§ Business continuity or contingency plans addressing several supply chain risks;
§ Monitoring suppliers for possible supply chains risks;
§ Product differentiation for reducing demand side risks;
§ A distinct organizational structure dedicated to SCRM;
§ Insurance against supply chain risks.
2. Empirical studies of SCRM in Romanian supply chains
In 2013 we have conducted a research targeting an initial sample of 200 Romanian companies. Data was collected using a survey-based questionnaire returning 55 usable responses. The analysis of frequencies of companies in the working dataset reveals that the proposed analysis uses a sample of firms from various industries, covering all levels of a supply chain, from production to commerce.
2.1 Methodology
This paper follows the literature SCRM. In particular we have chosen to use the same questionnaire proposed initially by Wagner and Bode (2008) to measure the risks and the risks management in supply chains.
The measurement of risks in a supply chain relies on a five point Likert type scale, asking respondents to assess to what extent their firm has been experienced a negative impact in supply chain management in the past three years due to different supply chain risks. SCRM is evaluated also using a five point Likert type scale asking respondents to
compare the supply chain performance indicators in their firms with indicators of firm’s
major competitor.
As required by supply chain literature, the survey was pre-tested and validated using the feedback of local supply chain managers. Pre-testing ensured the content validity of scales used to measure different constructs employed in the analysis. Also a throughout review of existing literature has ensured the substantive validity of the scales, all the items being conceptually and theoretically linked to the construct (Dunn, Seaker and Waller, 1994). Afterwards, the measurement model was tested by means of a confirmatoryfactor analysis. As opposed to an exploratory analysis, a confirmatory analysis relies on existing literature to hypnotize an underlying relationship between factors and indicator variable. The propose measurement model does not require refinement. Testing is ensured by existing statistical techniques in the field.
1138
For the required analysis we have chosen to use the statistical package SAS 9.2.
2.2. Results
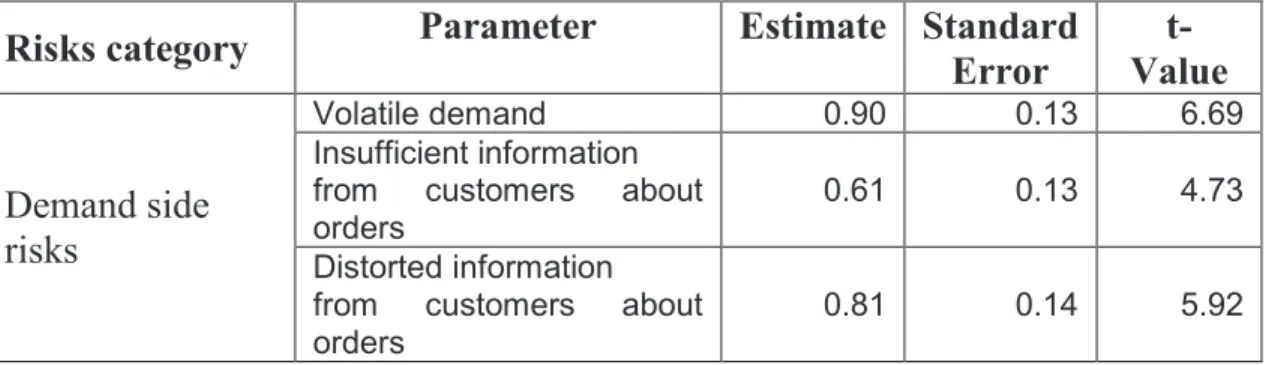
Table 3 reports results of the measurement model for demand side risks.
Table 3. Measurement model for demand side risks
Risks category
Parameter
Estimate Standard
Error
t-
Value
Demand side
risks
Volatile demand 0.90 0.13 6.69
Insufficient information from customers about orders
0.61 0.13 4.73
Distorted information from customers about orders
0.81 0.14 5.92
We see that all coefficients have the desired sign and are statistically significant (t-values are above the threshold value of 1.96 corresponding to p=5%)
Table 4 reports results for the testing the measurement model for supply chain risks.
Table 4. Measurement model for supply side risks
Risks
category
Parameter
Estimate Standard
Error
t-
Value
Supply side
risks
Poor logistics performance of
suppliers 0.66 0.16 4.20
Supplier quality problems 0.69 0.14 4.88 Unexpected default of a supplier 1.17 0.11 10.57 Poor performance of logistics
service providers 0.35 0.18 1.93
Capacity fluctuation or supply
shortages on the supply markets 0.26 0.23 1.13
Table 4 shows that one indicator of supply chain risk is only marginally statistical significant (Poor performance of logistics service providers). There is also one indicator which is not statistically significant (Capacity fluctuation or supply shortages on the supply markets).
Table 5 reports results for the testing the measurement model for regulatory risks.
Table 5. Measurement model for regulatory risks
Risks
category
Parameter
Estimate Standard
Error
t-
Value
Regulatory
risks
Legislative/fiscal instability 0.84 0.16 5.24 Administrative barriers for the
setup or operation of supply chains
0.89 0.13 6.99
1139
Table 6. Measurement model for infrastructural risks
Risks
category
Parameter
Estimate Standard
Error
t-
Value
Infrastructural
risks
Downtime or loss of own production capacity due to local disruptions (labor strikes, industrial accidents)
0.64 0.15 4.20
Breakdown of internal IT infrastructure (viruses, software bugs)
1.16 0.10 12.03
Loss of own production capacity due to technical reasons (machine deterioration)
0.88 0.11 8.33
Perturbation or breakdown of
external IT infrastructure 0.54 0.14 3.78
Table 6 reports results for the testing the measurement model for infrastructural risks. Results show that all two indicators are statistically significant and have the desired sign.
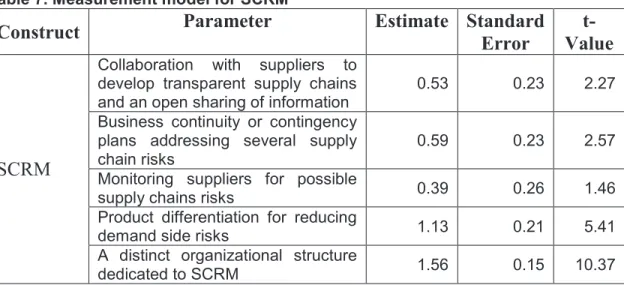
Table 7. Measurement model for SCRM
Construct
Parameter
Estimate Standard
Error
t-
Value
SCRM
Collaboration with suppliers to develop transparent supply chains and an open sharing of information
0.53 0.23 2.27
Business continuity or contingency plans addressing several supply chain risks
0.59 0.23 2.57
Monitoring suppliers for possible
supply chains risks 0.39 0.26 1.46 Product differentiation for reducing
demand side risks 1.13 0.21 5.41
A distinct organizational structure
dedicated to SCRM 1.56 0.15 10.37
Finally table 7 shows that there is one indicator of SCRM which is not statistically significant (Monitoring suppliers for possible supply chains risks). The other four indicators are statistically significant and positive.
1140
Table 8. Covariances among Exogenous Variables
Var1
Var2
Estimate Standard
Error
t Value
Supply side risks
Demand
side risks 0.48 0.08 5.78 Regulatory
risks
Demand
side risks 0.46 0.09 4.94 Regulatory
risks
Supply
side risks 0.36 0.09 3.83 Infrastructural
risks
Demand
side risks 0.38 0.10 3.66 Infrastructural
risks
Supply
side risks 0.20 0.10 1.88 Infrastructural
risks
Regulatory
risks 0.51 0.09 5.61
SCRM Demand
side risks 0.35 0.08 4.52
SCRM Supply
side risks 0.45 0.07 6.41 SCRM Regulatory
risks 0.32 0.08 4.03
SCRM Infrastructural risks 0.20 0.08 2.40
Results in table 8 reveals that all covariances among different latent constructs employed in our analysis are statistical significant. This shows that controlling for them is necessary in our model. Under these consequences a simple orthogonal solution (such as the solution given by the implicit settings of a principal component analysis) would have been biased and inefficient.
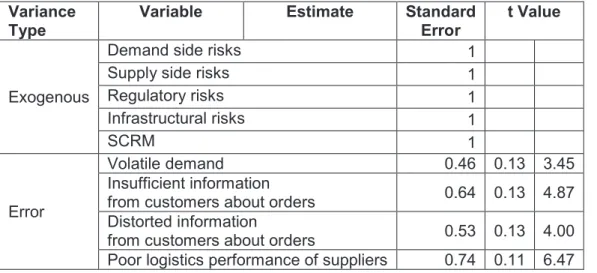
Yet we still have to control also for the variances of exogenous variables and the errors of the indicator variables (table 9).
Table 9. Standardized Results for Variance Parameters
Variance Type
Variable Estimate Standard Error
t Value
Exogenous
Demand side risks 1
Supply side risks 1
Regulatory risks 1
Infrastructural risks 1
SCRM 1
Error
Volatile demand 0.46 0.13 3.45
Insufficient information
from customers about orders 0.64 0.13 4.87 Distorted information
1141
VarianceType
Variable Estimate Standard Error
t Value
Error
Supplier quality problems 0.67 0.12 5.71
Unexpected default of a supplier 0.24 0.11 2.21 Poor performance of logistics service
providers 0.93 0.07 12.49
Capacity fluctuation or supply shortages
on the supply markets 0.97 0.05 20.71 Legislative/fiscal instability 0.62 0.13 4.65 Administrative barriers for the setup or
operation of supply chains 0.38 0.16 2.42 Downtime or loss of own production
capacity due to local disruptions (labor strikes, industrial accidents)
0.74 0.11 6.74
Breakdown of internal IT infrastructure
(viruses, software bugs) 0.07 0.09 0.79 Loss of own production capacity due to
technical reasons (machine deterioration)
0.35 0.10 3.47
Perturbation or breakdown of external IT
infrastructure 0.78 0.11 7.28
Collaboration with suppliers to develop transparent supply chains and an open sharing of information
0.91 0.08 11.07
Business continuity or contingency plans
addressing several supply chain risks 0.89 0.09 9.98 Monitoring suppliers for possible supply
chains risks 0.96 0.06 16.69
Product differentiation for reducing
demand side risks 0.70 0.12 5.92
A distinct organizational structure
dedicated to SCRM 0.39 0.12 3.13
Variances of the exogenous variables have been normalized to 1 by our statistical procedure used in the analysis. Error variances are all statistically significant. This supports our decision to control for them in the first place. In addition the statistically significant error variances of the indicators reveals that the variance in the indicator variables is not entirely accounted for by their relationship with the factor.
The overall fit is acceptable. The SRMSR is 0.0067 and AGFI is 0.81. RMSEA is also close to the threshold level of 0.005.
3. Conclusions
Literature on SCRM is relatively new. Although there is diversity in the scope and research methodology employed in the field, researchers agree that SCRM deals with mitigating risks in the supply chains. A plethora of studies reveal the negative consequences of a lack of SCRM strategies on the organizational performances.
1142
respect to both OLS estimations and exploratory factor analysis. For example is allows to control for all the possible relationships among factors and indicator variables. It provides a customized effect analyzes. And of course it makes possible a throughout analysis of overall model fit.
Our results support the existence of a rather complicated structure of relationships among the different types of risks in the supply chains. Thus our findings do provide supporting evidence for the existing theory in SCRM. Most importantly, we show that in the context of SCRM it is necessary to employ a confirmatory factor analysis in order to grasp the intricacies among different types of risks in supply chains.
Having illustrated the necessity for quantifying the complex relationships among risks in supply chains, it is necessary to further identify the impact of each risks on organizational performance. Future research in this field has to adequately quantify this aspect. Also as a direction for future research we propose controlling for different characteristics of firms and industries.
References
Dunn, Seaker and Waller (1994) ‘Latent Variables in Business Logistics research: Scale
Development and Validation’, Journal of Marketing, 15(2), pp. 145-69.
Florian, G., L. (2013) ‘Analysis of the Impact of the Supply Chain Performance on the Overall Organizational Performance’, The Annals of the University of Oradea. Economic Sciences, XXII (1), pp. 1505-10.
Hendricks, K, and V Singhal (2005) ‘An Empirical Analysis of theEffect of Supply Chain Disruptions on Long Run Stock PricePerformance and Equity Risk of the Firm’, Production andOperations Management, pp 25–53.
Hillson, D. (2006) Integrated Risks Management as a Framework for Organizational Success, Seattle: PMI Global Congress Proceedings.
Peck, H. (2006) ‘Reconciling Supply Chain Vulnerability, Risk and Supply Chain Management’, International Journal of Logistics: Research and Applications, 9(2), pp. 127-42.
Shah, J. (2009) ‘Supply Chain Risk Management: Academic Perspective’, IIMB Management Review, pp. 149-57.
Sodhi, M., Son, G. and Tang, S. (2012) ‘Researchers’ Perspective on Supply Chain Risk
Management’, Production and Operations Management, 21(1), pp. 1-13.
Wagner, S. and Bode, C. (2008) ‘An Empirical Examination of Supply Chain Performance along Several Dimensions of Risks’, Journal of Business Logistics, 29(1), pp. 307-25.