ACPD
15, 31025–31051, 2015A Joint data record of tropospheric ozone
from Aura-TES and MetOp-IASI
H. Oetjen et al.
Title Page
Abstract Introduction
Conclusions References
Tables Figures
◭ ◮
◭ ◮
Back Close
Full Screen / Esc
Printer-friendly Version
Interactive Discussion
Discussion
P
a
per
|
Discussion
P
a
per
|
Discussion
P
a
per
|
Discussion
P
a
per
|
Atmos. Chem. Phys. Discuss., 15, 31025–31051, 2015 www.atmos-chem-phys-discuss.net/15/31025/2015/ doi:10.5194/acpd-15-31025-2015
© Author(s) 2015. CC Attribution 3.0 License.
This discussion paper is/has been under review for the journal Atmospheric Chemistry and Physics (ACP). Please refer to the corresponding final paper in ACP if available.
A Joint data record of tropospheric ozone
from Aura-TES and MetOp-IASI
H. Oetjen1,2, V. H. Payne1, J. L. Neu1, S. S. Kulawik1,3, D. P. Edwards4, A. Eldering1,2, H. M. Worden4, and J. R. Worden1
1
Jet Propulsion Laboratory, California Institute of Technology, Pasadena, California, USA
2
The UCLA/JPL Joint Institute for Regional Earth System Science and Engineering, Los Angeles, California, USA
3
BAER Institute, Mountain View, California, USA
4
National Center for Atmospheric Research, Boulder, Colorado, USA
Received: 17 September 2015 – Accepted: 19 October 2015 – Published: 6 November 2015
Correspondence to: V. H. Payne ([email protected])
ACPD
15, 31025–31051, 2015A Joint data record of tropospheric ozone
from Aura-TES and MetOp-IASI
H. Oetjen et al.
Title Page
Abstract Introduction
Conclusions References
Tables Figures
◭ ◮
◭ ◮
Back Close
Full Screen / Esc
Printer-friendly Version
Interactive Discussion
Discussion
P
a
per
|
Discussion
P
a
per
|
Discussion
P
a
per
|
Discussion
P
a
per
|
Abstract
The Tropospheric Emission Spectrometer (TES) on Aura and Infrared Atmospheric Sounding Interferometer (IASI) on MetOp-A together provide a time series of ten years of free-tropospheric ozone with an overlap of three years. We characterise the diff er-ences between TES and IASI ozone measurements and find that IASI’s coarser vertical
5
sensitivity leads to a small (<5 ppb) low bias relative to TES for the free troposphere.
The TES-IASI differences are not dependent on season or any other factor and hence
the measurements from the two instruments can be merged, after correcting for the off -set, in order to study decadal-scale changes in tropospheric ozone. We calculate time series of regional monthly mean ozone in the free troposphere over Eastern Asia, the
10
Western United States (US), and Europe, carefully accounting for differences in spatial sampling between the instruments. We show that free-tropospheric ozone over Europe and the Western US has remained relatively constant over the past decade, but that, contrary to expectations, ozone over Asia in recent years does not continue the rapid rate of increase observed from 2004–2010.
15
1 Introduction
Tropospheric ozone adversely impacts human health and ecosystems at the Earth’s surface, and plays a key role in photochemistry throughout the troposphere. Ozone also acts as a greenhouse gas in the upper troposphere (e.g. Gauss et al., 2003; Worden et al., 2008; Bowman and Henze, 2012). Sources of tropospheric ozone include
photo-20
chemical production from non-methane volatile organic compounds (NMVOCs) and
carbon monoxide (CO) in the presence of nitrogen oxide radicals (NOx) as well as
transport from the stratosphere into the troposphere (e.g. Worden et al., 2009; Young et al., 2013; Neu et al., 2014).
The lifetime of ozone in the free troposphere is on the order of several weeks (e.g.
25
ACPD
15, 31025–31051, 2015A Joint data record of tropospheric ozone
from Aura-TES and MetOp-IASI
H. Oetjen et al.
Title Page
Abstract Introduction
Conclusions References
Tables Figures
◭ ◮
◭ ◮
Back Close
Full Screen / Esc
Printer-friendly Version
Interactive Discussion
Discussion
P
a
per
|
Discussion
P
a
per
|
Discussion
P
a
per
|
Discussion
P
a
per
|
in transport can have implications for tropospheric ozone concentrations on a global scale. In recent years, rapid urbanisation and industrialisation in China have led to large changes in ozone precursor emissions. Measurements over Asia have shown ozone increasing in the decade leading up to 2010 (e.g. Tanimoto et al., 2009; Wang et al., 2012; Lee et al., 2014). Increases in NOx(for NO2see e.g. van der A et al., 2008;
5
Hilboll et al., 2013) and NMVOCs (for formaldehyde see De Smedt et al., 2009) – as well as tropospheric ozone (Beig and Singh, 2007) – have been observed from space, although CO has been shown to be decreasing over China (Worden et al., 2013).
Emissions from China dominate the Asian pollutant outflow (e.g. Zhang et al., 2009). Several studies report trans-Pacific transport of pollution plumes (e.g. Zhang et al.,
10
2008; Singh et al., 2009). With increasing Asian pollution, an enhancement of ozone concentrations in the Western US is expected (Jiang et al., 2015). Several model stud-ies (e.g. Jacob et al., 1999; Wild and Akimoto, 2001; Fiore et al., 2009; Reidmiller et al., 2009; Lin et al., 2012; Fry et al., 2013, 2014) evaluated the intercontinental impact of ozone precursors emissions in mid-latitude industrial areas on the ozone
concentra-15
tions in downwind regions. Increases in Asian pollution have previously been assumed to be associated with positive trends in ozone in the Western US (Jaffe and Ray, 2007; Parrish et al., 2009; Cooper et al., 2010; Verstraeten et al., 2015).
Pollutant trends for Europe and Northern America do not provide such a consistent picture. Ebojie et al. (2015) have found negative albeit not significant trends of
tropo-20
spheric ozone columns over the Western US analysing SCIAMACHY measurements for the period of 2003 to 2011. On the other hand, parts of Europe show a significant negative trend in the SCIAMACHY data (Ebojie et al., 2015). Cooper et al. (2014) com-piled ground-based surface ozone measurements and lowermost tropospheric mea-surements from aircraft and ozone sondes and calculated trends beginning 1990–1999
25
ACPD
15, 31025–31051, 2015A Joint data record of tropospheric ozone
from Aura-TES and MetOp-IASI
H. Oetjen et al.
Title Page
Abstract Introduction
Conclusions References
Tables Figures
◭ ◮
◭ ◮
Back Close
Full Screen / Esc
Printer-friendly Version
Interactive Discussion
Discussion
P
a
per
|
Discussion
P
a
per
|
Discussion
P
a
per
|
Discussion
P
a
per
|
not show a positive trend from about 2000 onwards. NO2 tropospheric columns have
been reported to decrease over North America and Europe (e.g. Hillboll et al., 2013). The Tropospheric Emission Spectrometer (TES), launched on-board the Aura satel-lite in 2004, was specifically designed to measure tropospheric ozone by means of fine
spectral resolution (0.1 cm−1) radiance measurements in the thermal infrared.
How-5
ever, the near-global TES record of tropospheric ozone ended in 2011 when the TES
observing strategy shifted away from routineglobal surveymeasurements in order to
focus on special observations over select regions, to preserve the lifetime of the in-strument. The Infrared Atmospheric Sounding Instruments (IASI), flying on the MetOp satellites since the launch of MetOp-A in 2007 and continuing with Metop-B in 2012,
10
are designed for both atmospheric composition and numerical weather prediction ap-plications (Clerbaux et al., 2009). Although the spectral resolution of the IASI
measure-ments, at 0.5 cm−1, is coarser than TES, IASI retrievals have been shown to provide
a wealth of useful information on tropospheric ozone (e.g. Dufour et al., 2010; Safied-dine et al., 2013; Oetjen et al., 2014). The IASI instruments offer the dual advantages
15
of extensive spatial coverage and a record that is assured to continue well into the future with the launch of the Metop-C platform in 2018. Here we show that TES and IASI ozone measurements can be combined and used to investigate changes in tro-pospheric ozone over the past decade, with a focus on Eastern Asia, the Western US and Europe.
20
2 Satellite measurements of tropospheric ozone from TES and IASI:
observations and retrieval approach
IASI-1 flies in a sun-synchronous orbit on MetOp-A. The local overpass times at the equator are 09:30 and 21:30 LT. IASI is a scanning instrument and achieves global coverage twice daily. At nadir, the footprint is a circle with 12 km diameter, while on
25
ACPD
15, 31025–31051, 2015A Joint data record of tropospheric ozone
from Aura-TES and MetOp-IASI
H. Oetjen et al.
Title Page
Abstract Introduction
Conclusions References
Tables Figures
◭ ◮
◭ ◮
Back Close
Full Screen / Esc
Printer-friendly Version
Interactive Discussion
Discussion
P
a
per
|
Discussion
P
a
per
|
Discussion
P
a
per
|
Discussion
P
a
per
|
surface footprint of 5.3 km×8.3 km. TES orbits are separated by 22◦ longitude and in
the nominal observation mode (which is used in this study, and calledglobal survey),
measurements are taken every 182 km along the flight track. The equator crossing times are 01:45 and 13:45 LT. TES has a spectral resolution of 0.1 cm−1full-width
half-maximum (FWHM) and a spectral sampling of 0.06 cm−1. IASI measures with a coarser
5
resolution of 0.5 cm−1 FWHM and a sampling of 0.25 cm−1, resulting in slightly less vertical information for the trace gas retrievals (Oetjen et al., 2014). The noise equiva-lent differential temperatures are 0.15 at 280 K and 0.3 at 300 K for IASI and TES, re-spectively. In this work, the TES optimal estimation retrieval algorithm (Bowman et al., 2002, 2006) has been applied to the IASI radiances in order to maintain consistency
10
between the records in terms of a priori constraints and retrieval method. One diff er-ence we maintain is that for TES, temperature, clouds, and emissivity, all important parameters for an accurate ozone retrieval, are also retrieved with the TES algorithm in steps before the actual ozone analysis. For IASI, we use the operational EUMETSAT level 2 data for temperature and clouds and we use the Zhou climatology for
emissiv-15
ity (Zhou et al., 2011). For TES, we use the publicly available V05 level 2 Lite data (http://tes.jpl.nasa.gov/data/). Details for the retrievals can be found in (Bowman et al., 2006; Kulawik et al., 2006; Oetjen et al., 2014).
3 Construction of a combined ozone record
Combining TES and IASI measurements into a merged time series requires careful
20
ACPD
15, 31025–31051, 2015A Joint data record of tropospheric ozone
from Aura-TES and MetOp-IASI
H. Oetjen et al.
Title Page
Abstract Introduction
Conclusions References
Tables Figures
◭ ◮
◭ ◮
Back Close
Full Screen / Esc
Printer-friendly Version
Interactive Discussion
Discussion
P
a
per
|
Discussion
P
a
per
|
Discussion
P
a
per
|
Discussion
P
a
per
|
3.1 Characterisation of retrieval profile differences
Estimates of tropospheric ozone based on IASI radiances and the TES optimal esti-mation algorithm (IASI-TOE) have been validated against sonde data in previous work; details of the prior constraints, retrieval levels and spectral windows, as well as the predicted and actual errors and the biases with respect to the sondes, can be found
5
in Oetjen et al. (2014). Biases of TES ozone with respect to ozonesondes are inves-tigated in Verstraeten et al. (2013). Both instruments show a similar positive bias in the upper troposphere/lower stratosphere in comparison to sondes. This bias is be-lieved to originate from incorrect spectroscopic parameters (e.g. Oetjen et al., 2014).
Here, we quantify differences between TES and IASI-TOE ozone in order to assess
10
the feasibility of merging the time series of the two instruments. We select four TES global surveys (GSs) approximately three months apart (3–4 August 2008, 1–2 Novem-ber 2008, 17–18 February 2009, 26–27 May 2009; a GS takes about 26 h and these were chosen since they had the highest number of successful retrievals in the cor-responding months) and compare the ozone profiles and retrieval sensitivities with
15
co-located IASI-TOE retrievals. The coincidence criteria are 55 km (corresponding to 0.5◦ latitude) and 5 h. The time difference, which is larger than typically used for defin-ing coincident trace gas profiles, is driven by the different overpass times of the Aura and MetOp-A satellites. TES scenes with an average cloud optical depth of 0.1 or less and IASI scenes with a cloud fraction of 6 % or less are included. Further for TES, the
20
data were filtered by the retrieval quality and the C-curve flags (see TES user guides, http://tes.jpl.nasa.gov/documents/) and IASI was limited to retrievals with aχ2less than 1.3 (see Oetjen et al., 2014). Because of IASI’s dense sampling, there can be multiple IASI co-locations for a TES scene. Overall, there are 3992 IASI measurements and 745 TES measurements for the four TES global surveys. Results of the TES-IASI
com-25
ACPD
15, 31025–31051, 2015A Joint data record of tropospheric ozone
from Aura-TES and MetOp-IASI
H. Oetjen et al.
Title Page
Abstract Introduction
Conclusions References
Tables Figures
◭ ◮
◭ ◮
Back Close
Full Screen / Esc
Printer-friendly Version
Interactive Discussion
Discussion
P
a
per
|
Discussion
P
a
per
|
Discussion
P
a
per
|
Discussion
P
a
per
|
kernel (AK) matrices and of ozone along with their standard deviations, respectively. The TES sensitivity is slightly better than IASI throughout most of the atmosphere as expected due to the finer spectral resolution of TES compared to IASI. The differences in the sensitivity are likely the reason for the different ozone profile shapes for TES and IASI-TOE; while the mean IASI-TOE ozone follows the general shape of the a priori
5
profile (although not its absolute values), the mean TES profile shape deviates from the a priori profile shape in the mid- and upper-troposphere. The large standard de-viation on the ozone profile in the stratosphere results from the rather large latitudinal
range that is covered by the measurements: 50◦S–80◦N. This also includes some
pro-files affected by the ozone hole at high latitude. The relative differences are shown in
10
panels c and d, plotted as the mean of the individual differences. On average, IASI
ozone abundances are less than those from TES between the surface and∼250 hPa,
with a maximum difference of −13 % at 500 hPa. Above 250 hPa, IASI-TOE ozone is
greater than TES ozone, with a maximum difference of 8 % at about 150 hPa. Note that
the differences between IASI-TOE and TES approach zero at the surface and towards
15
the top at the atmosphere because the retrievals essentially return the a priori in these regions due to the low sensitivities. The IASI-TOE precision in the free troposphere was estimated to be better than 20 % (Oetjen et al., 2014). TES precision in the free troposphere has previously been shown to be 10–15 % (Boxe et al., 2010). Therefore TES and IASI-TOE ozone profiles agree well within their respective uncertainties.
20
3.2 Characterisation of differences for column-averaged mixing ratios
In the following, we present results on column-average mixing ratios between 681 and 316 hPa, a range where both the TES and IASI-TOE ozone retrievals show good sen-sitivity. This range includes 5 retrieval vertical grid points and the data is the same collocated data as in Sect. 3.1.
25
The differences between TES and IASI partial column mean mixing ratios as a
diam-ACPD
15, 31025–31051, 2015A Joint data record of tropospheric ozone
from Aura-TES and MetOp-IASI
H. Oetjen et al.
Title Page
Abstract Introduction
Conclusions References
Tables Figures
◭ ◮
◭ ◮
Back Close
Full Screen / Esc
Printer-friendly Version
Interactive Discussion
Discussion
P
a
per
|
Discussion
P
a
per
|
Discussion
P
a
per
|
Discussion
P
a
per
|
eter of the symbols is proportional to the mean IASI-TOE ozone mixing ratio. Although the sensitivity of the ozone retrievals depends on the amount of ozone itself and al-though there is a wide range of the (IASI−TES) differences, these differences appear to be independent of the sensitivity and the actual ozone amount (see Fig. 2). Apart from instrument specifications, the sensitivity of infrared instruments towards ozone
5
depends on the atmospheric and surface temperatures, water vapour amount, residual cloud contamination, surface emissivity, and the amount of ozone itself. Collocated re-trievals should all be affected in a similar way by these external parameters. However, the instrumental difference in the spectral resolution of TES and IASI results in different weighting functions that gives a simple offset between the ozone retrievals.
10
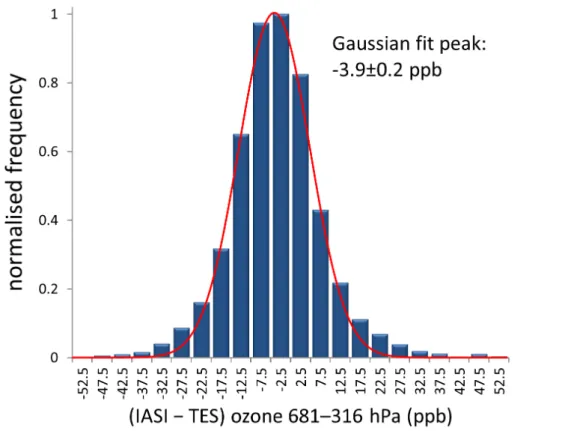
The normalised frequency distribution of the offset of the data of Fig. 2 is shown in
Fig. 3. The distribution of the difference between TES and IASI-TOE follows roughly
a Gaussian function with the maximum at (−3.9±0.2) ppb. For merging the TES and
IASI-TOE data series, only the location of the peak value is important. The width of the frequency distribution is determined by the precision of the measurements and
15
the collocation error. The points with very large IASI-TOE differences are generally
associated with large IASI-TOE ozone values. Most likely, this is symptomatic of the loose temporal coincidence criterion. Atmospheric phenomena that cause very high ozone in the free troposphere (e.g. biomass burning or stratospheric intrusions) often occur on time scales shorter than 5 h.
20
3.3 Sampling considerations
Between 2004 and 2011, the nominal mode of TES operation involved GSs with regular sampling over the globe. In 2011, the TES observing strategy shifted away from routine GS measurements in order to focus on special observations over select regions, to preserve the lifetime of the instrument. IASI-1, on MetOp-A, has been operational since
25
ACPD
15, 31025–31051, 2015A Joint data record of tropospheric ozone
from Aura-TES and MetOp-IASI
H. Oetjen et al.
Title Page
Abstract Introduction
Conclusions References
Tables Figures
◭ ◮
◭ ◮
Back Close
Full Screen / Esc
Printer-friendly Version
Interactive Discussion
Discussion
P
a
per
|
Discussion
P
a
per
|
Discussion
P
a
per
|
Discussion
P
a
per
|
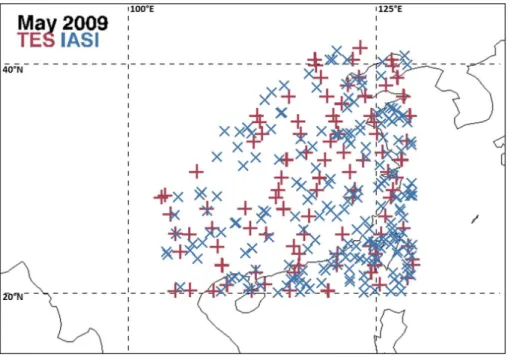
IASI data is not currently routinely processed through the TES algorithm, which was originally set up for relatively small TES-like, rather than IASI-like, data volumes. There-fore, for this work we choose to process a subset of IASI scenes over selected regions of interest (ROIs – shown in Fig. 4) for the construction of the combined time series. We evaluate the consistency of the TES and IASI-1 monthly mean column-average mixing
5
ratios for these ROIs, using the overlap between datasets in the years 2008–2011. Compared to IASI, the TES sampling is sparse. One approach to constructing the time series would be to restrict the data to collocated TES and IASI points, for cases where both are deemed to be sufficiently clear-sky. However, we find that this approach leads to an unacceptable reduction in the number of TES data points (see below).
10
Therefore, we instead choose to sub-sample the IASI data over the ROIs without the requirement of co-location with TES points. The impact of the IASI sub-sampling is explored below.
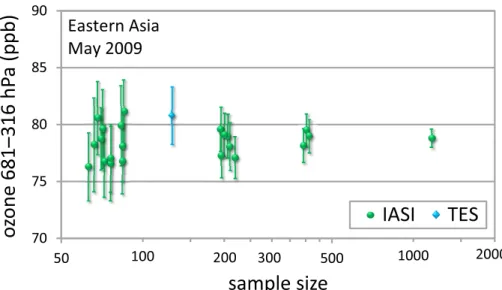
IASI scenes with sample sizes ranging from 50 to 2000 were randomly selected within the Eastern Asia ROI for May 2009. The resulting monthly mean ozone is
pre-15
sented in Fig. 5. The error bars are the 95 % confidence limits CL for the meanxmean, assuming a normal distribution calculated from:
CL=xmean±1.96√σ
N
(1)
withσ being the sample standard deviation andN the sample size. These confidence
limits for the monthly mean are an approximation since ozone itself is neither temporally
20
nor spatially uncorrelated in the atmosphere. The actual sample standard deviation (not shown) does not change with the sample size and hence the confidence limits vary with the square-root of the sample size only. This indicates that it is valid to assume a normal distribution for the ozone, at least for the given example. We conclude that a sample of 200 IASI scenes is sufficient for an uncertainty of 1.9 ppb or better for an
25
ACPD
15, 31025–31051, 2015A Joint data record of tropospheric ozone
from Aura-TES and MetOp-IASI
H. Oetjen et al.
Title Page
Abstract Introduction
Conclusions References
Tables Figures
◭ ◮
◭ ◮
Back Close
Full Screen / Esc
Printer-friendly Version
Interactive Discussion
Discussion
P
a
per
|
Discussion
P
a
per
|
Discussion
P
a
per
|
Discussion
P
a
per
|
series (see Sect. 4). The areas of the Western US and Europe ROIs scale by a factor of 1.28 and 1.20, respectively, and we are aiming to sample at least 250 scenes for those ROIs. In many cases, larger sample sizes have been used. This is due to the fact that a larger number than the number of target scenes is selected first and then the actual throughput of successfully retrieved ozone profiles depends on the quality
5
screening (see Fig. S1 in the Supplement for the sample sizes). On average for all the years in the time series below, the IASI limits of confidence are 1.9, 1.7, and 1.5 ppb for the Eastern Asia, Western US, and Europe ROI, respectively. In the example shown in Fig. 5, the TES confidence limit is 2.3 ppb for 128 scenes. In general, there are less TES scenes than IASI scenes and the average confidence limit for all ROIs for TES
10
monthly mean ozone is 2.6 ppb. The degrees of freedom for signal for both TES and IASI for the considered altitude range are between 0.7 and 0.8. An example for the spatial distribution of the satellite scenes is presented in Fig. 6 for 206 IASI data points.
4 Results
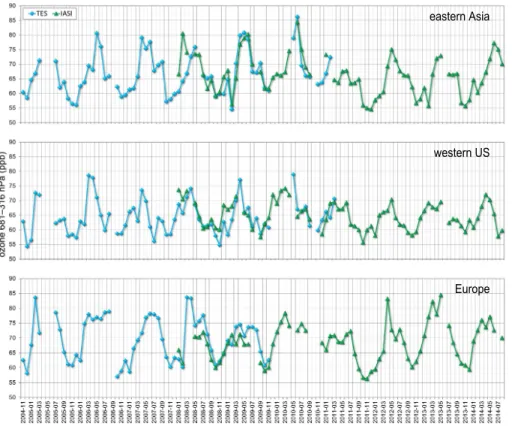
Figure 7 shows the time series of partial column ozone for the 3 ROIs. In these figures,
15
the IASI monthly means have been adjusted by a constant value of+3.9 ppb based
on our analysis in Sect. 3.2. There is an overlap of about 3 years between TES and IASI for Eastern Asia and the Western US ROIs. Over Europe, the overlap is only
∼2 years because the latitude range of the TES GSs was limited to 30◦S–50◦N from
2010 onward. Here, the cloud screening thresholds are 2.0 for the TES average cloud
20
optical depth and 13 % cloud fraction for IASI scenes.
Data gaps in the time series occur for several reasons. Data has been removed if an instrument has missing data for more than a week of any given month or if the ROI is not completely sampled spatially by an instrument. Also, since the IASI data is chosen with a random number generator from all of the available scenes, if the initial distribution
25
ACPD
15, 31025–31051, 2015A Joint data record of tropospheric ozone
from Aura-TES and MetOp-IASI
H. Oetjen et al.
Title Page
Abstract Introduction
Conclusions References
Tables Figures
◭ ◮
◭ ◮
Back Close
Full Screen / Esc
Printer-friendly Version
Interactive Discussion
Discussion
P
a
per
|
Discussion
P
a
per
|
Discussion
P
a
per
|
Discussion
P
a
per
|
the rest of the month or region. This data is removed as well. TES and IASI agree well for the overlap period; differences are mostly within the range of less than 4.5 ppb as expected from the calculated confidence limits (see Sect. 3.3). In particular, Eastern Asia shows very good agreement between TES and IASI-TOE ozone for 2008–2011, giving confidence in the consistency of the time series. There are a few cases where
5
IASI ozone exceeds TES ozone by more than the confidence limits of the monthly mean, e.g. February 2008 for Eastern Asia or January 2009 for the Western US ROI. These instances can be traced back to some localised enhanced ozone which was not detected by TES’ coarser sampling and in these cases the required condition for randomness for using Eq. (1) is not fulfilled. The variation over the 10 years of data is
10
dominated by the seasonal cycle.
Figure 8 shows the deseasonalised time series for the 3 ROIs, in order to better show the long-term variations in ozone for the 2004–2014 time period. We remove the seasonal variation by calculating the mean ozone over all of the years for each month and subtracting this mean from the respective months in the time series. For the years
15
where TES and IASI overlap, the mean of the 2 data points is used. From Novem-ber 2004 to May 2005, TES measured with a somewhat sparser sampling pattern than the period after May 2005 and consequently the error on the monthly mean is larger for this portion of the time series because there are fewer data points to average (see Fig. S1). This data was excluded from the calculation of the overall monthly mean used
20
to deseasonalise the data.
As seen in Fig. 8, ozone over Eastern Asia rose relatively steadily from 2004–2010, but dropped suddenly in 2011. This is also clearly apparent when looking only at the annual maxima in Fig. 7. While ozone has been somewhat increasing once again since 2011, a clear upward trend is not observed and ozone has also not yet reached
pre-25
ACPD
15, 31025–31051, 2015A Joint data record of tropospheric ozone
from Aura-TES and MetOp-IASI
H. Oetjen et al.
Title Page
Abstract Introduction
Conclusions References
Tables Figures
◭ ◮
◭ ◮
Back Close
Full Screen / Esc
Printer-friendly Version
Interactive Discussion
Discussion
P
a
per
|
Discussion
P
a
per
|
Discussion
P
a
per
|
Discussion
P
a
per
|
in all three regions (for example, high ozone in spring 2008 and high ozone in 2010 followed by lower ozone in 2011).
5 Summary and discussion
We have assessed the consistency between time series of tropospheric ozone from TES and IASI-TOE retrievals, using a consistent retrieval algorithm applied to the
ra-5
diances of both instruments. TES exhibits slightly better sensitivity than IASI, due to the finer spectral resolution of the TES instrument. Despite the small differences in sensitivity, the time series of the 681–316 hPa partial column-averaged ozone mixing ratios show good agreement for the years 2008–2011, after the removal of a constant −3.9 ppb offset from TES in the IASI-TOE record.
10
Combined TES and IASI monthly-mean time series were constructed for three re-gions of interest: Eastern Asia, the Western US and Europe. Ozone has remained relatively constant over the Western US and Europe over the past decade, and ozone changes in those regions are dominated by seasonal and interannual variability. The deseasonalised time series for Eastern Asia, on the other hand, shows an overall
in-15
crease between 2004 and 2010, with a drop in 2011 followed by a slow or no increase through 2014. Somewhat surprisingly, ozone over Eastern Asia has not yet returned to pre-2011 levels. To the best of our knowledge, only one study, by Chen et al. (2014),
suggests that the rapid increase in ozone over Asia may have levelled-off in recent
years. That study, however, focused on Taiwan and found that a change in the slope of
20
the ozone trend from 1994–2012 occurred in 2007. The complex temporal changes in ozone over Eastern Asia show that ozone changes driven by changing concentrations of precursor gases and other sources, such as stratosphere–troposphere-exchange, still need to be better-understood in the context of long-term trends and prognoses. Understanding what drives changes in ozone over Eastern Asia is particularly critical
25
increas-ACPD
15, 31025–31051, 2015A Joint data record of tropospheric ozone
from Aura-TES and MetOp-IASI
H. Oetjen et al.
Title Page
Abstract Introduction
Conclusions References
Tables Figures
◭ ◮
◭ ◮
Back Close
Full Screen / Esc
Printer-friendly Version
Interactive Discussion
Discussion
P
a
per
|
Discussion
P
a
per
|
Discussion
P
a
per
|
Discussion
P
a
per
|
ing ozone from Asia may contribute to non-attainment of EPA air quality standard in the future (e.g. Hudman et al., 2004).
The Supplement related to this article is available online at doi:10.5194/acpd-15-31025-2015-supplement.
Acknowledgements. We acknowledge the NOAA/CLASS data centre for the IASI Level 1c 5
spectra and EUMETSAT for the Level 2 data. IASI is a joint mission of EUMETSAT and the Centre National d’Études Spatiales (CNES, France). Part of the research was carried out at the Jet Propulsion Laboratory, California Institute of Technology, under a contract with the Na-tional Aeronautics and Space Administration. We acknowledge NASA support under the grant NNX11AE19G.
10
References
Beig, G. and Singh, V.: Trends in tropical tropospheric column ozone from satellite data and MOZART model, Geophys. Res. Lett., 34, L17801, doi:10.1029/2007GL030460, 2007. Bowman, K. and Henze, D. K.: Attribution of direct ozone radiative forcing to spatially resolved
emissions, Geophys. Res. Lett., 39, L22704, doi:10.1029/2012GL053274, 2012. 15
Bowman, K. W., Worden, J., Steck, T., Worden, H. M., Clough, S., and Rodgers, C.: Capturing time and vertical variability of tropospheric ozone: a study using TES nadir retrievals, J. Geophys. Res., 107, 4723, doi:10.1029/2002JD002150, 2002.
Bowman, K. W., Rodgers, C. D., Kulawik, S. S., Worden, J., Sarkissian, E., Osterman, G., Steck, T., Lou, M., Eldering, A., Shephard, M., Worden, H., Lampel, M., Clough, S., 20
Brown, P., Rinsland, C., Gunson, M., and Beer, R.: Tropospheric emission spectrom-eter: retrieval method and error analysis, IEEE T. Geosci. Remote, 44, 1297–1307, doi:10.1109/tgrs.2006.871234, 2006.
Boxe, C. S., Worden, J. R., Bowman, K. W., Kulawik, S. S., Neu, J. L., Ford, W. C., Oster-man, G. B., HerOster-man, R. L., Eldering, A., Tarasick, D. W., Thompson, A. M., Doughty, D. C., 25
ACPD
15, 31025–31051, 2015A Joint data record of tropospheric ozone
from Aura-TES and MetOp-IASI
H. Oetjen et al.
Title Page
Abstract Introduction
Conclusions References
Tables Figures
◭ ◮
◭ ◮
Back Close
Full Screen / Esc
Printer-friendly Version
Interactive Discussion
Discussion
P
a
per
|
Discussion
P
a
per
|
Discussion
P
a
per
|
Discussion
P
a
per
|
Spectrometer stare ozone profiles with ARC-IONS sondes during ARCTAS: sensitivity, bias and error analysis, Atmos. Chem. Phys., 10, 9901–9914, doi:10.5194/acp-10-9901-2010, 2010.
Chen, S.-P., Chang, C.-C., Liu, J.-J., Chou, C. C.-K., Chang, J. S., and Wang, J.-L.: Recent improvement in air quality as evidenced by the island-wide monitoring network in Taiwan, 5
Atmos. Environ., 96, 70–77, doi:10.1016/j.atmosenv.2014.06.060, 2014.
Clerbaux, C., Boynard, A., Clarisse, L., George, M., Hadji-Lazaro, J., Herbin, H., Hurtmans, D., Pommier, M., Razavi, A., Turquety, S., Wespes, C., and Coheur, P.-F.: Monitoring of atmo-spheric composition using the thermal infrared IASI/MetOp sounder, Atmos. Chem. Phys., 9, 6041–6054, doi:10.5194/acp-9-6041-2009, 2009.
10
Cooper, O. R., Parrish, D. D., Stohl, A., Trainer, M., Nedelec, P., Thouret, V., Cammas, J. P., Oltmans, S. J., Johnson, B. J., Tarasick, D., Leblanc, T., McDermid, I. S., Jaffe, D., Gao, R., Stith, J., Ryerson, T., Aikin, K., Campos, T., Weinheimer, A., and Avery, M. A.: Increasing springtime ozone mixing ratios in the free troposphere over western North America, Nature, 463, 344–348, doi:10.1038/nature08708, 2010.
15
Cooper, O. R., Parrish, D. D., Ziemke, J., Balashov, N. V., Cupeiro, M., Galbally, I. E., Gilge, S., Horowitz, L., Jensen, N. R., Lamarque, J.-F., Naik, V., Oltmans, S. J., Schwab, J., Shin-dell, D. T., Thompson, A. M., Thouret, V., Wang, Y., and Zbinden, R. M.: Global distribution and trends of tropospheric ozone: an observation-based revie, Elem. Sci. Anth., 2, 000029 doi:10.12952/journal.elementa.000029, 2014.
20
De Smedt, I., Stavrakou, T., Müller, J.-F., van der A, R. J., and Van Roozendael, M.: Trend detection in satellite observations of formaldehyde tropospheric columns, Geophys. Res. Lett., 37, L18808, doi:10.1029/2010GL044245, 2010.
Dufour, G., Eremenko, M., Orphal, J., and Flaud, J.-M.: IASI observations of seasonal and day-to-day variations of tropospheric ozone over three highly populated areas of China: Beijing, 25
Shanghai, and Hong Kong, Atmos. Chem. Phys., 10, 3787–3801, doi:10.5194/acp-10-3787-2010, 2010.
Ebojie, F., Burrows, J. P., Gebhardt, C., Ladstätter-Weißenmayer, A., von Savigny, C., Rozanov, A., Weber, M., and Bovensmann, H.: Global and zonal tropospheric ozone vari-ations from 2003–2011 as seen by SCIAMACHY, Atmos. Chem. Phys. Discuss., 15, 24085– 30
24130, doi:10.5194/acpd-15-24085-2015, 2015.
Shin-ACPD
15, 31025–31051, 2015A Joint data record of tropospheric ozone
from Aura-TES and MetOp-IASI
H. Oetjen et al.
Title Page
Abstract Introduction
Conclusions References
Tables Figures
◭ ◮
◭ ◮
Back Close
Full Screen / Esc
Printer-friendly Version
Interactive Discussion
Discussion
P
a
per
|
Discussion
P
a
per
|
Discussion
P
a
per
|
Discussion
P
a
per
|
dell, D. T., Stevenson, D. S., Szopa, S., van Dingenen, R., Zeng, G., Atherton, C., Bergmann, D., Bey, I., Carmichael, G., Collins, W. J., Duncan, B. N., Faluvegi, G., Fol-berth, G., Gauss, M., Gong, S., Hauglustaine, D., Holloway, T., Isaksen, I. S. A., Jacob, D. J., Jonson, J. E., Kaminski, J. W., Keating, T. J., Lupu, A., Marmer, E., Montanaro, V., Park, R. J., Pitari, G., Pringle, K. J., Pyle, J. A., Schroeder, S., Vivanco, M. G., Wind, P., Wojcik, G., 5
Wu, S., and Zuber, A.: Multimodel estimates of intercontinental source–receptor relationships for ozone pollution, J. Geophys. Res, 114, D04301, doi:10.1029/2008JD010816, 2009. Fry, M. M., Schwarzkopf, M. D., Adelman, Z., Naik, V., Collins, W. J., and West, J. J.: Net
radiative forcing and air quality responses to regional CO emission reductions, Atmos. Chem. Phys., 13, 5381–5399, doi:10.5194/acp-13-5381-2013, 2013.
10
Fry, M. M., Schwarzkopf, M. D., Adelman, Z., and West, J. J.: Air quality and radiative forcing im-pacts of anthropogenic volatile organic compound emissions from ten world regions, Atmos. Chem. Phys., 14, 523–535, doi:10.5194/acp-14-523-2014, 2014.
Gauss, M., Myhre, G., Pitari, G., Prather, M. J., Isaksen, I. S. A., Berntsen, T. K., Brasseur, G. P., Dentener, F. J., Derwent, R. G., Hauglustaine, D. A., Horowitz, L. W., Jacob, D. J., John-15
son, M., Law, K. S., Mickley, L. J., Muller, J.-F., Plantevin, P.-H., Pyle, J. A., Rogers, H. L., Stevenson, D. S., Sundet, J. K., van Weele, M., and Wild, O.: Radiative forcing in the 21st century due to ozone changes in the troposphere and the lower stratosphere, J. Geophys. Res., 108, 4292, doi:10.1029/2002JD002624, 2003.
Hilboll, A., Richter, A., and Burrows, J. P.: Long-term changes of tropospheric NO2 over 20
megacities derived from multiple satellite instruments, Atmos. Chem. Phys., 13, 4145–4169, doi:10.5194/acp-13-4145-2013, 2013.
Hudman, R. C., Jacob, D. J., Cooper, O. R., Evans, M. J., Heald, C. L., Park, R. J., Fehsen-feld, F., Flocke, F., Holloway, J., Hübler, G., Kita, K., Koike, M., Kondo, Y., Neuman, A., Nowak, J., Oltmans, S., Parrish, D., Roberts, J. M., and Ryerson, T.: Ozone production in 25
transpacific Asian pollution plumes and implications for ozone air quality in California, J. Geophys. Res., 109, D23S10, doi:10.1029/2004JD004974, 2004.
Jacob, D. J., Logan, J. A., and Murti, P. P.: Effect of rising Asian emissions on surface ozone in the United States, J. Geophys. Res., 26, 2175–2178, 1999.
Jaffe, D. and Ray, J.: Increase in surface ozone at rural sites in the western US, Atmos. Environ., 30
ACPD
15, 31025–31051, 2015A Joint data record of tropospheric ozone
from Aura-TES and MetOp-IASI
H. Oetjen et al.
Title Page
Abstract Introduction
Conclusions References
Tables Figures
◭ ◮
◭ ◮
Back Close
Full Screen / Esc
Printer-friendly Version
Interactive Discussion
Discussion
P
a
per
|
Discussion
P
a
per
|
Discussion
P
a
per
|
Discussion
P
a
per
|
Jiang, Z., Worden, J. R., Jones, D. B. A., Lin, J.-T., Verstraeten, W. W., and Henze, D. K.: Constraints on Asian ozone using Aura TES, OMI and Terra MOPITT, Atmos. Chem. Phys., 15, 99–112, doi:10.5194/acp-15-99-2015, 2015.
Kulawik, S. S., Worden, J., Eldering, A., Bowman, K., Gunson, M., Osterman, G. B., Zhang, L., Clough, S. A., Shephard, M. W., and Beer, R.: Implementation of cloud retrievals for 5
Tropospheric Emission Spectrometer (TES) atmospheric retrievals: part 1. Description and characterization of errors on trace gas retrievals, J. Geophys. Res, 111, D24204, doi:10.1029/2005JD006733, 2006.
Lee, Y. C., Shindell, D. T., Faluvegi, G., Wenig, M., Lam, Y. F., Ning, Z., Hao, S., and Lai, C. S.: In-crease of ozone concentrations, its temperature sensitivity and the precursor factor in South 10
China, Tellus B, 66, 23455, doi:10.3402/tellusb.v66.23455, 2014.
Lin, M., Fiore, A. M., Horowitz, L. W., Cooper, O. R., Naik, V., Holloway, J., Johnson, B. J., Mid-dlebrook, A. M., Oltmans, S. J., Pollack, I. B., Ryerson, T. B., Warner, J. X., Wiedinmyer, C., Wilson, J., and Wyman, B.: Transport of Asian ozone pollution into surface air over the west-ern United States in spring, J. Geophys. Res, 117, D00V07, doi:10.1029/2011JD016961, 15
2012.
Neu, J. L., Flury, T., Manney, G. L., Santee, M. L., Livesey, N. J., and Worden, J.: Tropospheric ozone variations governed by changes in stratospheric circulation, Nat. Geosci., 7, 340–344, doi:10.1038/ngeo2138, 2014.
Oetjen, H., Payne, V. H., Kulawik, S. S., Eldering, A., Worden, J., Edwards, D. P., Francis, G. L., 20
Worden, H. M., Clerbaux, C., Hadji-Lazaro, J., and Hurtmans, D.: Extending the satellite data record of tropospheric ozone profiles from Aura-TES to MetOp-IASI: characterisation of optimal estimation retrievals, Atmos. Meas. Tech., 7, 4223–4236, doi:10.5194/amt-7-4223-2014, 2014.
Parrish, D. D., Millet, D. B., and Goldstein, A. H.: Increasing ozone in marine boundary layer 25
inflow at the west coasts of North America and Europe, Atmos. Chem. Phys., 9, 1303–1323, doi:10.5194/acp-9-1303-2009, 2009.
Reidmiller, D. R., Fiore, A. M., Jaffe, D. A., Bergmann, D., Cuvelier, C., Dentener, F. J., Dun-can, B. N., Folberth, G., Gauss, M., Gong, S., Hess, P., Jonson, J. E., Keating, T., Lupu, A., Marmer, E., Park, R., Schultz, M. G., Shindell, D. T., Szopa, S., Vivanco, M. G., Wild, O., and 30
ACPD
15, 31025–31051, 2015A Joint data record of tropospheric ozone
from Aura-TES and MetOp-IASI
H. Oetjen et al.
Title Page
Abstract Introduction
Conclusions References
Tables Figures
◭ ◮
◭ ◮
Back Close
Full Screen / Esc
Printer-friendly Version
Interactive Discussion
Discussion
P
a
per
|
Discussion
P
a
per
|
Discussion
P
a
per
|
Discussion
P
a
per
|
Safieddine, S., Clerbaux, C., George, M., Hadji-Lazaro, J., Hurtmans, D., Coheur, P.-F., We-spes, C., Loyola, D., Valks, P., and Hao, N.: Tropospheric ozone and nitrogen dioxide mea-surements in urban and rural regions as seen by IASI and GOME-2, J. Geophys. Res.-Atmos., 118, 10, 555–10, 566, doi:10.1002/jgrd.50669, 2013.
Singh, H. B., Brune, W. H., Crawford, J. H., Flocke, F., and Jacob, D. J.: Chemistry and transport 5
of pollution over the Gulf of Mexico and the Pacific: spring 2006 INTEX-B campaign overview and first results, Atmos. Chem. Phys., 9, 2301–2318, doi:10.5194/acp-9-2301-2009, 2009. Stevenson, D., Dentener, F. J., Schultz, M. G., Ellingsen, K., van Noije, T. P. C., Wild, O., Zeng,
G., Amann, M., Atherton, C. S., Bell, N., Bergmann, D. J., Bey, I., Butler, T., Cofala, J., Collins, W. J., Derwent, R. G., Doherty, R., Drevet, J., Eskes, H. J., Fiore, A. M., Gauss, M., Hauglus-10
taine, D. A., Horowitz, L. W., Isaksen, I. S. A., Krol, M. C., Lamarque, J. F., Lawrence, M. G., Montanaro, V., Muller, J. F., Pitari, G., Prather, M. J., Pyle, J. A., Rast, S., Rodriguez, J. M., Sanderson, M. G., Savage, N. H., Shindell, D. T., Strahan, S. E., Sudo, K., and Szopa, S.: Multi-model ensemble simulations of present-day and nearfuture tropospheric ozone, J. Geophys. Res., 111, D08301, doi:10.1029/2005JD006338, 2006.
15
Tanimoto, H., Ohara, T., and Uno, I.: Asian anthropogenic emissions and decadal trends in springtime tropospheric ozone over Japan: 1998–2007, Geophys. Res. Lett., 36, L23802, doi:10.1029/2009GL041382, 2009.
van der A, R. J., Eskes, H. J., Boersma, K. F., van Noije, T. P. C., Van Roozendael, M., De Smedt, I., Peters, D. H. M. U., and Meijer, E. W.: Trends, seasonal variability and dominant 20
NOxsource derived from a ten year record of NO2measured from space, J. Geophys. Res., 113, D04302, doi:10.1029/2007JD009021, 2008.
Verstraeten, W. W., Boersma, K. F., Zörner, J., Allaart, M. A. F., Bowman, K. W., and Wor-den, J. R.: Validation of six years of TES tropospheric ozone retrievals with ozonesonde measurements: implications for spatial patterns and temporal stability in the bias, Atmos. 25
Meas. Tech., 6, 1413–1423, doi:10.5194/amt-6-1413-2013, 2013.
Verstraeten, W. W., Neu, J. L., Williams, J. E., Bowman, K. W., Worden, J. R., and Boersma, K. F.: Rapid increases in tropospheric ozone production and export from China, Nat. Geosci, 8, 690–695, doi:10.1038/ngeo2493, 2015.
Wang, Y., Konopka, P., Liu, Y., Chen, H., Müller, R., Plöger, F., Riese, M., Cai, Z., and Lü, D.: Tro-30
ACPD
15, 31025–31051, 2015A Joint data record of tropospheric ozone
from Aura-TES and MetOp-IASI
H. Oetjen et al.
Title Page
Abstract Introduction
Conclusions References
Tables Figures
◭ ◮
◭ ◮
Back Close
Full Screen / Esc
Printer-friendly Version
Interactive Discussion
Discussion
P
a
per
|
Discussion
P
a
per
|
Discussion
P
a
per
|
Discussion
P
a
per
|
Wild, O. and Akimoto, H.: Intercontinental transport of ozone and its precursors in a three-dimensional global CTM, J. Geophys. Res, 106, 27729–27744, 2001.
Worden, H. M., Bowman, K. W., Worden, J. R., Eldering, A., and Beer, R.: Satellite measure-ments of the clear-sky greenhouse effect from tropospheric ozone, Nat. Geosci., 1, 305–308, doi:10.1038/ngeo182, 2008.
5
Worden, H. M., Deeter, M. N., Frankenberg, C., George, M., Nichitiu, F., Worden, J., Aben, I., Bowman, K. W., Clerbaux, C., Coheur, P. F., de Laat, A. T. J., Detweiler, R., Drummond, J. R., Edwards, D. P., Gille, J. C., Hurtmans, D., Luo, M., Martínez-Alonso, S., Massie, S., Pfis-ter, G., and Warner, J. X.: Decadal record of satellite carbon monoxide observations, Atmos. Chem. Phys., 13, 837–850, doi:10.5194/acp-13-837-2013, 2013.
10
Worden, J., Kulawik, S. S., Shepard, M., Clough, S., Worden, H., Bowman, K., and Goldman, A.: Predicted errors of tropospheric emission spectrometer nadir retrievals from spectral window selection, J. Geophys. Res., 109, D09308, doi:10.1029/2004JD004522, 2004.
Worden, J., Jones, D. B. A., Liu, J., Parrington, M., Bowman, K., Stajner, I., Beer, R., Jiang, J., Thouret, V., Kulawik, S., Li, J.-L. F., Verma, S., and Worden, H.: Observed vertical distribu-15
tion of tropospheric ozone during the Asian summertime monsoon, J. Geophys. Res, 114, D13304, doi:10.1029/2008JD010560, 2009.
Young, P. J., Archibald, A. T., Bowman, K. W., Lamarque, J.-F., Naik, V., Stevenson, D. S., Tilmes, S., Voulgarakis, A., Wild, O., Bergmann, D., Cameron-Smith, P., Cionni, I., Collins, W. J., Dalsøren, S. B., Doherty, R. M., Eyring, V., Faluvegi, G., Horowitz, L. W., 20
Josse, B., Lee, Y. H., MacKenzie, I. A., Nagashima, T., Plummer, D. A., Righi, M., Rum-bold, S. T., Skeie, R. B., Shindell, D. T., Strode, S. A., Sudo, K., Szopa, S., and Zeng, G.: Pre-industrial to end 21st century projections of tropospheric ozone from the Atmospheric Chemistry and Climate Model Intercomparison Project (ACCMIP), Atmos. Chem. Phys., 13, 2063–2090, doi:10.5194/acp-13-2063-2013, 2013.
25
Zhang, L., Jacob, D. J., Boersma, K. F., Jaffe, D. A., Olson, J. R., Bowman, K. W., Worden, J. R., Thompson, A. M., Avery, M. A., Cohen, R. C., Dibb, J. E., Flock, F. M., Fuelberg, H. E., Huey, L. G., McMillan, W. W., Singh, H. B., and Weinheimer, A. J.: Transpacific transport of ozone pollution and the effect of recent Asian emission increases on air quality in North America: an integrated analysis using satellite, aircraft, ozonesonde, and surface observa-30
tions, Atmos. Chem. Phys., 8, 6117–6136, doi:10.5194/acp-8-6117-2008, 2008.
ACPD
15, 31025–31051, 2015A Joint data record of tropospheric ozone
from Aura-TES and MetOp-IASI
H. Oetjen et al.
Title Page
Abstract Introduction
Conclusions References
Tables Figures
◭ ◮
◭ ◮
Back Close
Full Screen / Esc
Printer-friendly Version
Interactive Discussion
Discussion
P
a
per
|
Discussion
P
a
per
|
Discussion
P
a
per
|
Discussion
P
a
per
|
emissions in 2006 for the NASA INTEX-B mission, Atmos. Chem. Phys., 9, 5131–5153, doi:10.5194/acp-9-5131-2009, 2009.
Zhou, D. K., Larar, A. M., Liu, X., Smith, W. L., Strow, L. L., Yang, P., Schlüssel, P., and Cal-bet, X.: Global land surface emissivity retrieved from satellite ultraspectral IR measurements, IEEE T. Geosci. Remote, 49, 1277–1290, doi:10.1109/tgrs.2010.2051036, 2011.
ACPD
15, 31025–31051, 2015A Joint data record of tropospheric ozone
from Aura-TES and MetOp-IASI
H. Oetjen et al.
Title Page
Abstract Introduction
Conclusions References
Tables Figures
◭ ◮
◭ ◮
Back Close
Full Screen / Esc
Printer-friendly Version
Interactive Discussion
Discussion
P
a
per
|
Discussion
P
a
per
|
Discussion
P
a
per
|
Discussion
P
a
per
|
-50 -40 -30 -20 -10 0 10 20 30 40 50 60 70
1 2 3 4 5 6
(I
A
S
I
−
T
E
S
)
o
zo
n
e
6
8
1
–
3
1
6
h
P
a
(
p
p
b
)
IASI sum of AK matrix 681–316 hPa
marker diameter: IASI ozone (ppb)
30
50 70 90
110 130
150
ACPD
15, 31025–31051, 2015A Joint data record of tropospheric ozone
from Aura-TES and MetOp-IASI
H. Oetjen et al.
Title Page
Abstract Introduction
Conclusions References
Tables Figures
◭ ◮
◭ ◮
Back Close
Full Screen / Esc
Printer-friendly Version
Interactive Discussion
Discussion
P
a
per
|
Discussion
P
a
per
|
Discussion
P
a
per
|
Discussion
P
a
per
|
70 75 80 85 90
50 500
o
zo
n
e
6
8
1
–
3
1
6
h
P
a
(
p
p
b
)
sample size
IASI
TES
Eastern Asia
May 2009
200 300
100 1000 2000
ACPD
15, 31025–31051, 2015A Joint data record of tropospheric ozone
from Aura-TES and MetOp-IASI
H. Oetjen et al.
Title Page
Abstract Introduction
Conclusions References
Tables Figures
◭ ◮
◭ ◮
Back Close
Full Screen / Esc
Printer-friendly Version
Interactive Discussion
Discussion
P
a
per
|
Discussion
P
a
per
|
Discussion
P
a
per
|
Discussion
P
a
per
|
eastern Asia
western US
Europe

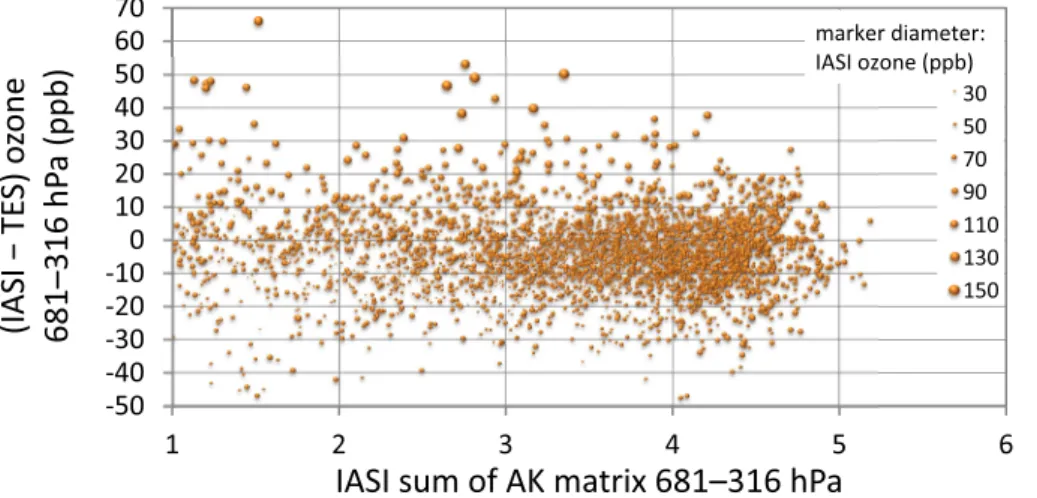
![Figure 4. Regions of interest, Eastern Asia (corner points: [41.5 ◦ N, 116 ◦ E], [30 ◦ N, 102.5 ◦ E], [20 ◦ N,102.5 ◦ E], [20 ◦ N, 123 ◦ E], [41.5 ◦ N, 116 ◦ E]), Western US (box between 30 and 50 ◦ N, 125 and 100 ◦ W), and Europe (box between 40 and 55 ◦](https://thumb-eu.123doks.com/thumbv2/123dok_br/17136932.239319/23.918.101.602.203.386/figure-regions-eastern-asia-corner-points-western-europe.webp)