AR
TICLE
1 Programa de Pós-Graduação em Epidemiologia. Universidade Federal de Pelotas.Rua Marechal Deodoro 1160/3°, Centro. 96020-220 Pelotas RS Brasil.
anapaulagomes.nutri@ gmail.com
Low diet quality in older adults:
a population-based study in southern Brazil
Abstract The aim of this study was to identify the factors associated with low diet quality in old-er adults from the city of Pelotas, Southold-ern Brazil. Information on food consumption was collected using a reduced food frequency questionnaire, and diet quality was assessed by the Elderly Diet Quality Index DQI-E (“Índice de Qualidade da Dieta de Idosos - IQD-I”), devised by the authors. Points were attributed to each food evaluated according to frequency of consumption. Higher consumption frequency of healthy foods received higher scores whilst unhealthy foods received low-er scores. Scores wlow-ere divided into tlow-ertiles classified as: low quality, intermediate quality, and good quality. Multinomial logistic regression was used to assess the association between diet quality and the independent variables. The factors associated with low diet quality were: male gender, age < 80 years, low education, problems affording food, un-derweight, mouth or teeth problems, and having less than four meals a day. Important barriers to the consumption of a good quality diet were ob-served, highlighting the importance of considering these aspects in the promotion of healthy eating among older adults.
Key words Food habits, Feeding behavior, Elder-ly nutrition, Cross-sectional studies
Ana Paula Gomes 1
Ana Luiza Gonçalves Soares 1
Go
mes AP
Introduction
Lower fertility and mortality rates, coupled with increased life expectancy, have made the elderly
(≥ 60 years) population the fastest growing age
group over recent years in most countries1. The
proportion of older adults worldwide is set to rise from 11.7% in 2013 to 21.2% by 2050, when
life expectancy at birth in Brazil will be 82 years2.
Recent estimates show that almost 60% of
Brazilian elderly are overweight3 and around
80% have at least one non-communicable
chron-ic disease (CNCD)4. An unhealthy diet
increas-es the risk of developing CNCDs, an important
cause of disability and premature death5. Thus,
concerted efforts have been made for the adop-tion of a healthy diet as a means of promoting healthy aging.
In Brazil, the Ministry of Health (MS) re-leased the Dietary Guide (recently revised) for
the Brazilian population6, aimed at fostering the
adoption of a healthy diet among adults and
el-derly7. In the first version of the Dietary Guide,
the recommendations focused on the ideal intake of a number of food groups based on the Brazil-ian food pyramid, whereas in the second version, the attitudes favoring healthier dietary behavior are outlined.
Naturally occurring aging is associated with anatomical and functional changes in the organ-ism that impact the health and nutritional status
of older adults8. Barriers to healthy food
con-sumption in this age group can be attributed to a number of different factors: social environment, functional difficulties purchasing or preparing foods, financial difficulties, changes in cognitive ability, physiological changes in taste sensations, decline in olfactory function and changes in the
digestion and absorption of nutrients9.
Studies assessing diet quality of the elderly
remain scarce, particularly in Brazil10-12. The few
studies on the subject have shown that generally less than 10% of Brazilian elderly have an ade-quate diet and that most need to modify their
di-ets to meet nutritional needs10,11. Given the rapid
process of population aging and consequent in-crease in the burden of chronic diseases, together with the effects of unhealthy diet on the general health status of older adults, identifying the fac-tors associated with low diet quality among this
population has become especially important.In
addition, assessing diet quality in the elderly is a timely topic that can help inform the devising of policies on nutrition aimed at this popula-tion. Therefore, the objective of this study was to
identify the factors associated with diet quality of older adults from the city of Pelotas, Rio Grande do Sul state.
Methods
A cross-sectional, population-based study of a sample of the population aged 60 or over in the city of Pelotas was carried out between January and August 2014. Pelotas is a medium-sized city located in the Southern part of Rio Grande do Sul
(RS) state with a population of around 330,00013.
The survey, comprising a research consortium
of Masters students in Epidemiology14, was
de-signed to assess different aspects of the general health status of the elderly residents of the city.
The sample size required to meet the con-sortium objectives was 1,649 older persons. For the sampling process, census sectors of the urban
zone of Pelotas15 were ranked according to
aver-age income. Sectors containing 14 older adults or fewer were pooled together with one or more adjacent groups of similar average income, giv-ing a total of 469 eligible sectors. Of this total, 133 sectors were systematically selected. A total of 31 households per sector were systematically selected for identification of around 12 elderly individuals in each sector (based on 0.4 elderly per household), giving 4,123 interviewees to be visited.
The sample size of the study was estimated based on an outcome prevalence of 50% (corre-sponding to maximum variability), confidence level of 95%, sampling error of 4% and design ef-fect of 1.5. After the addition of a further 10% for drop-outs and refusals, the estimated minimum number of elderly for inclusion in the study was 990 individuals.
The inclusion criteria for the research con-sortium were non-institutionalized older adults aged 60 years or older living in the urban zone of Pelotas. The specific exclusion criteria for this study were elderly on enteral or parenteral nu-trition.
Food intake for the past week was assessed using the reduced 11-item Food Frequency Questionnaire (FFQ) devised for the study based on recommendations from the first edition of the
Dietary Guide for the Brazilian population6, the
Consump-e C
ole
tiv
a,
21(11):3417-3428,
2016
tion of the following foods and/or combination of foods in the past week was investigated: beans and rice; whole foods; fruit; legumes and vege-tables; meats (red meat, chicken and fish) or eggs; milk and milk-based products; fried foods; sweet food products, soft-drinks or processed juices; foods in preservatives, processed meats or canned products; frozen foods and ready meals; and fast food.
The combination “rice and beans” was in-cluded in the FFQ because it represents a tradi-tional Brazilian dish of good nutritradi-tional value ranked highly in the above-mentioned Dietary Guide. Although the same Guide contains rec-ommendations on water consumption, it was decided to include only foods contributing to the calorific value of the diet, given that the aim of the study was to estimate the quality of this diet. The questionnaire was previously tested in a pre-pilot study to identify problems and assess understanding of the instrument.
The dietary quality of the elderly participants was assessed using an index devised by the
au-thors a posteriori to data collection called the
Elderly Diet Quality Index (DQI-E). First, the weekly frequencies of consumption of each food group from the FFQ were grouped into four cat-egories: not eaten in the past week, eaten on 1-3 days during the week, eaten 4-6 days, and eaten every day of the week. Scores ranging from zero to three were attributed to each category (Chart 1). Given that no recommendations on ideal
frequency of food consumption currently exist, higher scores were given for greater frequency of consumption of foods deemed healthy, based on the premise that greater frequencies probably re-flect greater consumption of these foods. Thus, foods such as rice and beans, whole foods, fruit, legumes and vegetables, meats and milk and milk-based products were given increasing scores (not consumed = zero points, consumed every day = three points). By contrast, foods deemed unhealthy or of low nutritional value were given decreasing scores (not consumed = three points, consumed every day = zero points), drawing on recommendations that consumption of these foods should be reduced.
Total score on the DQI-E ranged from 0 to 33 points, where high scores are suggestive of higher frequency of consumption of healthy foods and lower frequency of unhealthy foods. Total score on the DQI-E was divided into tertiles classified
as: 1st tertile (low score) – low quality; 2nd tertile
– intermediate quality; 3rd tertile (high score) –
good quality.
The independent variables analyzed in this study were:
.
demographic and socioeconomic: sex(male, female), age (collected as discrete numer-ic variable and later categorized into age
brack-ets 60-69 years, 70-79 years or ≥ 80 years), skin
color (as observed by interviewer and classified as white or non-white), marital status (with or without partner), education (collected as
cate-a Dietary Guide for the Brazilian population (2008).
Chart 1. Description of scoring used for calculating the Elderly Diet Quality Index.
Recommendationa
“Eat foods such as whole grains, beans, fruit, legumes and vegetables, milk and milk-based products, and lean meats, poultry or fish, on a daily basis.”
“Reduce consumption of fried foods and those containing a high amount of sugar, fat or salt.”
Food or group of foods
Healthy Rice with beans Whole foods
Legumes and vegetables Fruit
Meat, poultry, fish or eggs Milk and milk-based products
Unhealthy Fried foods
Sweet products, soft drinks or processed juices
Pickles, processed meats, canned foods Frozen foods
Fast food
Category
Not eaten in past week Eaten 1-3 days/week Eaten 4-6 days/week Eaten every day
Not eaten in past week Eaten 1-3 days/week Eaten 4-6 days/week Eaten every day
Criterion score
0 1 2 1
Go
mes AP
gorical variable and classified as 0-3, 4-7, 8-11 or
≥ 12 years of study) and presence of self-reported
difficulty affording food (categorized into yes or no);
.
food-related behaviors; number of mealsconsumed per day (< 4 or ≥ 4) and company
during meals (alone/accompanied);
.
health-related variables: presence of oralproblems that affect eating (self-reported) and nutritional status, as assessed by Body Mass In-dex (BMI) and classified according to Ministry of Health recommendations (underweight,
nor-mal weight, overweight16). Body weight was
mea-sured using digital scales (Tanita®) with capacity of 150 Kg and accurate to the nearest 100 grams. Standing height was estimated based on knee height (measured using a pediatric stadiometer with a 100 cm scale by Indaiá®) employing the
equation recommended by Chumlea and Guo17.
Interviews were conducted at participants´ homes by interviewers educated at least to high school level and previously trained on collecting data and taking anthropometric measurements.
Measurement training was based on Habicht´s18
method of good anthropometric measure col-lection technique to increase the precision and accuracy of measurements. Interviews were car-ried out with the aid of notebooks and data col-lection was checked weekly to identify potential inconsistencies. Quality control of interviews was performed by the supervisors of the field work in 10% of the sample by applying a reduced ques-tionnaire. Given that the FFQ questions referred to the week leading up to the interview, and thus subject to variability, the variable chosen for calculating agreement was education, yielding a weighted Kappa coefficient of 0.83.
Data analysis was conducted using the Stata statistics program, version 12.1 (College Station, United States). After checking for inconsistencies, descriptive analysis was performed to character-ize the sample. Multinomial logistic regression was used to obtain the adjusted odds ratio for the DQI-E categories, where the good quality diet cate-gory was the reference catecate-gory. The adjusted anal-ysis was performed at two levels. In the first level, demographic and socioeconomic variables with values < 0.20 on the raw analysis were included in the model. In the second level, the other variables were included. Variables with a p-value of 5-20-% were retained in the model to control for con-founders. Variables with p < 0.05 were considered factors associated with the outcome. The sampling design effect was considered in all analyses.
The study was approved by the Research Eth-ics Committee of the School of Medicine of the Federal University of Pelotas.
Results
Of the total households selected for the sample, 3,799 were identified. For the remaining house-holds, the Masters students were unable to con-tact dwellers after three attempts on different days and times. A total of 1,844 elderly were located, of which 1,839 were eligible for the study. In to-tal, 1,426 older adults answered the full dietary questionnaire and constituted the final sample of this study. Dropouts and refusals amounted to 10.8% (n=199) and 11.6% (n=214), respectively, comprising predominantly women (60.0%) and individuals aged 60-69 years (59.0%).
A description of the sample studied is given in Table 1. The sample comprised predominant-ly women (62.8%), individuals aged 60-69 years (52.6%), with white skin color (83,6%), with partner (52.9%), < 8 years´ education (68.2%), and no problems affording food (81.0%). Less than 12% of elderly reported having oral and/or teeth problems affecting eating, while over half were overweight (56.2%). With regard to
behav-ioral variables, the majority of the elderly had ≥ 4
meals daily (77.2%) and ate meals in the compa-ny of others (70.4%). Median income per capita was R$ 864.00 (data not shown in table).
The DQI-E had a mean score of 24.2 (SD = 3.8), median 24.0 and amplitude of 11-33 points. The low quality diet tertile ranged from 11-22 points; intermediate 23-16; and good quality 27-33 points (data not shown in table).
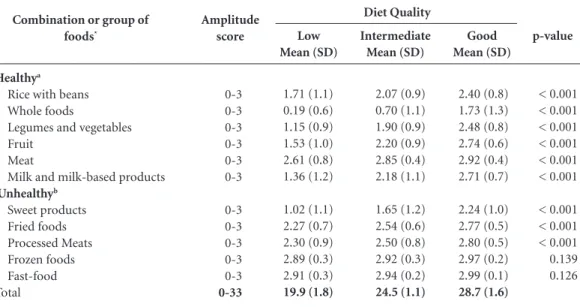
Mean scores for each food group or combina-tion of foods by DQI-E category are given in Ta-ble 2. Each component is scored on a scale of 0-3 points. Lower means (indicating lower consump-tion) for healthy foods and unhealthy foods (in-dicating higher consumption) were found in the low quality diet category. Marked differences in the consumption of whole foods were evident, with a mean of 0.2 points in the low quality category, 0.7 in intermediate, and 1.7 in the good quality catego-ry. Mean score for meat consumption was relatively
high (≥ 2.5 points) in the low quality category, but
e C ole tiv a, 21(11):3417-3428, 2016
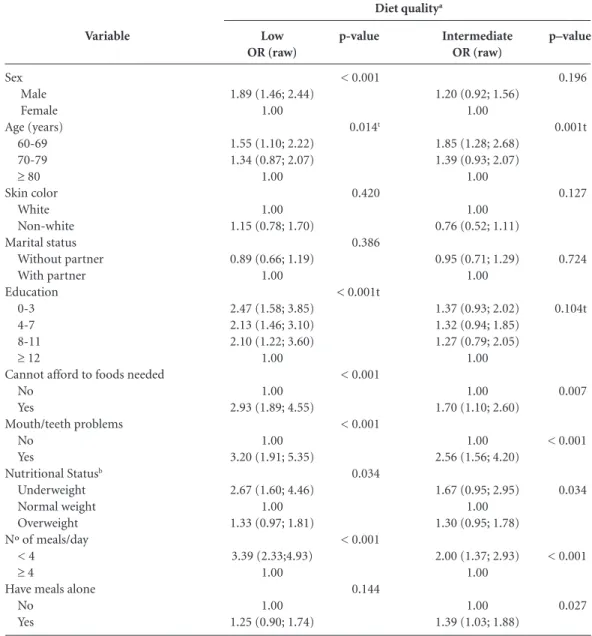
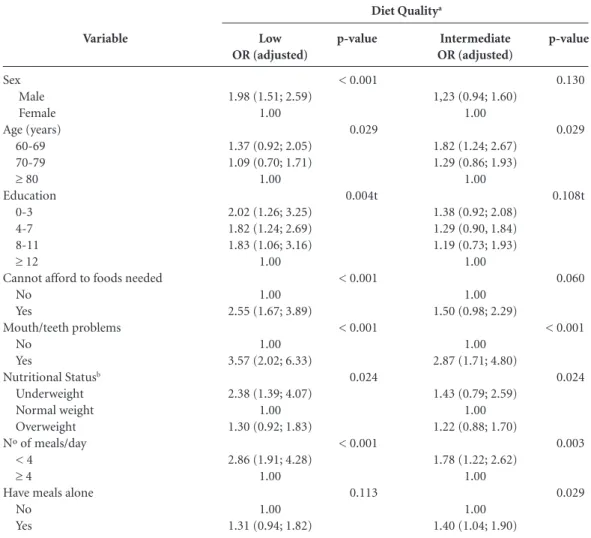
Raw odds ratios of the independent variables according to DQI-E categories are shown in Ta-ble 3. Only the variaTa-bles skin color and marital status were unassociated with diet quality. On the adjusted analysis (Table 4), the same associa-tions seen in the raw model remained. Men had a 2-fold greater chance of having a low quality diet than women. With regard to age, individu-als in the 60-69 age group had 1.3 and 1.8 times greater chance, respectively, of having a low and intermediate quality diet than older age groups. The chance of a low quality diet rose with num-ber of years of education, with the greatest effect
observed in elderly with ≤ 3 years of education
(OR = 2.02). Elderly reporting problems afford-ing food had a 2.5 times greater chance of havafford-ing low quality diet compared to those not reporting this problem. Elderly suffering from mouth or teeth problems had 3.6 and 2.9 times the chance of having low and intermediate quality diets, re-spectively, than individuals without mouth or teeth problems. Low-weight individuals had a 2.4 times greater chance of having a low quality diet compared to those of normal weight. Elderly that consumed < 4 meals per day had a 2.9 and 1.8 times greater chance of having a low and in-termediate quality diet, respectively, compared to those who ate more frequently. Lastly, elderly that ate meals alone had a 1.4 times chance of having an intermediate quality diet compared to indi-viduals that had meals with others.
Discussion
This study identified several factors associated with greater vulnerability to consumption of a low quality diet by older adults. The risk groups consisted of men, younger old individuals, with low educational level, reporting problems afford-ing foods, with low weight and oral problems that affected eating. The study results revealed that consuming meals less frequently was associ-ated with the consumption of a low quality diet. Greater susceptibility to low quality diet among elderly men was shown in a recent sys-tematic review of the national and international
studies19. In general, women are more concerned
from a young age about weight control and also have the social role of caregivers, which may in turn lead to them taking more care over food
choices20 and explain their better quality diet
compared to that of men.
With regard to age, the study of Assumpção12
conducted in Southeast Brazil found similar re-sults. The authors reported a higher quality diet among elderly age 80 years or older. Another study carried out in the United States in 2012 showed that elderly aged 75 years or older had
a better quality diet than younger individuals21.
The presence of chronic diseases and comorbid-ities and the desire for better quality of life may encourage elderly (and/or family members) to adopt a healthier diet as a means of managing these conditions and might explain this associa-tion, given that these diseases are more prevalent in older individuals.
The skin color variable was not associat-ed with diet quality, corroborating findings of
Variable Sex Male Female Age (years) 60-69 70-79
≥ 80 Skin color White Non-white Marital status Without partner With partner Education (full years)
0-3 4-7 8-11
≥ 12
Cannot afford foods needed No
Yes
Mouth/teeth problems No
Yes
Nutritional statusa
Underweight Normal weight Overweight Nº of meals/day
< 4
≥ 4
Have meals alone No Yes N 530 896 748 450 225 1.190 234 671 753 526 439 141 309 1.120 263 1.224 159 126 471 767 325 1.101 974 409 % 37.2 62.8 52.6 31.6 15.8 83.6 16.4 47.1 52.9 37.2 31.0 10.0 21.8 81.0 19.0 88.5 11.5 9.3 34.5 56.2 22.8 77.2 70.4 29.6
Table 1. Description of sample according to
demographic, socioeconomic, health and behavioral variables. Pelotas, Rio Grande do Sul (n = 1,426).
Go
mes AP
a previous study12 showing that this individual
characteristic exerts no effect on eating habits, which appear to be very similar among whites and non-whites. Further studies on this issue are warranted.
Other Brazilian studies in older adults failed to find an association between education and
dietary quality10,12, in contrast with some
stud-ies conducted in middle-to-high income
coun-tries21-23. Lower educated individuals generally
have lower income and consequently less access to
healthy foods24. Problems affording foods was
as-sociated with greater chance of a low quality diet. Income, along with other variables not assessed such as values connected with foods, appears to exert a major influence at the time of food choice. Studies have shown that a healthy diet is more ex-pensive than typical Western style diets,
predom-inantly consisting of fat and sugar-rich foods25,26.
In the present study, the lowest DQI-E scores in the low quality category were found for more ex-pensive healthy foods such as whole grains, vege-tables, fruit and dairy products.
The relationship between low weight and diet quality observed in the present study was not found in a recently published study with a similar
cut-off point for classifying nutritional status12.
In the present study, elderly with low quality diet had lower intake of foods essential for the daily diet, energy sources, fiber, vitamins and minerals. This type of diet tends to result in calorie intake
that is insufficient to meet the nutritional needs
of elderly27 and can lead to weight loss. It is
im-portant to point out that, owing to the cross-sec-tional design of the study, this association is sub-ject to reverse causality bias, although the study objective was to identify associated factors and not to establish a causal relationship.
Problems related to oral health such as tooth loss, poorly fitting prostheses and sensation of dry mouth often seen in elderly, hamper chewing and are associated with lower consumption of foods like meat, fruit and raw vegetables. These foods are considered important for health and therefore oral problems can lead to inadequate levels of intake of protein, fiber, vitamins and
minerals28 resulting in low quality diet22,23, as
evi-denced in the present study.
The consumption of fewer meals and having meals alone were associated with a low and/or intermediate quality diet. The new Dietary Guide
released in 20147 emphasizes the importance of
healthy behaviors that favor the adoption of a good quality diet, including having meals in the company of family members and/or friends. The greater frequency of consumption of meals, pro-vided these comprise healthy foods, should be encouraged.
The elderly studied had a low intake of un-healthy foods such as fried foods, pickled prod-ucts, processed meats, canned foods and particu-larly frozen and fast foods, whose average scores
Combination or group of
foods*
Healthya
Rice with beans Whole foods
Legumes and vegetables Fruit
Meat
Milk and milk-based products
Unhealthyb
Sweet products Fried foods Processed Meats Frozen foods Fast-food Total
Amplitude score
0-3 0-3 0-3 0-3 0-3 0-3
0-3 0-3 0-3 0-3 0-3
0-33
Table 2. Mean and standard deviation of each component and DQI-E category. Pelotas. Rio Grande do Sul (n =
1,426).
a Higher means indicate greater frequency of consumption. b Higher means indicate lower frequency of consumption.
p-value
< 0.001 < 0.001 < 0.001 < 0.001 < 0.001 < 0.001
< 0.001 < 0.001 < 0.001 0.139 0.126
Low Mean (SD)
1.71 (1.1) 0.19 (0.6) 1.15 (0.9) 1.53 (1.0) 2.61 (0.8) 1.36 (1.2)
1.02 (1.1) 2.27 (0.7) 2.30 (0.9) 2.89 (0.3) 2.91 (0.3)
19.9 (1.8)
Intermediate Mean (SD)
2.07 (0.9) 0.70 (1.1) 1.90 (0.9) 2.20 (0.9) 2.85 (0.4) 2.18 (1.1)
1.65 (1.2) 2.54 (0.6) 2.50 (0.8) 2.92 (0.3) 2.94 (0.2)
24.5 (1.1)
Good Mean (SD)
2.40 (0.8) 1.73 (1.3) 2.48 (0.8) 2.74 (0.6) 2.92 (0.4) 2.71 (0.7)
2.24 (1.0) 2.77 (0.5) 2.80 (0.5) 2.97 (0.2) 2.99 (0.1)
e C
ole
tiv
a,
21(11):3417-3428,
2016
were similar across all categories of the DQI-E. This finding represents a positive characteristic of this population because these foods are typically ultraprocessed, contain a high level of calories and fat, and are poor in nutrients. The low intake of these foods could be related to the traditional eating habits of this group established at a time when the availability and consumption of
ultrap-rocessed foods was far lower29. In addition, this
pattern might be linked to the popular belief that these foods are less digestible and inappropriate beyond a certain age. With greater longevity, the
guidance provided by health professionals may also have addressed these aspects and positively influenced the eating habits of these individuals.
Several limitations inherent to this study should be taken into account. The first involves the FFQ employed in the study. The pooling of several foods into a single category may have led to under- or over-estimation of the intake of certain foods. Nevertheless, this form of the instrument has advantages over longer versions for its ease of application and greater adherence
of interviewees30. The FFQ used in the study
en-Variable
Sex Male Female Age (years)
60-69 70-79
≥ 80 Skin color
White Non-white Marital status
Without partner With partner Education
0-3 4-7 8-11
≥ 12
Cannot afford to foods needed No
Yes
Mouth/teeth problems No
Yes
Nutritional Statusb
Underweight Normal weight Overweight Nº of meals/day
< 4
≥ 4
Have meals alone No
Yes
Table 3. Bivariate analysis between diet quality and demographic, economic, health and behavioral variables.
Pelotas. Rio Grande do Sul (n = 1,426).
a Reference category: good diet quality. b Highest number missing: 75. t Linear Trend.
p–value
0.196
0.001t
0.127
0.724
0.104t
0.007
< 0.001
0.034
< 0.001
0.027
Intermediate OR (raw)
1.20 (0.92; 1.56) 1.00
1.85 (1.28; 2.68) 1.39 (0.93; 2.07)
1.00
1.00 0.76 (0.52; 1.11)
0.95 (0.71; 1.29) 1.00
1.37 (0.93; 2.02) 1.32 (0.94; 1.85) 1.27 (0.79; 2.05)
1.00
1.00 1.70 (1.10; 2.60)
1.00 2.56 (1.56; 4.20)
1.67 (0.95; 2.95) 1.00 1.30 (0.95; 1.78)
2.00 (1.37; 2.93) 1.00
1.00 1.39 (1.03; 1.88)
Diet qualitya
Low OR (raw)
1.89 (1.46; 2.44) 1.00
1.55 (1.10; 2.22) 1.34 (0.87; 2.07)
1.00
1.00 1.15 (0.78; 1.70)
0.89 (0.66; 1.19) 1.00
2.47 (1.58; 3.85) 2.13 (1.46; 3.10) 2.10 (1.22; 3.60)
1.00
1.00 2.93 (1.89; 4.55)
1.00 3.20 (1.91; 5.35)
2.67 (1.60; 4.46) 1.00 1.33 (0.97; 1.81)
3.39 (2.33;4.93) 1.00
1.00 1.25 (0.90; 1.74)
p-value
< 0.001
0.014t
0.420
0.386
< 0.001t
< 0.001
< 0.001
0.034
< 0.001
Go
mes AP
compassed the food intake of a single week and may not reflect actual eating habits. This recall period, however, was adopted to reduce the ef-fect of memory bias. Because the instrument has not been validated, measurement bias cannot be ruled out, where the dietary intake of the elder-ly may have included other foods not covered by the instrument. The FFQ applied did not collect information on fat levels of dairy products or meat. However, consumption of these high-fat
foods is known to decrease with age3, possibly
as a result of guidance from health professionals and/or family members.
The second limitation of the study concerns the DQI-E. The study did not employ a dietary quality index available in the literature, ham-pering comparison of findings with the results of other studies. Nevertheless, it should be
reit-erated that the index was devised specifically to estimate the diet quality of the elderly, an area lit-tle explored in the literature. Assessment of diet using different scores is an approach also used by
other authors31,32.
The identification of problems affording food and related to oral health affecting eating, as perceived by interviewees, are subjective mea-sure and thus susceptible to information bias. It is likely that individuals in a more severe sit-uation report these problems more frequently, and therefore the possibility of overestimation for these cases exists. Besides these issues, the cross-sectional design precludes inferences of a temporal nature on the associations found, call-ing for caution interpretcall-ing the results as men-tioned above. The profile of drop-outs is note-worthy, particularly concerning the greater loss
Variable
Sex Male Female Age (years)
60-69 70-79
≥ 80 Education
0-3 4-7 8-11
≥ 12
Cannot afford to foods needed No
Yes
Mouth/teeth problems No
Yes
Nutritional Statusb
Underweight Normal weight Overweight Nº of meals/day
< 4
≥ 4
Have meals alone No
Yes
Table 4. Final model for factors associated with diet quality of elderly. Pelotas. Rio Grande do Sul (n = 1,426).
a Reference category: good diet quality. b Highest number missing: 75. t Linear Trend.
p-value
0.130
0.029
0.108t
0.060
< 0.001
0.024
0.003
0.029
Intermediate OR (adjusted)
1,23 (0.94; 1.60) 1.00
1.82 (1.24; 2.67) 1.29 (0.86; 1.93)
1.00
1.38 (0.92; 2.08) 1.29 (0.90, 1.84) 1.19 (0.73; 1.93)
1.00
1.00 1.50 (0.98; 2.29)
1.00 2.87 (1.71; 4.80)
1.43 (0.79; 2.59) 1.00 1.22 (0.88; 1.70)
1.78 (1.22; 2.62) 1.00
1.00 1.40 (1.04; 1.90)
Diet Qualitya
Low OR (adjusted)
1.98 (1.51; 2.59) 1.00
1.37 (0.92; 2.05) 1.09 (0.70; 1.71)
1.00
2.02 (1.26; 3.25) 1.82 (1.24; 2.69) 1.83 (1.06; 3.16)
1.00
1.00 2.55 (1.67; 3.89)
1.00 3.57 (2.02; 6.33)
2.38 (1.39; 4.07) 1.00 1.30 (0.92; 1.83)
2.86 (1.91; 4.28) 1.00
1.00 1.31 (0.94; 1.82)
p-value
< 0.001
0.029
0.004t
< 0.001
< 0.001
0.024
< 0.001
e C
ole
tiv
a,
21(11):3417-3428,
2016
of women from the sample. Perhaps, owing to this greater loss, the effect of the association be-tween low diet quality and male gender may have been overestimated. However, as outlined in this discussion, the result is in line with observations made in other epidemiological studies.
Strengths of the study include the represen-tativeness of the sample of the elderly population of Pelotas city, assuring its internal validity. The methodological quality of the study also war-rants mention given that the training of the in-terviewers and quality control of the interviews lend the data collected greater credibility.
Pelo-tas is a medium-sized city with similar features to many other Brazilian cities. Consequently, the results of this study can be extrapolated to other low-to-middle sized cities, representing the ma-jority of Brazilian cities.
Go
mes AP
References
Bongaarts J. Human population growth and the demo-graphic transition. Philos TransR Soc Lond B Biol Sci. 2009; 364(1532):2985-2990.
United Nations (UN). Department of Economic and Social Affairs, Population Division. World Population Prospects: The 2012 Revision, Key Findings and Advance
Tables. New York: UN; 2013. Working Paper No.
ES-A/P/WP.227
Brasil. Ministério da Saúde (MS). Secretaria de Vigilân-cia em Saúde. Vigitel Brasil 2012: Vigilância de Fatores de Risco e Proteção para Doenças Crônicas por Inquérito
Telefônico. Brasilia: MS; 2013.
Instituto Brasileiro de Geografia e Estatística (IBGE). Pesquisa Nacional por Amostra de Domicílios (PNAD). Um panorama da saúde no Brasil. Acesso e Utilização dos serviços, condições de saúde e fatores de risco e proteção à
saúde. Rio de Janeiro: IBGE; 2010.
1.
2.
3.
4. Collaborations
e C
ole
tiv
a,
21(11):3417-3428,
2016
Lim SS, Vos T, Flaxman AD, Danaei G, Shibuya K, Adair-Rohani H, Amann M, Anderson HR, Andrews KG, Aryee M, Atkinson C, Bacchus LJ, Bahalim AN, Balakrishnan K, Balmes J, Barker-Collo S, Baxter A, Bell ML, Blore JD, Blyth F, Bonner C, Borges G, Bourne R, Boussinesq M, Brauer M, Brooks P, Bruce NG, Brunekreef B, Bryan-Hancock C, Bucello C, Buchbind-er R, Bull F, Burnett RT, ByBuchbind-ers TE, Calabria B, Carapetis J, Carnahan E, Chafe Z, Charlson F, Chen H, Chen JS, Cheng AT, Child JC, Cohen A, Colson KE, Cowie BC, Darby S, Darling S, Davis A, Degenhardt L, Dentener F, Des Jarlais DC, Devries K, Dherani M, Ding EL, Dors-ey ER, Driscoll T, Edmond K, Ali SE, Engell RE, Erwin PJ, Fahimi S, Falder G, Farzadfar F, Ferrari A, Finucane MM, Flaxman S, Fowkes FG, Freedman G, Freeman MK, Gakidou E, Ghosh S, Giovannucci E, Gmel G, Gra-ham K, Grainger R, Grant B, Gunnell D, Gutierrez HR, Hall W, Hoek HW, Hogan A, Hosgood HD 3rd, Hoy D, Hu H, Hubbell BJ, Hutchings SJ, Ibeanusi SE, Jacklyn GL, Jasrasaria R, Jonas JB, Kan H, Kanis JA, Kassebaum N, Kawakami N, Khang YH, Khatibzadeh S, Khoo JP, Kok C, Laden F, Lalloo R, Lan Q, Lathlean T, Leasher JL, Leigh J, Li Y, Lin JK, Lipshultz SE, London S, Lozano R, Lu Y, Mak J, Malekzadeh R, Mallinger L, Marcenes W, March L, Marks R, Martin R, McGale P, McGrath J, Me-hta S, Mensah GA, Merriman TR, Micha R, Michaud C, Mishra V, Mohd Hanafiah K, Mokdad AA, Morawska L, Mozaffarian D, Murphy T, Naghavi M, Neal B, Nelson PK, Nolla JM, Norman R, Olives C, Omer SB, Orchard J, Osborne R, Ostro B, Page A, Pandey KD, Parry CD, Passmore E, Patra J, Pearce N, Pelizzari PM, Petzold M, Phillips MR, Pope D, Pope CA 3rd, Powles J, Rao M, Razavi H, Rehfuess EA, Rehm JT, Ritz B, Rivara FP, Roberts T, Robinson C, Rodriguez-Portales JA, Romieu I, Room R, Rosenfeld LC, Roy A, Rushton L, Salomon JA, Sampson U, Sanchez-Riera L, Sanman E, Sapkota A, Seedat S, Shi P, Shield K, Shivakoti R, Singh GM, Sleet DA, Smith E, Smith KR, Stapelberg NJ, Steenland K, Stöckl H, Stovner LJ, Straif K, Straney L, Thurston GD, Tran JH, Van Dingenen R, van Donkelaar A, Veerman JL, Vijayakumar L, Weintraub R, Weissman MM, White RA, Whiteford H, Wiersma ST, Wilkinson JD, Williams HC, Williams W, Wilson N, Woolf AD, Yip P, Zielins-ki JM, Lopez AD, Murray CJ, Ezzati M, AlMazroa MA, Memish ZA. A comparative risk assessment of burden of disease and injury attributable to 67 risk factors and risk factor clusters in 21 regions, 1990-2010: a system-atic analysis for the Global Burden of Disease Study 2010. Lancet 2012; 380(9859):2224-2260.
5. Brasil. Ministério da Saúde (MS). Secretaria de Atenção
à Saúde. Coordenação Geral da Política de Alimentação e Nutrição. Guia alimentar para a população brasileira:
promovendo a alimentação saudável. Brasília: MS; 2008.
Brasil. Ministério da Saúde (MS). Secretaria de Atenção à Saúde. Coordenação Geral da Política de Alimentação e Nutrição. Guia alimentar para a população brasileira. 2a ed. Brasília: MS; 2014.
Campos MTFS, Monteiro JBR, Ornelas APRC. Fatores que afetam o consumo alimentar e a nutrição do idoso.
Rev Nutr 2000; 13(3):157-165.
Bernstein M, Munoz N. Position of the Academy of Nutrition and Dietetics: food and nutrition for older adults: promoting health and wellness. J Acad Nutr Diet 2012; 112(8):1255-1277.
Da Costa Louzada ML, Chagas Durgante P, De Marchi RJ, Neves Hugo F, Balbinot Hilgert J, Pereira Padilha DM, Terezinha Antunes M. Healthy eating index in southern Brazilian older adults and its association with socioeconomic, behavioral and health characteristics. J
Nutr Health Aging 2012; 16(1):3-7.
Malta MB, Papini SJ, Corrente JE. Avaliação da ali-mentação de idosos de município paulista: aplicação do Índice de Alimentação Saudável. Cien Saude Colet 2013; 18(2):377-384.
Assumpção D, Domene SMA, Fisberg RM, Barros MBA. Qualidade da dieta e fatores associados entre idosos: estudo de base populacional em Campinas, São Paulo, Brasil. Cad Saude Publica 2014; 30(8):1680-1694.
Instituto Brasileiro de Geografia e Estatística (IBGE). Dados referentes ao município de Pelotas. Rio de Ja-neiro: IBGE; 2014.
Barros AJD, Menezes AMB, Santos IS, Assunção MCF, Gigante D, Fassa AG, Marques M, Araújo C, Hallal PC, Facchini LA. O Mestrado do Programa de Pós-gradu-ação em Epidemiologia da UFPel baseado em consór-cio de pesquisa: uma experiência inovadora. Rev Bras
Epidemiol 2008; 11(Supl. 1):133-144.
Instituto Brasileiro de Geografia e Estatística (IBGE).
Censo 2010. Rio de Janeiro: IBGE; 2010.
Brasil. Ministério da Saúde (MS). SISVAN-Vigilância alimentar e nutricional. Orientações básicas para cole-ta, processamento e análise de dados e informação em
serviços de saúde. Brasília: MS; 2004.
Chumlea WC, Guo S. Equations for predicting stature in white and black elderly individuals. J Gerontol 1992; 47(6):197-203.
6.
7.
8.
9.
10.
11.
12.
13.
14.
15. 16.
Go
mes AP
Habicht J. Estandarización de metodos epidemiológi-cos cuantitativos sobre el terreno. Boletín de la Oficina
Sanitaria Panamericana (OSP). 1974; 76(5):375-384.
Freisling H, Knaze V, Slimani N. A Systematic Review of Peer-Reviewed Studies on Diet Quality Indexes Ap-plied to Old Age: A Multitude of Predictors of Diet Quality. In: Preedy VR, Hunter L-A, Patel VB, editors.
Diet Quality. Nutrition and Health. New York: Springer;
2013. p. 365-381.
Kiefer I, Rathmanner T, Kunze M. Eating and dieting differences in men and women. J Mens Health Gend 2005; 2(2):194-201.
Hiza HA, Casavale KO, Guenther PM, Davis CA. Diet quality of Americans differs by age, sex, race/ethnici-ty, income, and education level. J Acad Nutr Diet 2013; 113(2):297-306.
Ervin RB. Healthy Eating Index scores among adults, 60 years of age and over, by sociodemographic and health characteristics: United States, 1999-2002. Adv Data 2008; (395):1-16.
Shatenstein B, Gauvin L, Keller H, Richard L, Gaudreau P, Giroux F, Gray-Donald K, Jabbour M, Morais JA, Payette H. Baseline determinants of global diet quali-ty in older men and women from the NuAge cohort. J
Nutr Health Aging 2013; 17(5):419-425.
Riediger ND, Moghadasian MH. Patterns of fruit and vegetable consumption and the influence of sex, age and socio-demographic factors among Canadian el-derly. J Am Coll Nutr 2008; 27(2):306-313.
Claro RM, Monteiro CA. Renda familiar, preço de ali-mentos e aquisição domiciliar de frutas e hortaliças no Brasil. Rev Saude Publica 2010; 44(6):1014-1020. Rao M, Afshin A, Singh G, Mozaffarian D. Do health-ier foods and diet patterns cost more than less healthy options? A systematic review and meta-analysis. BMJ
Open 2013; 3(12):e004277.
18.
19.
20.
21.
22.
23.
24.
25.
26.
Fisberg RM, Marchioni DML, Castro MA, Verly Junior E, Araújo MC, Bezerra IN, Pereira RA, Sichieri R. In-gestão inadequada de nutrientes na população de ido-sos do Brasil: Inquérito Nacional de Alimentação 2008-2009. Rev Saude Publica 2013; 47(Supl. 1):222s-230s. Emami E, de Souza RF, Kabawat M, Feine JS. The im-pact of edentulism on oral and general health. Int J
Dent 2013; 2013:498305.
Jaime PC, Figueiredo ICR, Moura EC, Malta DC. Fa-tores associados ao consumo de frutas e hortaliças no Brasil, 2006. Rev Saude Publica 2009; 43(Supl. 2):57-64. Chiara VL, Barros M-E, Costa LP, Martins PD. Redução de lista de alimentos para questionário de freqüência alimentar: questões metodológicas na construção. Rev
Bras Epidemiol 2007; 10(3):410-420.
Molina MCB, Lopéz PM, Faria CP, Cade NV, Zan-donade E. Preditores socioeconômicos da qualidade da alimentação de crianças. Rev Saude Publica 2010; 44(5):785-732.
Kourlaba G, Polychronopoulos E, Zampelas A, Lionis C, Panagiotakos DB. Development of a diet index for older adults and its relation to cardiovascular disease risk factors: the Elderly Dietary Index. J Am Diet Assoc 2009; 109(6):1022-1030.
Article submitted 30/04/2015 Approved 23/10/2015
Final version submitted 25/10/2015 27.
28.
29.
30.
31.