ABSTRACT
Objective: The aim of this study was to evaluate the degree of conversion and hardness of different composite resins, photo-activated for 40 s with two different light guide tips, fiber optic and polymer. Methods: Five specimens were made for each group evaluated. The percentage of unreacted carbon double bonds (% C=C) was determined from the ratio of absorbance intensities of aliphatic C=C (peak at 1637 cm-1) against internal standard before and after curing of the specimen: aromatic C-C (peak at 1610 cm-1). The Vickers hardness measurements were performed in a universal test-ing machine. A 50 gf load was used and the indenter with a dwell time of 30 seconds. The degree of conversion and hardness mean values were analyzed separately by ANOVA and Tukey’s test, with a significance level set at 5%.
Results: The mean values of degree of conversion for the polymer and fiber optic light guide tip were statistically different (P<.001). The hardness mean values were statistically different among the light guide tips (P<.001), but also there was difference between top and bottom surfaces (P<.001).
Conclusions: The results showed that the resins photo-activated with the fiber optic light guide tip promoted higher values for degree of conversion and hardness. (Eur J Dent 2013;7:86-93)
Key words: Composite resins; hardness; polymerization Marília Regalado Galvão1,2
Sergei Godeiro Fernandes Rabelo Caldas1 Vanderlei Salvador Bagnato3
Alessandra Nara de Souza Rastelli1,3 Marcelo Ferrarezi de Andrade1
Evaluation of degree of conversion and
hardness of dental composites
photo-activated with different light guide tips
1 Department of Restorative Dentistry, Araraquara
School of Dentistry, Univ. Estadual Paulista-UNESP, Araraquara, SP, BRAZIL
2 Department of Dentistry, Rio Grande do Norte Federal
University-UFRN, Natal, RN, BRAZIL
3 São Carlos Physics Institute, Optical Group,
Biophotonics Lab., University of São Paulo, São Carlos, SP, BRAZIL
Corresponding author: Dr. Marília Regalado Galvão Department of Restorative Dentistry, Araraquara School of Dentistry, Univ. Estadual Paulista-UNESP. Rua Humaitá, 1740 – ZipCode 14801-385, Araraquara – SP – BRAZIL Tel: +55 16 33367222
Fax: +55 16 33016395
Email: [email protected]
Light-cured composite resins are widely used in dental restorations, as they are mercury-free and esthetically pleasing to the patient.1
The introduction of the visible light system for the photo-activation of composite resins had its beginning in 1970 with the use of ultraviolet light. However, due to the adverse effects caused by this light system, it was substituted quickly by the hal-ogen light system.2
Previously, the halogen lamp was the most common light source used for composite
activation. However, heat generation is the major disadvantage of these LCUs (Light Curing Unit). 3-7 Moreover, the bulb, reflector and filter can de-grade over time due to high operating tempera-tures caused by a large quantity of heat, which is produced during cycles.3
In recent years, light-emitting diodes (LEDs) have been used to create compact, cordless LCUs.8 They have a working lifetime of over 10,000 h, can have wavelength peaks of around 470 nm, it is not necessary to use filters and can be portable. In addition, the thermal emission of the LED LCUs is significantly lower than of halogen lamp LCUs. Studies using dental resins irradiated with blue light LEDs have been reported to have a higher degree of polymerization, a more stable three-dimensional structure, and a significantly greater curing depth than those cured with conventional QTH (Quartz tungsten-halogen) lights.1,2,9,10
The quality of the polymerization has been one of the most studied since the development of composite resins polymerized by light. Thus, there is the need for light sources that promote an ap-propriate conversion of monomers in polymers, so that the restoration has appropriate physical, chemical and mechanical properties.10-16
The study of some properties can be made by the degree of conversion and hardness tests. De-gree of conversion (DC) is an important parameter in determining the final physical, mechanical and biological properties of photo-activated composite resins.17 The DC is determined by the proportion of the remaining concentration of the aliphatic C=C double bonds in a cured sample relative to the to-tal number of C=C bonds in the uncured material. Fourier Transform Infra-red Spectroscopy (FT-IR) is one of the most widely used techniques for mea-surement of DC in dental composites.13,18
Several factors can influence the DC such as light source used, power density, wavelength, ir-radiation time, light-tip size, photo-activation method, distribution, quantity of inorganic fillers, the type and quantity of the photoinitiator, and color also strongly affect the DC of the composite resins.13
Vickers hardness measurement is one of the most important to compare restorative materi-als, and is defined as the resistance to indenter penetration or standing on the surface. It is a me-chanical property that should always be taken into
account, especially when they are faced with large areas of masticatory effort.19-21
Technologies have been developed that enable production of the appropriate amount of light re-quired for the efficient conversion of composite resins. Now, light-curing units have used different kinds of conductive systems based on a rigid probe that it contains the fiber optic involved by a glass material covered for glass amber or metal.2,22-25
The type of material of the light guide tips can hinder the light passage in its itinerary, increasing her dispersion. A wide variety of commercial light guide tips with variation of the material that cov-ers them, diametcov-ers, and shape, with the objective of facilitating the access to the different areas or cavities have been developed.3,4,9,24 These differ-ences on light guide tips can provide changes in the power density values and then compromising the polymerization of the composite resins.3
It has been hypothesized that the material that covers the light guide tips of the light-curing units promote the light dispersion in the itinerary of the light. In this way, the aim this study was evaluated the influence of the light guide tips used in the photo-activation of dental composites by means of degree of conversion and Vickers hardness.
MATERIAL AND METHODS
One blue LED LCU (Ultrablue IS, DMC, São Car-los, SP, Brazil, serial number: 002041) with two different light guide tips, fiber optic and polymeric was used in this study. Prior to the curing proce-dures, the power output of the LCU was measured with a calibrated power meter (Fieldmaster Power Meter, Coherent-model n° FM, set n° WX65, part n° 33-0506, USA) and the diameter of the light guide tip was measured with a digital caliper (Mitutoyo, Tokyo, Japan). Power density (mW/cm2) was com-puted as the ratio of the power output and the area of the tip with the following formula: I = P/A, where P is the power in (mW/cm2, milliwatts per centi-meter square) and A is the area of the light tip in centimeters square.
The LED LCU coupled with the fiber optic light guide tip presented 653 mW/cm2 and with the polymeric 596 mW/cm2. The characteristics of the light guide tips are shown in Table 1.
a universal microhybrid and FiltekTM Supreme XT (3M Espe Dental Products Division, St. Paul, MN 55144-1000, USA), a nanofilled.
The specimens were made using a metallic mould with a central orifice (4 mm in diameter and 2 mm in thickness) according to ISO 4049.26 The metallic mould was positioned on a 10 mm thick glass plate. The composite resin was packed in a single increment and the top and base surfaces were covered by a mylar strip. A glass sheet 1 mm thickness was positioned and a mass of 1 kg was used to pack the composite resin. Photo-activation was performed by positioning the light guide tip on the top surface of the composite resin specimens. The specimens were irradiated during 40 s. After photo-activation, the specimens were removed from the mould and stored in a dry mean, in dark containers, at 37º C (±1°C) for 24 hours.
Degree of Conversion Measurements (DC%)
For this technique, five specimens were made for each investigated Group (n=20) and 24 h after photo-activation, the specimens were pulverized into a fine powder. The pulverized composite resin was maintained in a dark room until the moment of the FT-IR analysis. Five milligrams (5 mg) of the ground powder were thoroughly mixed with 100 mg of the KBr powder salt. This mixture was placed into a pelleting device, and then pressed in a press with a load of 10 tons over 1 min to obtain a pellet.
To measure the degree of conversion, the pel-let was then placed into a holder attachment into the spectrophotometer Nexus-470 FT-IR (Thermo Nicolet, Vernon Hills, Illinois, USA). The Fourier transform infrared spectroscopy (FT-IR) spectra for both uncured and cured specimens were ana-lyzed using an accessory of the diffuse reflectance. The measurements were recorded in the absor-bance operating under the following conditions: 32 scans, a 4 cm–1 resolution, and a 300 to 4000 cm–1 wavelength. The percentage of unreacted carbon–carbon double bonds (% C=C) was deter-mined from the ratio of the absorbance intensities of aliphatic C=C (peak at 1637 cm–1) against an
in-ternal standard before and after the curing of the specimen: aromatic C–C (peak at 1610 cm–1). This experiment was carried out in triplicate. The de-gree of conversion was determined by subtracting the % C=C from 100%, according to the formula:
The percentage of unreacted carbon-carbon double bonds (% C=C) was determined from the ratio of absorbance intensities of aliphatic C=C (peak at 1637 cm-1) against internal reference ar-omatic C=C (peak at 1610 cm-1) before and after curing of the specimens.
Vickers Hardness Measurements
For this technique, five specimens for each in-vestigated Group were made (n=20) and then the Vickers hardness was measured on the top and the bottom surfaces of the specimens. The Vickers hardness test was performed in a hardness testing machine, MMT-3 Hardness Tester (Buehler Lake Bluff, Ilinois USA), equipped with Vickers diamond (VHN), which has a pyramidal diamond microin-dentor of 136° where the two diagonals are mea-sured using a load of 50 gf (gram force) during 30 s. Each surface of the specimen was divided into 4 equal quadrants. On each surface, the top (turned to the light source) and bottom (opposite to the light source) surfaces, one indentation took place for each quadrant. Eight indentations were taken from each specimen (4 to the top and 4 to the bot-tom). The hardness mean values were calculated for each surface.
The data for degree of conversion and hardness were statistically analyzed by Analysis of Variance (ANOVA) using a confidence interval of 95% and Tukey’s test.
RESULTS
Degree of Conversion
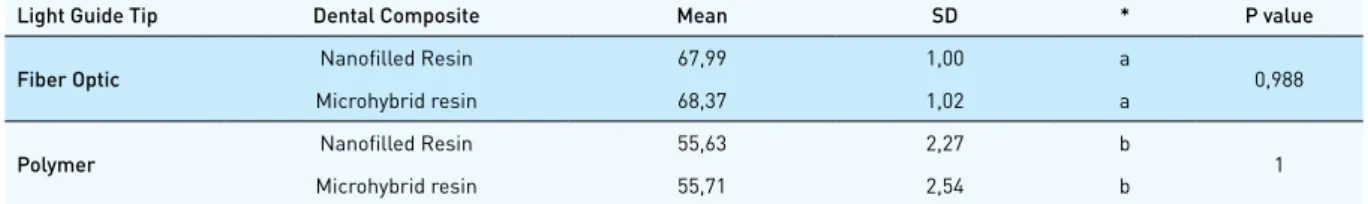
The Table 2 shows the degree of conversion (DC%) mean values obtained from different den-tal composites and different light guide tips. The degree of conversion values varied from 67.99% (±1.00) to 55.63% (±2.27) for nanofilled resin pho-to-activated by fiber optic and polymer light guide tips, respectively. For microhybrid resin, the
de-Light-Curing Unit Light Guide Tip Diameter entry Diameter exit Geometry
Ultrablue IS Fiber Optic 11mm 8mm Turbo
Polymer 10mm 8mm Turbo
gree of conversion values varied from 68.37% (±1.02) to 55.71% (±2.54) when fiber optic and poly-mer light guide tips were used, respectively.
ANOVA showed that the degree of conversion was influenced by light guide tips (P<.001), how-ever differences were not observed for different dental composites. According to the results pre-sented, the fiber optic light guide tip presented higher values for DC% regardless the type of den-tal composite used.
After 24 hours, using the irradiation time rec-ommended by the manufacturers (20 seconds), DC% of microhybrid resin and nanofilled resin, were not statistically different (P=0.988) when the different light guide tips were used (P=1). There-fore, the results suggested that the light guide tips used had a significant (P<.001) impact on the DC%, whereas the type of resin did not influence DC%.
Hardness
The Tables 3 and 4 shows the VHN mean val-ues (Kgf/mm2) for the top and bottom surfaces for
each Group measured. The ANOVA showed that the hardness values was influenced by light guide tips (P<.001) and was also observed for dental composites (P<.001).
The hardness mean values for the top sur-face varied from 67.72 (±0.68) to 51.58 (±1.39) for nanofilled resin photo-activated by fiber optic and polymer light guide tips, respectively. For micro-hybrid resin, the hardness mean values for the top surface varied from 72.01 (±0.71) to 61.72 (±1.34) when fiber optic and polymer light guide tips were used.
As can be seen in Table 5, there was statisti-cal significant differences between top and bot-tom surfaces (P<.001). The top surface showed the higher mean values than the bottom surface.
The hardness mean values of the specimens photo-activated with fiber optic light guide tip showed highest mean values when compared with the mean values for polymer light guide tip. The differences were statistically significant (P<.001).
Light Guide Tip Dental Composite Mean SD * P value
Fiber Optic Nanofilled Resin 67,99 1,00 a 0,988
Microhybrid resin 68,37 1,02 a
Polymer Nanofilled Resin 55,63 2,27 b 1
Microhybrid resin 55,71 2,54 b
Table 2. Mean, Standard Deviation (±SD) and P value for degree of conversion.
Table 3. Hardness mean values, Standard Deviation (±SD) and and P value for the top surfaces of the dental composite resin photo-activated with different light guides tips.
Table 4. Hardness mean values, Standard Deviation (±SD) and P value for the bottom surfaces of the dental composite resin photo-activated with different light guides tips.
Table 5. Hardness mean values for the top and bottom surfaces and corresponding B/T ratio of the dental composite resin photo-activated with different light guides tips. * Different letters denote significant difference (P<.001).
* Different letters denote significant difference (P<.001).
* Different letters denote significant difference (P<.001).
Light Guide Tip Dental Composite Mean SD * P value
Fiber Optic Microhybrid resin 72,01 0,71 a
<.001 Nanofilled resin 67,72 0,68 b
Polymer Microhybrid Resin 61,72 1,34 c
Nanofilled resin 51,58 1,39 d
Light Guide Tip Dental Composite Mean SD * P value
Fiber Optic Microhybrid Resin 61,77 0,40 a
<.001 Nanofilled resin 52,04 1,59 c
Polymer Microhybrid Resin 56,03 1,81 b Nanofilled resin 42,51 1,12 d
Light Guide Tip Dental Composite Top Surface Bottom Surface B/T%
Fiber Optic Nanofilled Resin 67,72 52,04 82,75
Microhybrid resin 72,01 61,77 85,75
Polymer Nanofilled Resin 51,58 42,51 82,41
DISCUSSION
A lower degree of conversion could affect the longevity of the composite restoration, because an incomplete conversion may result in unreacted monomers, which might dissolve in a wet environ-ment. In addition, reactive sites (double bonds) are susceptible to hydrolization or oxidation and, thereby, lead to a degradation of the material.27,28
Then, the degree of conversion is an important tool to determine the final physical, mechanical, and biological properties of composite resins, since it has been showed that composite proper-ties tend to improve as the degree of conversion at-tained during photo-polymerization is increased.15 In addition, increased cure may result in a lower amount of uncured, potentially leachable mono-mer, leading to a more biocompatible restoration.29 Moreover, uncured functional groups can act as plasticizers, reducing the mechanical properties.30
The minimum DC% for a clinically satisfactory restoration has not been precisely established. Nevertheless, a negative correlation of in vivo abrasive wear depth with DC has been found for values in the range of 55-65%. This suggests that, at least for occlusal restorative layers, DC values below 55% may be contraindicated.3 According to some authors the dimethacrylate monomers used in restorative materials exhibit considerable residual unsaturation in the final material, with a degree of conversion (%) ranging from 55 to 75% under conventional irradiation conditions.21-33
In this our experiment, the DC mean values ranged from 67.99 to 68.37 % for fiber optic and 55.63 to 55.71% for polymer light tip, and accord-ing to these results presented on Table 3 there was statistical difference in DC (%) mean values be-tween the light guide tips. These findings showing that the two light guide tips were able to light-cure microhybrid as nanofilled composite resins with 2 mm thickness. However, the degree of conversion of composites photo-activated with the fiber optic light guide tip was statistically higher than those observed with polymer light guide tip. This fact can be explained by the material of the tip. Polymer materials provide the dispersion of the light in its itinerary decreasing power density.3
In a previous study, Soares et al3 reported that the type of light guide tip material did not present a statistical significant difference on the final DC (%) of dental composite. However, this result can
be explained by the low power density delivered by the light-curing units, which was around 130/140 mW/cm2. As shown by Galvão et al24 it was not ob-served statistical significant difference for degree of conversion of dental composites photo-activat-ed with the different light guide tips. However, this result may be explained by the low quality of the fiber optic light guide tip used.
Factors such as light source, irradiation times, power density, correct wavelength of the light source, light-tip size, distribution, light guide tip and material's composition can influence the de-gree of conversion (%) and, then, the final charac-teristics of the dental composite resin.13 All these factors strongly influence the degree of conversion (%), which is a number of ethylene double carbon bonds that are converted into single bonds of the composite resin obtaining optimal chemical-phys-ical and clinchemical-phys-ical performance. Therefore, it plays an important role in determining the ultimate suc-cess of the restoration.34-36
Hardness evaluation is a widely used test to examine composite curing and, as a consequence, the efficiency of the light source.37 It is applied especially to restorative materials that are used where high bite forces and stresses can exacer-bate inherent material defects, resulting in inad-equate fracture resistance of the materials.38,39
According to some authors,40 there is still no consensus for the Vickers hardness be consid-ered optimal. Some authors believe that for com-posite resins, a hardness values can exceeding 50 (VHN) to be considered ideal.41 In this investiga-tion, nanofilled and microhybrid dental composite resins photo-activated with the fiber optic light tip showed hardness mean values at the top surface above 50 VHN. At the bottom surface, only one Group did not reach 50 VHN when polymer tip was used.
As shown in Table 3 and 4 statistical significant differences among the light guide tips (P<.001) and dental composites (P<.001) were observed. Statistical differences were also found when comparing top and bottom surfaces, for both the light guide tips and for the dental composites. On the top surface, the power density is usually suf-ficient for adequate polymerization, however, on the bottom surface the light of the light-curing unit frequently disperses, and then the polym-erization can be compromised. As a result, when the light passes through the bulk of the compos-ite, its power density is greatly reduced due to the scattering of light by filler particles and the resin matrix.5,27,45 The results obtained in this study, showed statistical significant differences among the dental composites, demonstrating that the type of resin used can also influence the results of hardness obtained. In this study a microhybrid dental composite showed higher hardness mean values than the nanofilled for both, top and the bottom surfaces.
According to Wu et al46 the composite resins based on nanotechnology describe research or products where critical component dimensions are in the range of 0.1 to 100 nanomers (nanomet-ric scale), through several physical and chemical methods. In 2003, the first composite resin with these characteristics was introduced in Dentistry. The goal was to use nanotechnology to create a composite that offers the polish retention of a mi-crofill with the strength of a hybrid composite.47,48 However, in our study it was observed that the nanofilled composite presented hardness values lower than those microhybrid, for the top and bot-tom surfaces especially photo-activated with the polymer light guide tip of.
This can be primarily explained by the differ-ence in the composition of the resin matrix, filler size, filler volume, and filler type of the materials. Although the organic phase of composite resins evaluated in this study are similar, there are dif-ferences in the inorganic phase (size, shape, and volume filler content). The filler volume% of the microhybrid composite and nanofilled composite are also similar around of 60%, however the mi-crohybrid filler size has an average medium size of 0.6µm and nanofilled nanoparticles of 20nm size fillers.17,49 This statement may explain the re-sults found in this study.
In this study, it was observed that there were difference in the degree of conversion and hard-ness of composite resins photo-activated with fi-ber optic and polymer light tips, showing that the materials of the light guide tips used may have direct impact on the power density, which would have great influence on the physical, chemical and mechanical and properties of composite res-ins.
CONCLUSIONS
The results obtained in this study indicated that the light guide tips used in the photo-activation (fiber optic and polymer) promoted differences in the degree and conversion, regardless of the type of dental composite. The fiber optic light guide tip provided higher degree of conversion. However, hardness was influenced by light guide tip, but also by the type of dental composite. The micro-hybrid dental composite photo-activated by fiber optic light guide tip provided the highest values for hardness, either top and bottom surfaces.
REFERENCES
1. Felix CA, Price RB. The effect of distance from light source on light intensity from curing lights. J Adhes Dent 2003;5:283-291.
2. Calixto LR, Lima DM, Queiroz RS, Rastelli ANS, Bagnato VS, Andrade MF. Curing depth of composite resin light cured by LED and halogen light-curing units. Las Phys 2008;18:1365-1369.
3. Soares LE, Liporoni PC, Martin AA. The effect of soft-start polymerization by second generation LEDs on the degree of conversion of resin composite. Oper Dent 2007;32:160-165.
4. Nitta K. Effect of light guide tip diameter of LED-light cur-ing unit on polymerization of light-cured composites. Dent
Mater 2005;2:217-223.
5. Yoon TH, Lee YK, Lim BS, Kim CW. Degree of polymeriza-tion of resin composites by different light sources. J Oral
Rehabil 2002;29:1165-1173.
6. Fujibayashi K, Ishimaru K, Takahashi N, Kohno A. Newly developed curing unit using blue light-emitting diodes.
Dent Japan 1998;34:49-53.
8. Price RBT, Fahey J, Felix CM. Knoop Microhardness Map-ping Used to Compare the Efficacy of LED, QTH and PAC Curing Lights. Oper Dent 2010;35:58-68.
9. Corciolani G, Vichi A, Davidson CL, Ferrari M. The influence of tip geometry and distance on light-curing efficacy. Oper
Dent 2008;33:325-331.
10. Stahl F, Ashworth SH, Jandt KD, Mills RW. Light-emitting diode (LED) polymerization of dental composites: flex-ural properties and polymerization potential. Biomater 2002;1:379-1385.
11. Roberts HW, Vandewalle KS, Berzins DW, Charlton DG. Accuracy of LED and halogen radiometers using different light sources. J Esthet Restor Dent 2006;18:214-222. 12. Jandt KD, Mills RW, Blackwell GB, Ashworth SH. Depth
of cure and compressive strength of dental composites cured with blue light emitting diodes (LEDs). Dent Mater 2001;6:41-47.
13. Rastelli ANS, Jacomassi DP, Bagnato VS. Degree of con-version and temperature increase of a composite resin light-cured with argon laser and blue LED. Las Phys 2008;18:1570-1575.
14. Rode KM, Kawano Y, Turbino ML. Evaluation of curing light distance on resin composite microhardness and polymer-ization. Oper Dent 2007;32:571-578.
15. Lovell LG, Lu H, Elliott JE, Stansbury JW, Bowman CN. The effect of cure rate on the mechanical properties of dental resins. Dent Mater 2001;17:504-511.
16. Ak AT, Alpoz AR, Bayraktar O, Ertugrul F. Monomer Re-lease from Resin Based Dental Materials Cured With LED and Halogen Lights. Eur J Dent 2010;4:34-40.
17. Costa SXS, Galvão MR, Jacomass DP, Bernardi MIB, Her-nandes AC, Rastelli ANS, Andrade MF. Continuous and gradual photo-activation methods: influence on degree of conversion and crosslink density of composite resins. J
Ther Anal Calorim 2011; 103:219-227.
18. Moraes LG, Rocha RS, Menegazzo LM, De Araujo EB, Yu-kimito K, Moraes JC. Infrared spectroscopy: a tool for de-termination of the degree of conversion in dental compos-ites. J Appl Oral Sci 2008;16:145-149.
19. Vandewalle KS, Ferracane JL, Hilton TJ, Erickson RL, Sak-aguchi RL. Effect of energy density on properties and mar-ginal integrity of posterior resin composite restorations.
Dent Mater 2004;20:96-106.
20. Alpöz AR, Ertuğrul F, Coguluc D, Akc AT, Tanoğlud M, Kay-ae E. Effects of Light Curing Method and Exposure Time on Mechanical Properties of Resin Based Dental Materials.
Eur J Dent 2008;2:37-42
21. Kurachi C, Tuboy AM, Magalhaes DV, Bagnato VS. Hardness evaluation of a dental composite polymerized with experi-mental LED-based devices. Dent Mater 2001;17:309-315.
22. Rode K.M, Kawano Y, Turbino ML. Evaluation of Curing Light Distance on Resin Composite Microhardness and Po-lymerization. Oper Dent 2007;32:571-578.
23. Hammesfahr PD, O’Connor MT, Wang X. Compend. Light-curing technology: past, present, and future. Compend
Con-tin Educ Dent 2002;23:18-24.
24. Galvão MR, Costa SXS, Victorino KR, Ribeiro AA, Menezes FCH, Rastelli ANS, Bagnato VS, Andrade MF. Influence of light guide tip used in the photo-activation on degree of conversion and hardness of one nanofilled dental compos-ite. Las Phys 2010;20:1-6.
25. Burgess JO, Walker RS, Porche CJ, Rappold AJ. Light curing--an update. Compend Contin Educ Dent 2002;23:889-892.
26. International Standard Organization-British Standard. Dentistry-Polymer-based filling, restorative and lut-ing materials BS EN International Standard Organization 4049:2000. Dentistry-Polymer-based filling, restorative and luting materials. 2000, Geneva, Switzerland.
27. Yap AU, Wong NY, Siow KS. Composite cure and shrink-age associated with high intensity curing light. Oper Dent 2003;28:357-364.
28. Øysæd H, Ruyter IE, Sjøvik, Kleven IJ. Release of formal-dehyde from dental composites. J Dent Res 1988;67:1289– 1294.
29. Yap AU, Soh MS, Han TT, Siow KS. Influence of curing lights and modes on cross-link density of dental composites.
Oper Dent 2004;29:410-415.
30. Asmussen E, Peutzfeldt A. Influence of pulse-delay curing on softening of polymer structures. J Dent Res 2001;80:1570-1573.
31. Ferracane JL, Greener EH. The effect of resin formulation on the degree of conversion and mechanical properties of dental restorative resins. J Biomed Mater Res 1986;20:121-131.
32. Ruyter IE, Oysaed I. Conversion in different depths of ultra-violet and visible light activated composite materials. Acta
Odont Scand 1982;40:179-192.
33. Silikas N, Eliades G, Watts DC. Light intensity effects on resin-composite degree of conversion and shrinkage strain. Dent Mater 2001;6:292-296.
34. Ferracane JL. Correlation between hardness and degree of conversion during setting reaction of unfilled dental restor-ative resins. Dent Mater 1985;1:11-14.
36. Cekic-Nagas Isil, Egilmez F, Ergun G. The Effect of Irradia-tion Distance on Microhardness of Resin Composites Cured with Different Light Curing Units. Eur J Dent 2010;4:440-446.
37. Mousavinasab SM, Meyers I. Comparison of Depth of Cure, Hardness and Heat Generation of LED and High Intensity QTH Light Sources. Eur J Dent 2011;5:299-304.
38. Sobrinho LC, Goes MF, Consani S, Sinhoreti MA, Knowles JC. Correlation between light intensity and exposure time on the hardness of composite resin. J Mater Scien: Mater
Medec 2000;11:361-364.
39. Mills RW, Uhl A, Blackwell GB, Klaus D. Jandt. High power light emitting diode (LED) arrays versus halogen light po-lymerization of oral biomaterials: Barcol hardness, com-pressive strength and radiometric properties. Biomater 2002;23:2955-2963.
40. Craig RG, Powers JM. Restorative Dental Materials. St. Louis: Ed. Mosby, 2002.
41. Sharkey S, Ray N, Burke F, Ziada H, Hannigan A. Surface hardness of light-activated resin composites cured by two different visible-light sources: an in vitro study.
Quintes-sence Int 2001;32:401-405.
42. Johnston WM, Leung RL, Fan PL. A mathematical model for post-irradiation hardening of photoactivated composite resins. Dent Mater 1985;1:191-194.
43. Polydorou O, Manolakis A, Hellwig E, Hahn P. Evaluation of the curing depth of two translucent composite materials using a halogen and two LED curing units. Clin Oral Invest 2008;12:45-51.
44. Watts DC, Amer O, Combe EC. Characteristics of visible-light-activated composite systems. Br Dent J 1984;156:209-215.
45. Sobrinho LC, De Lima AA, Consani S, Sinhoreti MA, Knowles JC. Influence of curing tip distance on composite Knoop hardness values. Braz Dent J 2000;11:11-17. 46. Wu D, Holmes BN, Mitra SB, Kolb BU, Thompson W,
John-son NJ. Wear resistance and mechanical properties of nov-el dental nanocomposites. J Dent Res 2002;81:p A-37. 47. Debastiani FS, Lopes GC. Direct posterior composite resins
restoration. Intern Journal Braz Dent 2005;1:31-39. 48. Mitra SB, Wu D, Holmes BN. An application of
nanotech-nology in advanced dental materials. J Am Dent Assoc 2003;134:1382-1390.
49. Bala O, Ölmez A, Kalayci S. Effect of LED and halogen light curing on polymerization of resin-based composites. J Oral