Jackeline Gallo do Amaral
ANÁLISE ESTRUTURAL E BIOQUÍMICA DA
HIDROXIAPATITA SUBMETIDA AO TRATAMENTO COM
FLUORETO E POLIFOSFATOS
Tese apresentada à Faculdade de Odontologia de Araçatuba da Universidade Estadual Paulista “Júlio de Mesquita Filho” – UNESP, como parte dos requisitos para a obtenção do título de Doutor em Ciência Odontológica – Área Saúde Bucal da Criança.
Orientador: Prof. Dr. Alberto Carlos Botazzo Delbem
Coorientador: Prof. Dr. Juliano Pelim Pessan
Araçatuba - SP
Catalogação-na-Publicação
Serviço Técnico de Biblioteca e Documentação – FOA / UNESP
Amaral, Jackeline Gallo do.
A485a Análise estrutural e bioquímica da hidroxiapatita submetida ao tratamento com fluoreto e polifosfatos / Jackeline Gallo do Amaral. -Araçatuba, 2014
112 f. : il. ; tab. + 1 CD-ROM
Tese (Doutorado) – Universidade Estadual Paulista, Faculdade de Odontologia de Araçatuba
Orientador: Prof. Alberto Carlos Botazzo Delbem Coorientador: Prof. Juliano Pelim Pessan
1. Polifosfatos 2. Fluoretos 3. Durapatita 4. Dissolução 5. Saliva I. Título
Black D27
D
DADOS CURRICULARES
JACKELINE GALLO DO AMARAL
Nascimento 08.05.1987 – São José do Rio Preto – SP
Filiação Luis Carlos Paulo do Amaral Aida Maria Gallo do Amaral
2005/2008 Curso de Graduação em Odontologia pela Faculdade de
Odontologia de Araçatuba – UNESP
2009/2011 Curso de Pós Graduação em Ciência Odontológica – Área Saúde Bucal da Criança, nível de Mestrado, na Faculdade de Odontologia de Araçatuba – UNESP
2012/2012 Estágio de Doutorado no Exterior, na University of Bristol, Reino Unido
2011/2014 Obtenção dos créditos referentes ao curso de Pós Graduação em Ciência Odontológica – Área Saúde Bucal da Criança, nível de Doutorado, na Faculdade de Odontologia de Araçatuba – UNESP
D
D
DEDICATÓRIA
Dedico a realização deste trabalho,
Aos meus pais,
Luis Carlos e Aida
, que nunca mediram esforços para que eu pudesse realizar meus sonhos, sempre me incentivando a persistir na busca dos meus ideais. O constante apoio e incentivo de vocês foram fundamentais para que eu pudesse chegar até aqui. Agradeço por tudo que me ensinaram, pelo exemplo de determinação, simplicidade, honestidade, felicidade e amor. Por todos os momentos em que podemos estar juntos e pelas palavras de conforto que sempre trazem segurança e tranquilidade. Não há palavras que expressem meu amor e admiração por vocês.A
A
AGRADECIMENTOS ESPECIAIS
Agradeço a
Deus
pela minha vida, por sua proteção e por guiar os meus passos rumo às minhas realizações. Devo a Ele todos os meus momentos de alegria e sucesso até aqui conquistados.Ao meu irmão,
Rodolfo,
pelos incentivos durante a minha vida, sempre presente nos momentos em que precisava. Por me fazer compreender como é bom ter uma família. Agradeço pelos momentos de alegria, pelo apoio e torcida.À
minha família
, sempre presente em minha vida, pelo apoio e confiança em mim depositados em toda a minha caminhada. Obrigada por fazerem parte da minha vida!Ao meu orientador,
PProf. Dr. Alberto Carlos Botazzo Delbem,
primeiramente pela confiança depositada em mim, pela disponibilidade, paciência e oportunidades ao decorrer destes anos. Agradeço por todo o esforço que dedicou ao desenvolvimento deste trabalho e por ter me proporcionado esses anos de orientação. Exemplo de dedicação, responsabilidade, competência, humildade e determinação com a pesquisa. Agradeço pelas grandes oportunidades e ensinamentos a mim proporcionadas ao longo da nossa convivência. Minha eterna gratidão e admiração.
Ao meu coorientador,
Prof. Juliano Pelim Pessan
, pela paciência, apoio e incentivo para que eu aproveitasse as oportunidades ao longo desta caminhada. Agradeço por todo o esforço que dedicou a esse trabalho e a preocupação para que eu pudesse aprimorar meus conhecimentos científicos. A seriedade, competência e dedicação que tem com a pesquisa e a docência são admiráveis. Agradeço toda ajuda e disponibilidade, eu aprendi muito estando ao seu lado.À
Profa. Michele Barbour,
minha admiração. Agradeço toda a sabedoria dividida no tempo em que pude aproveitar estando em seu grupo de pesquisa na Universidade de Bristol. Muito obrigada pela oportunidade.À
À Fundação de Amparo à Pesquisa do Estado de São Paulo (FAPESP) e
à Coordenação de Aperfeiçoamento de Pessoal de Nível Superior (CAPES)
peloA
A
AGRADECIMENTOS
À Faculdade de Odontologia de Araçatuba – UNESP, na pessoa de sua diretora, Profa. Dra. Ana Maria Pires Soubhia, e seu vice-diretor, Prof. Dr. Wilson Roberto Poi, pela oportunidade de realização do curso de Doutorado e toda minha formação nesta instituição, pelo aprendizado e crescimento pessoal e profissional proporcionado ao longo destes anos.
Ao curso de pós-graduação em Ciência Odontológica da Faculdade de Odontologia Araçatuba – UNESP, na pessoa do seu Coordenador, Prof. Dr. Alberto Carlos Botazzo Delbem. Minha sincera admiração pela competência e dedicação que tem para com o curso de pós-graduação.
Aos professores da Disciplina de Odontopediatria da UNESP-Araçatuba, Dr. Alberto, Dr. Célio, Dra. Cristiane, Dr. Juliano, Dr. Robson, Dra. Rosângela e Dra. Sandra. Obrigada por todos os ensinamentos e pela valiosa contribuição na minha formação acadêmica. Vocês proporcionaram oportunidades muito importantes para minha vida profissional. Não tenho palavras para agradecer todos os ensinamentos. Meus sinceros agradecimentos e admiração.
Ao Prof. Robson por seu exemplo de dedicação ao ensino da Odontopediatria. Obrigada pelos momentos valiosos de aprendizado durante as disciplinas teóricas e durante os atendimentos na Bebê Clínica e Graduação. Cada minuto ao seu lado é suficiente para grandes aprendizados. Tenho muita admiração pela forma como orienta seus alunos.
À Universidade de Bristol e ao Bristol Dental Hospital pela receptividade e grande oportunidade de realizar o doutorado sanduíche.
Ao Departamento de Física e Química da Faculdade de Engenharia de Ilha Solteira- UNESP, representado por todos os seus Professores e Funcionários, pela oportunidade de realizar parte do meu trabalho e por todo o aprendizado.
Aos alunos de Mestrado, Doutorado, Pós-Doutorado e Iniciação Científica: Ana Laura, Fernanda, Jaqueline, José Antônio, Kevin, Marcela, Márjully, Mariana, Thayse, Valéria, Lais, Giovana, Samia, Daniela Oliveira, Danielle, Maria Daniela, Michele, Nathália, Natália, Paula, Tatiana, Remberto, Carla, Karina, Kelly, Carolina Lodi, Douglas, Vinicius, Kamila, Flávia, Jéssica, Amanda, Adriana e Thiago pela amizade, experiências compartilhadas e pelos momentos divertidos que passamos juntos.
Ao aluno de mestrado José Antonio, pelo grande auxílio para o desenvolvimento deste trabalho.
A Profa. Cleide, pela amizade, pelos ensinamentos e orientação durante o início da minha pós graduação.
À amiga Karina Kondo, agradeço pela amizade sincera, pelo apoio, e pelos momentos de diversão. Senti muita falta da sua companhia aqui quando você terminou a pós-graduação. Torço muito pelo seu sucesso e felicidade.
À amiga Janaína, muito obrigado por ter sido uma grande amiga para mim durante esses anos, pela ajuda, e mesmo com a distância, por estar sempre presente de alguma forma. Desejo muita felicidade e sucesso.
Aos colegas do Laboratório de pesquisa da Universidade de Bristol, Natalie, Ahmed, Olivia e Ed por toda ajuda quando cheguei à Universidade de Bristol e durante a minha estadia na Inglaterra, pela amizade e pelos momentos de diversão. A todos os amigos brasileiros e estrangeiros que fiz durante a minha estadia na Inglaterra, que tornaram a distância do Brasil um pouco menor.
e pela disponibilidade em ajudar. Em especial, Valéria, Cristiane e Lilian, pela atenção e ajuda dada para a realização do Estágio PDSE.
À Profa. Dra. Kikue, pela ajuda, paciência e disponibilidade com que sempre me atendeu, desde a graduação até o início deste trabalho. Aprendi muito ao seu lado. Muito obrigada.
À funcionária da Disciplina de Odontopediatria, Maria dos Santos Ferreira Fernandes, por toda ajuda nos procedimentos laboratoriais desde minha graduação, além da amizade e convivência, sou muito grata por tudo. Você faz muita falta no laboratório!
Aos demais professores e funcionários da Faculdade de Odontologia de Araçatuba – UNESP, por todos os ensinamentos ao longo destes anos, pelo exemplo que são e pela convivência sempre agradável.
A todos aqueles que contribuíram para a elaboração e conclusão deste trabalho,
E
E
EPÍGRAFE
“A mente humana que se abre a uma nova idéia jamais voltará
ao seu tamanho original.”
R
Amaral, JG. Análise estrutural e bioquímica da hidroxiapatita submetida ao tratamento com fluoreto e polifosfatos. [tese] Araçatuba: Universidade Estadual Paulista; 2014.
RESUMO GERAL
HA sintetizada. Todas as soluções avaliadas mostraram uma redução na taxa de dissolução dos discos de HA (30 min) (p <0,001). No entanto, a duração do efeito inibitório foi maior quando 8% de HMP e 1 ou 8% de HMP com F foram testadas (p <0,001). A presença da película salivar promoveu maior proteção para todos os grupos, comparado com outros discos sem película (p <0,001). Em conclusão, quando TMP e F são coadministrados, estes competem pelo mesmo sítio de ligação na HA. Uma proporção de TMP:F ideal pode proporcionar uma melhora dos produtos fluoretados e precipitar uma HA com baixa solubilidade. A redução da dissolução da HA, bem como a duração deste efeito foi influenciada pelo fluoreto, tipo e concentração de sal de fosfato, além da presença da película salivar.
G
Amaral, JG. Structural and biochemical analysis of hydroxyapatite submitted to the treatment with fluoride and polyphosphates. [thesis]. Araçatuba: Universidade Estadual Paulista; 2014.
GENERAL ABSTRACT
when 8% HMP and 1 or 8% HMP associated with F were assessed (p<0.001). The presence of salivary pellicle led to higher protection for all groups when compared to discs without pellicle (p<0.001). In conclusion, when TMP and F are co-administered, TMP and F compete for the same binding sites in the HA. An ideal TMP:F ratio can provide an enhancement of the fluoride products and precipitate a HA with low solubility. In addition to, the reduction of HA discs dissolution rate, as well as the duration of this effect were influenced by fluoride, type and concentration of phosphate salt and the presence of a salivary pellicle.
Key-words: Polyphosphates, Fluoride, Durapatite, Dissolution, Saliva.
L
LISTA DE FIGURAS
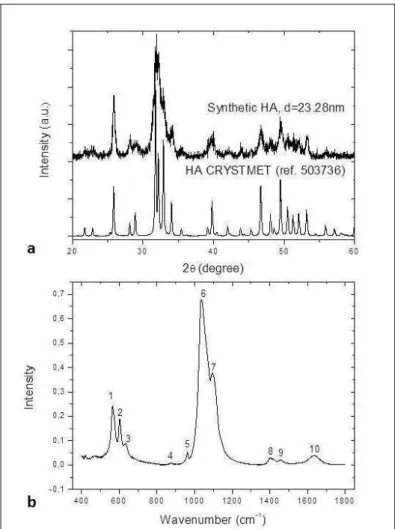
Capítulo 1 Effect of sodium trimetaphosphate and fluoride on hydroxyapatite solubility: an in vitro study...…… 37 Figure 1 a: XRD patterns of the synthetic HA and CRYSTMET
database. b: HA spectra obtained for synthetic HA (Peaks 1,2: PO43-, 3: OH-, 4: HPO42-, 5, 6 and 7, PO43; 8 and 9: CO3-; 10:
H20)………...……… 51
Figure 2 XRD patterns of HA according to the groups evaluated associated with TMP. 0 ppm F (a); 100 ppm F (b); 250 ppm F (c); 500 ppm F (d). The diameter values (nm) of the crystal after pH cycle according to the fluoride concentration (ppm F) and percentage of TMP are represented by the letter
d……… 52
Figure 3 Mean (± se) of values of Ca (a), P (b) and Ca/P ratio (c) on hydroxyapatite synthetized and after pH cycle according to the F and TMP concentration. Correlation: concentration of calcium and phosphorus on hydroxyapatite (d). Distinct letters show significant differences between the % TMP for each fluoride concentration (Student-Newman-Keuls, p <0.05). (*) 0 ppm F = 100 ppm F = 250 ppm F; (&) 0 ppm F = 100 ppm F; ()) 0 ppm F = 250 ppm F; (#) 100 ppm F = 250 ppm F; (O) 0 ppm F = 500 ppm F; (:) 100 ppm F = 500 ppm F; (\) 250 ppm F = 500 ppm F; (Z) 100 ppm F = 250 ppm F = 500 ppm
F……….…... 53
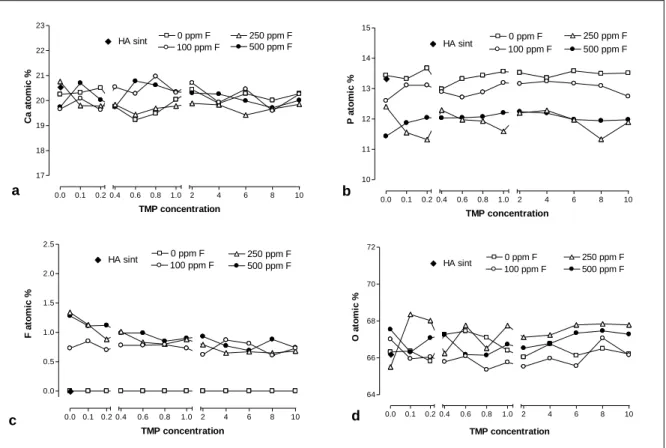
Figure 4 Atomic % of Ca (a), P (b), F (c) and O (d) in HA according to the F concentration associated with TMP………. 54 Figure 5 Mean (± se) of alkali-soluble F on HA after treatment (a) and
Figure 6 Mean (± se) of F and TMP adsorbed to hydroxyapatite (a) adsorption of TMP (expressed through the amount of phosphorus), (b) adsorption of F. Distinct letters show significant differences between the %TMP for each fluoride concentration (Student-Newman-Keuls, p <0.05). (*) All comparisons show similarity; (&) 100 ppm F = 250 ppm F = 500 ppm F; (O) 250 ppm F = 500 ppm F; ()) no difference among the %TMP in 0 ppm F group………...…..….. 56
Capítulo 2 Biochemical analysis of hydroxyapatite solubility treated
with fluoride and sodium trimetaphosphate……… 59 Figure 1 a: XRD patterns of the synthetic HA and CRYSTMET
database. b: HA spectra obtained for synthetic HA (Peaks 1,2: PO43-, 3: OH-, 4: HPO42-, 5, 6 and 7, PO43; 8 and 9: CO3-; 10:
H20)………...… 74
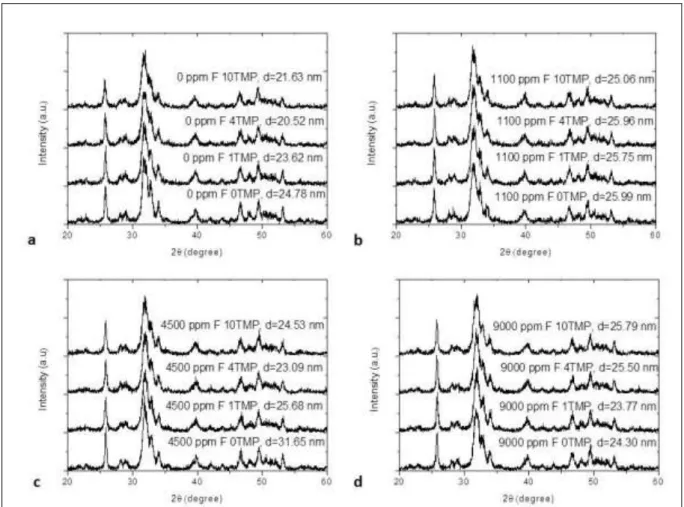
Figure 2 XRD patterns of HA according to the groups evaluated associated with TMP. 0 ppm F (a); 1100 ppm F (b); 4500 ppm F (c); 9000 ppm F (d). The diameter values (nm) of the crystal after pH cycle according to the fluoride concentration (ppm F) and percentage of TMP are represented by the letter
d……….… 75
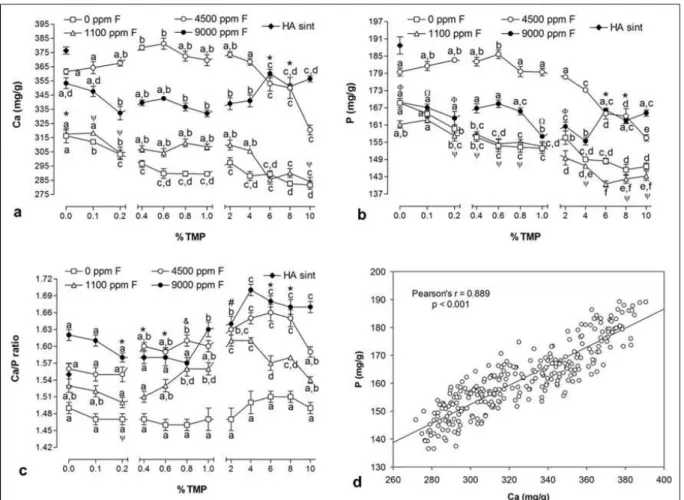
Figure 3 Mean (± se) of values of Ca (a), P (b) and Ca/P ratio (c) on hydroxyapatite after pH cycle according to the fluoride and TMP concentration. Correlation between calcium and phosphorus concentrations on hydroxyapatite (d). Distinct letters show significant differences between the % TMP for each fluoride concentration (Student-Newman-Keuls, p <0.05). (*) 4500 ppm F = 9000 ppm F; (&) 1100 ppm F = 9000 ppm F; (#) 1100 ppm F = 4500 ppm F; (\) 0 ppm F and 1100 ppm F; ()) 0 ppm F and 9000 ppm F; (:) 0 ppm F = 1100 ppm F =
9000 ppm
F……… 76
respectively……….… 77 Figure 5 Atomic % of Ca (a), P (b), F (c) and O (d) in HA according to
the F concentration associated with TMP. * Synthetic HA (% atomic): Ca= 20.55; P=13.33; O=66.12; F=0……… 78 Figure 6 Mean (± se) of F and TMP adsorbed to hydroxyapatite (a)
adsorption of TMP (expressed through the amount of phosphorus), (b) adsorption of F. Distinct letters show significant differences between the %TMP for each fluoride concentration (Student-Newman-Keuls, p <0.05). (*) All comparisons show similarity; (&) 1100 ppm F = 4500 ppm F = 9000 ppm F; (#) 0 ppm F = 1100 ppm F; (O) 4500 ppm F = 9000 ppm F; (\) 0 ppm F = 1100 ppm F = 4500 ppm F………. 79
Capítulo 3 Effects of polyphosphates and fluoride on hydroxyapatite dissolution: a pH-stat investigation………... 82 Figure 1 Dissolution rate of HA for the three control runs before
treatment (C1-3) and after treatment (Post 1-3) with 1100 ppm F. Dashed line= mean control rate. *Significantly different from
mean baseline control……….. 94
Figure 2 Dissolution rate of HA for the three control runs before treatment (C1-3) and after treatment (Post 1-3) with TMP and fluoride. Dashed line= mean control rate. *Significantly different from mean baseline control……….….….. 95 Figure 3 Dissolution rate of HA for the three control runs before
treatment (C1-3) and after treatment (Post 1-3) with HMP and fluoride. Dashed line= mean control rate. *Significantly different from mean baseline control……….……… 96 Figure 4 Graphic representation of HA dissolution rate reduction
according to the treatments, saliva and post-treatment run. a= post-treatment 1 (30min), b=post-treatment 2 (60min) and c= post-treatment 3 (90min). Bars indicate the standard deviation of the mean. Distinct capital letters represent statistical difference between the groups without salivary pellicle. Different lowercase letters represent statistical difference between the groups with salivary pellicle (Holm-Sidak, p
LISTA DE TABELAS
Capítulo 1 Effect of sodium trimetaphosphate and fluoride on hydroxyapatite solubility: an in vitro study......…… 37
Table 1 Absorption coefficient obtained in the FTIR analysis according to the groups evaluated regarding the F and TMP concentration……….. 57 Capítulo 2 Biochemical analysis of hydroxyapatite solubility treated
with fluoride and sodium trimetaphosphate……… 59
Table 1 Absorption coefficient obtained in the FTIR analysis according to the groups evaluated regarding the F and TMP
Lista de Abreviaturas
a.u.= Unidade aleatória °C= Graus Celsius µ= Micro
µL= Microlitro
µg F/g= Microgramas de fluoreto por grama ppm F= partes por milhão de fluoreto
Ca= Cálcio
Ca(NO3)2 .H2O= Nitrato de cálcio hidratado
DP= Desvio padrão se= Erro padrão F= Fluoreto FA= Fuorapatita
FTIR= Espectroscopia no infravermelho transformada de Fourier g= Gramas
g= Gravidade
KOH= Hidróxido de Potássio h= Hora
H2O= Água
HA= Hidroxiapatita HCl= Ácido Clorídrico
HMP= Hexametafosfato de sódio L= Litro
min= Minuto mL= Mililitro mm= Milímetro
mm2= Milímetro quadrado mmHg= Milímetro de Mercúrio mol L-1= Molaridade
nm= Nanômetro
NH4OH= Hidróxido de amônio
P= Fosfato
pH= Potencial hidrogeniônico s= Segundo
TISAB= Total ionic strenght adjustment buffer (Tampão ajustador de força iônica) TMP= Trimetafosfato de sódio
ѵ1= Estiramento simétrico ѵ2 = Vibração angular
ѵ3= Estiramento assimétrico ѵ4= Vibração angular
SUMÁRIO
1. Introdução Geral... 32
2. Capítulo 1 - Effect of sodium trimetaphosphate and fluoride on hydroxyapatite solubility: an in vitro study………..
2.1. Abstract……….. 2.2. Introduction……….. 2.3. Materials and Methods……….…………... 2.4. Results………...………
2.5. Discussion………...………....
2.6. Conclusion... 37 38 39 43 45 47
3. Capítulo 2 - Biochemical analysis of hydroxyapatite solubility treated with fluoride and sodium trimetaphosphate ……….…..
3.1. Abstract... 3.2. Introduction... 3.3. Materials and Methods... 3.4. Results... 3.5. Discussion... 3.6. Conclusion... 59 60 61 65 67 70
4. Capítulo 3 - Effects of polyphosphates and fluoride on hydroxyapatite dissolution: a pH-stat investigation………... 4.1. Abstract………...……….. 4.2. Introduction... 4.3. Materials and Methods... 4.4. Results... 4.5. Discussion and Conclusion...
82 83 84 87 88
32
Jackeline Gallo do Amaral
1. Introdução Geral
O esmalte dentário é composto predominantemente de hidroxiapatita (HA) e pode estar susceptível a dois tipos de desmineralização: provocada por ácidos provenientes do biofilme dentário (microrganismos), denominada de cárie dentária, ou por ácidos advindos da alimentação, medicamentos, meio ambiente ou ácido gástricos, chamada de erosão dentária (Imfeld, 1996; Wiegand et al., 2007), os quais produzem lesões diferentes na estrutura do esmalte.
O fluoreto (F) é o principal agente utilizado no controle da cárie dentária mundialmente, sendo administrado por métodos de alcance comunitário, bem como de auto-aplicação e para uso pelo profissional (Pessan et al., 2011). Dentre os veículos mais utilizados, a água de abastecimento e os dentifrícios fluoretados são o mais amplamente difundidos. O principal efeito dos produtos fluoretados aplicados topicamente está relacionado à maior retenção de F na superfície dental na forma de fluoreto de cálcio (CaF2), o qual age fornecendo F livre para atuar durante períodos
de queda de pH, intervindo diretamente na dinâmica do processo des-remineralização (Buzalaf et al., 2011). Embora uma marcante redução da incidência e prevalência da cárie dentária tenha sido observada no mundo, em regiões e populações específicas são encontradas acentuadas diferenças em relação à prevalência de cárie (Narvia et al., 2000; Antunes et al., 2004; Dye et al., 2007). Recentemente, a terapia com F também tem sido estudada e empregada no controle da progressão do desgaste dental erosivo (Ganss et al., 2013), o qual, apesar de ainda não ser caracterizado como um problema de saúde pública, vem acometendo crianças, adolescentes e adultos em diversas partes do mundo (Johansson et al., 2012).
33
Jackeline Gallo do Amaral
tipos de produtos odontológicos (Takeshita et al., 2009, 2011; Moretto et al., 2013; Manarelli et al., 2011, Pancote et al., 2014, Camara et al., 2014) vem sendo estudada mais intensamente nos últimos anos. Estudos mostraram que o trimetafosfato de sódio (TMP) e o hexametafosfato de sódio (HMP) apresentam efeitos protetores tanto para cárie quanto para a erosão (Takeshita et al., 2009, 2011; Moretto et al., 2013; Manarelli et al., 2011, Pancote et al., 2014, Camara et al., 2014).
O TMP é um polifosfato cíclico condensado e, de acordo com a literatura, preserva a estabilidade e integridade da superfície do mineral do esmalte (Gonzalez, 1971). Estudos recentes mostram que produtos com uma proporção adequada de TMP:F podem proporcionar um efeito protetor maior que em produtos fluoretados convencionais, tanto nos processos erosivos (Moretto et al., 2010, 2013; Manarelli et al., 2011; Pancote et al., 2014) quanto na cárie dentária (Takeshita et al., 2009, 2010; Danelon et al., 2014; Manarelli et al., 2014). Acredita-se que o mecanismo de ação esteja relacionado com a adsorção deste composto à superfície do esmalte, limitando a difusão de ácidos para o esmalte (Van Dijk et al., 1980; Takeshita et al., 2011, Manarelli et al., 2014). Takeshita et al. (2009) demonstraram que a associação de 1% de TMP a um dentifrício com 500 ppm F promoveu um efeito protetor contra a desmineralização do esmalte in vitro semelhante à um dentifrício convencional contendo 1100 ppm F. O mesmo dentifrício apresentou efeito protetor contra a erosão/abrasão semelhante ao de um dentifrício contendo 5000 ppm F(Moretto et al., 2010). Recentemente, um estudo clínico avaliou a progressão de cárie em crianças utilizando um dentifrício de baixa concentração de F (500 ppm F) associado a 1%TMP e um dentifrício padrão comercial (1100 ppm F), tendo demonstrado uma superioridade do dentifrício contendo TMP em crianças com experiência prévia de cárie (Amaral et al., 2014)
34
Jackeline Gallo do Amaral
associado a 0,5% de HMP in vitro, tendo obtido um efeito anticariogênico similar ao de um dentifrício convencional (1100 ppm F).
No entanto, tanto para o TMP como para o HMP, parece haver uma proporção apropriada de polifosfato:F para que a efetividade máxima seja obtida, o que pode estar relacionado ao mecanismo de ação destes polifosfatos associados ao F. Este parece ocorrer devido a uma formação de uma "barreira" na superfície do esmalte, que pode fornecer proteção contra a perda mineral em desafios cariogênicos e erosivos (Camara et al, 2013; Souza et al, 2013; Manarelli et al. 2014). Neste sentido, o F e TMP parecem competir pelos mesmos sítios de ligação na hidroxiapatita (Souza et al., 2013). No entanto, os protocolos mencionados acima não fornecem informações detalhadas sobre a interação entre o F e TMP ou HMP com a estrutura do esmalte. Dado que o mecanismo de ação do F associado ao TMP ou HMP não está completamente elucidado, seria interessante avaliar a interação direta desses compostos com a HA, que é o principal componente mineral do esmalte através de análises bioquímicas e estruturais.
35
Jackeline Gallo do Amaral
dissolução de discos de HA, com e sem formação da película salivar, foram avaliados.
Para responder aos questionamentos acima propostos, o presente trablaho foi dividido em 3 capítulos, a saber:
- Capítulo 1: Effect of sodium trimetaphosphate and fluoride on
hydroxyapatite solubility: an in vitro study (artigo redigido de acordo com as normas
do periódico Journal of Materials Science: Materials in Medicine);
- Capítulo 2: Biochemical and structural analysis of hydroxyapatite solubility
treated with fluoride and sodium trimetaphosphate (artigo redigido de acordo com as
normas do periódico Journal of Materials Science: Materials in Medicine);
- Capítulo 3: Effects of polyphosphates and fluoride on hydroxyapatite
dissolution: a pH-stat investigation (artigo redigido de acordo com as normas do
periódico Caries Research).
36
Jackeline Gallo do Amaral
37
Jackeline Gallo do Amaral
Effect of sodium trimetaphosphate and fluoride on hydroxyapatite solubility:
an in vitro study
2.1 Abstract
This study aimed to evaluate the effect of sodium trimetaphosphate (TMP) associated with fluoride (F) on hydroxyapatite (HA) biochemical and physical properties after a pH-cycle. Synthetic HA powder (1.0 g, n=6) was suspended in TMP solutions varying at 0-10% associated with 0, 100, 250 and 500 ppm F and submitted to a pH cycle. The concentration of alkali- and acid-soluble F, Ca and P were determined in/on HA and P and F in the supernatant. Samples were analyzed by energy-dispersive X-ray spectroscopy (EDX), Fourier transformed infrared spectroscopy (FTIR) and X-ray diffraction (XRD). Data were submitted to ANOVA and Student-Newman-Keuls’ test (p<0.05). The highest Ca/P ratios were observed for HA treated with TMP at 0.4%-0.8% combined with 250 ppm F, and between 0.6%-2% with 500 ppm F (p<0.05). The increase of TMP led to a reduced acid-soluble F incorporation in HA for all groups (p<0.05). Additionally, the increase in TMP concentrations led to higher P adsorption to HA for the 0 and 100 ppm F solutions, but lower for the 250 and 500 ppm F solutions (p<0.05). A reduction of the size of the HA crystallites was seen with increasing TMP concentrations. The FTIR spectra showed alterations in the bands corresponding to phosphates and to carbonate for all groups when compared to the HA synthetized. Thus, F and TMP in combination can precipitate a HA lower soluble and the action mechanism seems to be related with the TMP adsorption on enamel surface by binding to HA.
Keywords: hydroxyapatite; polyphosphates; fluoride; dissolution.
38
Jackeline Gallo do Amaral
2.2 Introduction
Calcium phosphates have been used as biomaterials and have been considered as tissue engineering scaffolds because their similarity to the mineral phase of hard tissue in the body. HA is a calcium phosphate widely used due its unique properties as biodegradation and bioactivity [1]. These properties added to its high capacity to adsorption and/or absorption molecules may provide an excellent support for prolonged action of anticancer drugs for the treatment of bone tumors. Moreover, the chemical and structural features of HA allow its use in medical field as biocompatible material in implants and prosthesis. In dentistry, HA has been used to avoid bone loss after the restoration or extraction of a tooth, for example. In addition, titanium implants coated with HA have been used to replace the root [2].
In human tooth enamel, hydroxyapatite (HA - Ca10(PO4)6(OH)2) crystals are
arranged into highly organized prisms to form the main unit. In the oral cavity, dental enamel can be damaged by the local cariogenic bacteria in biofilm (caries) or non-bacterially derived erosive challenges (such as acidic beverages) [3]. The maintenance of HA in dental structures by decreasing its dissolution can be achieved by the use of fluoride-containing products, such as mouthrinses, toothpastes, fluoride varnishes, gels and restoratives materials [4].
39
Jackeline Gallo do Amaral
HA would not be influenced by the presence of TMP and F, either alone or in combination.
2.3 Materials and Methods
Synthesis of HA
HA powder was prepared based on the protocol by Qu and Wei [12]. Briefly, 300 mL of 1 mol/L calcium nitrate solution (Ca (NO3)2·H2O, Sigma-Aldrich Corp. St.
Louis, MO, USA) and 600 mL of 0.3 mol/L diammonium phosphate solution ((NH4)2HPO4, 600 mL, Sigma-Aldrich Corp. St. Louis, MO, USA) were prepared and
had their pH raised to 10–12 by adding NH4OH (29.5%). Afterwards, the
diammonium phosphate solution was added slowly to the calcium nitrate solution (2– 5 mL/min), under constant agitation at 37°C. The precipitates were aged for 7 days at 37°C and the pH was adjusted diary at around 10 in order to allow the growth and a formation of a single crystalline phase. The system remained open in order to precipitate a carbonated HA similar to that presented in the dental tissue. Then, the precipitate was filtered using a Buchner funnel attached to a vacuum system (–600 mmHg), washed with anhydrous ethanol and with deionized water (250 ml/0.5 g HA) to remove the contaminant ions (NH4+ and NO3-) [9]. The precipitate was dried for 24
h at 70°C and then ground into a fine powder (particle size less than 53 µm) using a ball mill (Pulverisette 7, Fritsch, Germany). Six samples of approximately 0.5 g were separated for characterization through energy-dispersive X-ray spectroscopy (EDX), infrared spectroscopy (FTIR) and X-ray diffraction (XRD) and to perform the F, calcium (Ca) and phosphorus (P) analysis (Anexo B).
Treatment and pH Cycle
Solutions (100 mL, n=6) containing TMP (Na3P3O9, Sigma-Aldrich Co., USA)
40
Jackeline Gallo do Amaral
Fritsch, Germany). During the treatment of synthetic HA powder, an aliquot of the suspension was collected, centrifuged for 1 min at 2900 × g. (Combi – 514R) in order to calculate the P and F adsorption in the HA. After the treatment, HA samples (0.5 g) of each group was suspended in deionized water and the pH of the suspensions was slowly reduced to 4.0 using 1 mol L-1 nitric acid (HNO3, Merck, Darmstadt,
Germany) under agitation. After 30 min, the pH of each solution was raised to 7.0 by the addition of 1 mol L-1 sodium hydroxide (NaOH, Merck, Darmstadt, Germany) which was maintained during 30 min. Samples of synthetic HA powder (n= 6) were suspended in deionized water as a negative control. After completion of this process, the precipitates were separated by filtration, washed with deionized water, dried for 24 h at 37°C and ground into a fine powder as described above. Thus, HA was analyzed for F, Ca, and P concentration and by EDX, FTIR and XRD (Anexo C).
Calcium and phosphorus analysis in hydroxyapatite
For Ca and P determination, 5 mg of HA powder was weighed into pre-weighed micro-centrifuge tubes and 2.0 mL of 1 mol L-1 HCl was added. After agitation for 1 h (Shaker, SK-300, Lab. Companion, Kimpo City, Korea), the samples were diluted (1:10) and partly neutralized to avoid the HA powder precipitation. Aliquots of 5 µL were taken from the samples and added to 50 µL of deionized water and Arsenazo solution. For calibration, standards containing 40 to 200 µg Ca/mL were used. The Ca analysis was performed using a spectrophotometer (Microplate Spectrophotometer EONC, Biotek, USA) with a wavelength of 650 nm by adopting the Arsenazo III colorimetric method described by Vogel et al. [13]. Phosphorus was measured by the molybdate method colorimetric method described by Fiske and Subbarow [14] with a wavelength of 660 nm and using aliquots of 20 µL from the samples, which were subsequently added to a mixture of 50 µL molybdate solution and 20 µL of reactive reducer. Standards containing 1.5 to 24 µg P/mL were used. The Ca and P analyses were realized in duplicate (Anexo D).
Fluoride analysis (alkali-soluble and acid-soluble F)
SK-41
Jackeline Gallo do Amaral
300, Lab. Companion, Kimpo City, Korea), the samples were centrifuged (Combi – 514R) for 20 min at 2900 × g. A 0.5 mL aliquot of the supernatant was neutralized with 0.5 mL of TISAB II (total ionic strength adjustment buffer) modified with 1 mol L-1 HCl (0.82 mL HCl/L). Alkali-soluble F was determined by using a specific electrode 9409BN (Thermo Scientific, Beverly, MA, USA) and reference electrode (Analyser, Sao Paulo, Brazil) connected to an ion analyzer (Orion 720A+ Thermo Scientific, Beverly, MA, USA). For determination of acid-soluble F, the precipitate was washed three times with deionized water and once with methanol. After methanol evaporation (overnight at 60 °C), 1 mL of 1 mol L-1 HCl was added, and the samples were homogenized for 30 s by vortexing, and subsequently agitated for 1 h at room temperature. 0.5 mL aliquot of these samples was then added to 0.5 mL of TISAB II modified with 20 g NaOH/L. Samples were analyzed for acid-soluble F as described for alkali-soluble F. The F analyses were performed in duplicate [11] (Anexo E).
Phosphorous and fluoride analysis in suspension of HA treatment
F and P concentrations were determined in supernatants removed from the suspensions during the HA treatment. Phosphorus was determined using an aliquot of 100 µL of sample and standards, plus 50 µL molybdate and 20 µL of reactive reducer through the colorimetric method described by Fiske & Subbarow [14]. The fluoride was determined by a specific electrode 9409BN (Thermo Scientific, Beverly, MA, USA) and inverted reference electrode (Orion 900100) coupled to an ion analyzer (Orion 720 A+, Thermo Scientific, Beverly, MA, USA). The electrode was calibrated with standards containing 0.25 to 4.00 µg F / ml and 4.0 to 64.0 µg F / ml under the same conditions of samples. Aliquots of 40 µL of samples and the same volume of TISAB II were dispensed on the active tip of the reference electrode. Analyses were performed in duplicate. Afterwards, the adsorption of F and TMP to hydroxyapatite was calculed from the initial concentrations of these compounds in the solutions and the concentration during the HA treatment.
Energy-dispersive X-ray spectroscopy (EDX)
42
Jackeline Gallo do Amaral
coupled with an energy-dispersive X-ray spectroscopy (EDX), Oxford Instrument’s brand, model INCA X-act with resolution of 133eV.
X-Ray Diffraction (XRD)
Samples (n=1) of each fluoride group of HA associated with TMP concentrations at 0, 0.4, 1, 6 and 10%, were prepared and placed in sample holder to the XDR analysis. Powder XRD was performed at room temperature, using Cu-Kα radiation (Ultima IV X-ray diffractometer, Rigaku Corp., Osaka, Japan) generated at a voltage of 40 kV and a current of 20 mA. The scanning range (2θ) was from 10 to 60° with a step size of 0.02°. The CRYSTMET database (Toth Information Systems Inc., Ottawa, Canada) was used for phase identification. The crystallite sizes were estimated using the Scherrer equation (d= K λ/ β cos θB), where d is the diameter
dimension of the crystalline particle, K (0.9) is the slope factor, λ is the wavelength of the incident X-ray (1.542 Å), β is the line broadening at half the maximum intensity (FWHM), θB is the Bragg angle obtained from the XRD pattern.
FTIR Spectroscopy (FTIR)
Groups selected for XDR analysis were mixed with powder potassium bromide (KBr), in the proportion of 1 mg of sample to 600 mg of KBr (n=1). Soon after, a pellet was prepared with 170 mg of this mixture (sample plus KBr). The infrared absorbance spectra were recorded by the absorbance method in an FTIR spectrophotometer (Nexus 670, Nicolet Instrument Corporation Madison, USA) using 128 scans at 4 cm-1 resolution in the spectral range between 400 and 4000 cm-1. The intensity of the absorption band was divided by the pellet thickness, and the coefficient of absorption (α; in cm-1) was measured regarding the baseline joining the points of lowest absorbance on the peak using the subtraction of a straight line. The error of α measurement was of the 0.005 order.
Data analysis
43
Jackeline Gallo do Amaral
between Ca and P in HA (Pearson’s test) was calculated to quantify the relationships between these ions. EDX data were described as atomic percentage of the elements. Data from structural analysis were described as a function of the presence of specific bands obtained from diverse treatment submitted to the pH cycle. FTIR data were analyzed as absorption coefficient and data obtained from XRD were analysed through diameter values of crystallite sizes.
2.4 Results
The XRD pattern obtained for the synthetic HA is shown in Figure 1a. This pattern was compared with that available at the CRYSTMET database, confirming that the material obtained by the method described above consists only of HA. The diffractograms obtained for all samples were similar to the pattern seen at CRYSTMET, but differences in the size of crystals were observed (Figure 2). A reduction of the crystallites was seen with increased TMP concentrations in the most of groups. The treatment of HA with the 500 ppm F solution associated to 1% TMP (Figure 2d) promoted an increase of its crystallinity when compared to the synthetic HA (Figure 1a). Solutions containing F without TMP led to an increase of the HA crystals in comparison to synthetic HA and an increase of the F concentration in the groups without TMP promoted an increase in the size of the crystallites.
The infrared absorption spectra of the HA synthetized are presented in the Figure 1b. The characteristic bands of the HA corresponding to the functional groups of the phosphates (PO43-) and hydroxyl (OH-) were observed at all spectra. The
phosphate presented absorption bands between 960 and 1000 cm-1 (symmetric stretching - Q1), 1000 and 1200 cm-1 (asymmetric stretching - Q3) 540 and 580
(angular vibration - Q4) and, 600 and 620 cm-1 (angular vibration - Q4). The OH- band
44
Jackeline Gallo do Amaral
The bands at 1418 and 1451 cm-1 are related to the vibrational mode Q3
(stretching) of the carbonate group that presented lower intensity at the groups with F and TMP compared with the synthetic HA (Table 1). With the increase of TMP concentration, there was a reduction in the intensity of these bands. For all groups, a reduction in the intensity of the OH- band at 634 cm-1 can be observed in relation to the HA synthetized. Monohydrogen phosphate (HPO42-) ions can be detected from
the peaks at 875 and 868 cm-1 at the carbonated HA. In the groups with F and TMP, it was observed a reduction of this band in relation to the synthetic HA.
Figure 3 shows Ca and P concentrations in HA, and Ca/P ratio among the groups tested. Increases in the percentage of TMP in the solutions led to lower Ca content in HA for all groups (p<0.05) (Anexo F). A similar pattern was seen for P concentrations in HA. This behavior can be seen in Figures 3a and 3b. Ca/P ratios were greatly influenced by both F and TMP in the solutions. For the F-free solution, TMP did not affect Ca/P ratio at any concentration tested (p>0.05). On the other hand, a dose-dependent trend between TMP and Ca/P ratio was observed for the F solutions. Samples with TMP concentration between 0.4% and 1% presented significantly higher values of Ca/P ratio for the 250 ppm F, as well as between 0.6% and 2% for the 500 ppm F solution (p<0.05). A strong positive correlation (r=0.820, p<0.001) was observed between Ca and P in the HA structure (Figure 3d). EDX analysis showed the % atomic of Ca, P, F and O (Figure 4), showing that traces of fluoride were observed according to the fluoride and TMP concentration tested (Anexo G).
45
Jackeline Gallo do Amaral
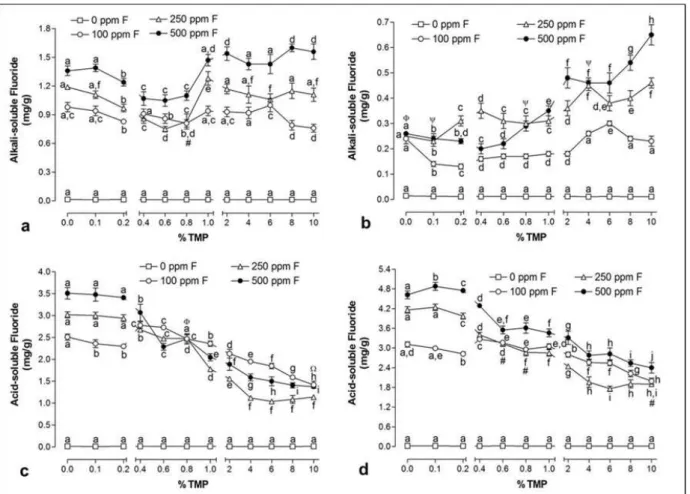
between 2% and 10% showed the highest alkali-soluble F among all samples. Alkali-soluble F values in post-cycle samples were lower than those for the post-treatment samples.
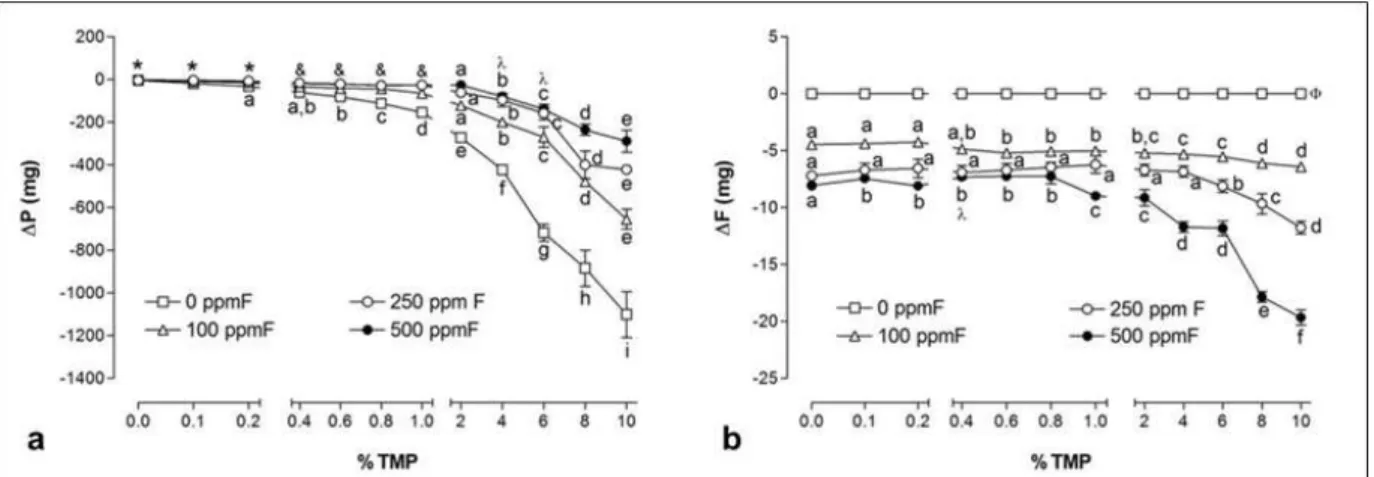
Estimated F and TMP adsorption to HA is shown in Figure 6. Increase of TMP concentration led to a higher P adsorption in the HA structure for the 0 and 100 ppm F, while lower adsorption was seen for the solutions with the highest concentrations of fluoride (250 and 500 ppm F) (p<0.05) (Figure 6a). Fluoride adsorbed was proportional to the F concentration presented in the solutions and related to the alkali-soluble F on HA (p<0.05) (Figures 6b).
2.5 Discussion
This study evaluated the structural and biochemical alterations of HA treated with F and TMP using a pH cycle model, in order to provide additional data for a better understanding on the mechanisms of action of this phosphate. The present results showed that biochemical and physical properties of HA can be significantly modified by the presence of F and TMP in combination, in comparison with F or TMP alone, thus leading to the rejection of the study’s null hypothesis.
The pH-cycle method used showed a reduction in the Ca/P ratio of the control group (no TMP or F). Although this protocol was able to promote an alteration in the Ca/P ratio of control and experimental groups (Figure 3), there was no change in the basic crystalline arrangement (Figure 2). In the present study, regarding the increase in the percentage of TMP in the treatment solutions there was a trend to reduction in the P concentration for all groups when compared to that of the HA. According to Rodríguez-Lorenzo et al. [16], this reduction could be related to the occurrence of P in the form of HPO42- (866-879 cm-1) in the sample, which occupies PO43- sites. The
HPO42- band (866-879 cm-1) is related to the formation of a calcium-deficient HA
46
Jackeline Gallo do Amaral
observed in the groups with F and TMP are related to well-mineralized apatites phases [20].
According to Freund et al. [21], the absorption band at 631 cm-1 reacts to the introduction of F into the OH- chains. In particular, this band shifts markedly to higher wavenumber and decreases in intensity. In addition, new bands appear nearby. The treatment of the HA with F and TMP promoted no displacement of this absorption band in the present study. Furthermore, new bands were not observed in the spectra of the groups (Table 1) and there was no change in the basic crystalline arrangement as shown in Figure 2. It indicates that the F and TMP did not modified the structure of the HA after the pH cycle. However, it can be adsorbed on the HA as it was observed in this study (Figure 6). Thus, it would be interesting evaluate more accurately these chemical interactions in order to understand how TMP could be adsorbed. F has shown to increase the crystallinity and the Ca/P ratio, what is in line with previous data showing that HA samples treated with 1100 ppm F presented a higher crystallinity and Ca/P ratio than the HA treated with deionized water [11]. In the present study, Ca/P ratios increased according to the F concentration in the solutions, being dose-dependent. The solution containing 250 ppm F associated with TMP between 0.4 and 1% showed the highest Ca/P ratio for this F concentration which are in agreement with an in vitro study conducted by Missel et al. [22], that observed an improved reduction of bovine enamel demineralization when 250 ppm F was associated with TMP at 0.25 and 0.5% in dentifrices. Furthermore, the solution containing 500 ppm F associated with TMP between 0.6 and 2% also showed the highest Ca/P ratio for this F concentration and, mainly, promoted an increase in the crystallinity of the HA (Figure 2), what is also in line with in vitro data showing that HA treated with 500 ppm F associated to 1 and 3% TMP increased twice the alkali-soluble F content and precipitated an HA with a Ca/P ratio more similar to synthetic HA [23].
47
Jackeline Gallo do Amaral
similar to those of a standard dentifrice (containing 1100 ppm F). However, in the present study, a reduction of acid-soluble F incorporation on the HA for all F concentrations associated with TMP was observed, what is in agreement with results obtained using a similar protocol [25]. The effect of TMP and F has been related with the TMP adsorption on enamel surface that seems to involve the same binding sites as those for F and could, thus, interfere with its action depending on the TMP concentration. TMP form a “barrier” on the enamel surface that could limit acid diffusion and allow the deposition of F as CaF2, which is helpful in the
remineralization process and would be released during acid challenges [26].
HA is usually produced from wet chemical synthesis, due to its simplicity, low cost, and easy application in industrial production [27]. It is important mention that in this study an in vitro model was used to simulate dissolution and precipitation for the evaluation of the effect of TMP and/or F on HA. However, this is a chemical model and therefore it presents limitations, especially related to the inability to reproduce the complex intraoral conditions. Such as, the saliva and the acquired pellicle are extremely important in the de- and remineralization process as well for adsorption of ions and molecules to the HA structure.
2.6 Conclusion
To conclude, the combination of F and TMP promoted changes in the biochemical and physical properties of HA. An appropriate TMP: F molar ratios can precipitate a more crystalline HA and with lower amount of impurities. It was also observed that a lower TMP adsorption on the HA structure occurred in the presence of F.
Acknowledgments
48
Jackeline Gallo do Amaral
References
1. Li Y, Kong F, Weng W. Preparation and characterization of novel biphasic calcium phosphate powders (α-TCP/HA) derived from carbonated amorphous calcium phosphates. J Biomed Mater Res Part B: Appl Biomater. 2009;89B: 508-17.
2. Krajewski A, Mazzocchi M, Buldini PL, Ravaglioli A, Tinti A, Taddei P, Fagnano C. Synthesis of carbonated hydroxyapatites: efficiency of the substitution and critical evaluation of analytical methods. J Mol Struct. 2005;744-747:221-228.
3. Johansson AK, Omar R, Carlsson GE, Johansson A. Dental erosion and its growing importance in clinical practice: from past to present. Int J Dent 2012; 2012: 632907.
4. Pessan JP, Toumba KJ, Buzalaf MA. Topical use of fluorides for caries control. Monogr Oral Sci. 2011;22:115-32.
5. Manarelli MM, Vieira AEM, Matheus AA, Sassaki KT, Delbem ACB. Effect of mouth rinses with fluoride and trimetaphosphate on enamel erosion: an in vitro study. Caries Res. 2011;45:506-9.
6. Favretto CO, Danelon M, Castilho FCN, Vieira AEM, Delbem ACB. In vitro evaluation of the effect of mouth rinse with trimetaphosphate on enamel demineralization. Caries Res. 2013;47:532-8.
7. Danelon, M, Takeshita, EM, Sassaki, KT, Delbem, ACB. In situ evaluation of a low fluoride concentration gel with sodium trimetaphosphate in enamel re-mineralization. Am J Dent. 2013;26:15-20.
8. Takeshita EM, Castro LP, Sassaki KT, Delbem ACB. In vitro evaluation with low fluoride content supplemented with trimetaphosphate. Caries Res. 2009;43:50-6.
9. Moretto MJ, Magalhães AC, Sassaki KT, Delbem ACB, Martinhon CCR. Effect of different fluoride concentrations of experimental dentifrices on enamel erosion and abrasion. Caries Res. 2010;44:135-40.
49
Jackeline Gallo do Amaral
11. Delbem ACB, Alves KMRP, Sassaki KT, Moraes JCS. Effect of Iron II on Hydroxyapatite Dissolution and Precipitation in vitro. Caries Res. 2012;46:481–7.
12. Qu H, Wei M. Synthesis and characterization of fluorine-containing hydroxyapatite by a pH-cycling method. J Mater Sci Mater Med. 2005;16:129-33.
13. Vogel GL, Chow LC, Brown WE: A microanalytical procedure for the determination of calcium, phosphate and fluoride in enamel biopsy samples. Caries Res. 1983;17:23-31.
14. Fiske CH, Subarrow Y: The colorimetric determination of phosphorus. J Biol Chem. 1925;66:375-400.
15. Caslavska V, Moreno EC, Brudevold F. Determination of the calcium fluoride formed from in vitro exposure of human enamel to fluoride solutions. Arch Oral Biol. 1975;20:333-9.
16. Rodríguez-Lorenzo LM, Hart JN, Gross KA. Influence of fluorine in the synthesis of apatites: synthesis of solid solutions of hydroxyl-fluorapatite. Biomaterials. 2003;24:3777-85.
17. Wilson RM, Eliott JC, Dowker SEP. Formate incorporation in the structure of Ca-deficient apatite: Rietveld structure refinement. J Solid State Chem. 2003;174: 132-40.
18. Wilson RM, Eliott JC, Dowker SEP, Rodríguez-Lorenzo LM: Rietveld refinements and spectroscopic studies of the structure of Ca-deficient apatite. Biomaterials. 2005;26:1317-27.
19. Eliott JC. Hydroxyapatite and nonstoichiometric apatites. In Elliott JC, editor. Structure and chemistry of the apatites and other calcium ortophosphates. Amsterdam: Elsevier 1994. pp 111-86.
20. Antonakosa A, Liarokapisa E, Leventouri T. Micro-Raman and FTIR studies of synthetic and natural apatites. Biomaterials. 2007;28:3043-54.
21. Freund F and Knobel RM. Distribution of fluorine in hydroxyapatite studied by infrared spectroscopy. J Chem Soc Dalton Trans. 1977.1136-1140.
50
Jackeline Gallo do Amaral
trimetafosfato de sódio na desmineralização do esmalte. Braz Oral Res. 2010;24:247-83.
23. Souza JAS, Takeshita EM, Zaze ACSF, Sassaki KT, Moraes JCS, Delbem ACB. Effect of trimetaphosphate and fluoride association on hydroxyapatite dissolution and precipitation in vitro. Braz Oral Res. 2011;29:90.
24. Takeshita EM, Exterkate RAM, Delbem ACB, ten Cate JM. Evaluation of different fluoride concentrations supplemented with trimetaphosphate on enamel de- and remineralization in vitro. Caries Res. 2011;45:494-7.
25. Souza JAS, Amaral JG, Moraes JCS, Sassaki KT, Delbem ACB. Effect of Sodium Trimetaphosphate on Hydroxyapatite Solubility: An In Vitro Study. Braz Dent J. 2013;24:235-40.
26. Manarelli MM, Delbem AC, Lima TM, Castilho FC, Pessan JP. In vitro Remineralizing Effect of Fluoride Varnishes Containing Sodium Trimetaphosphate. Caries Res 2014; 48: 299-305.
51
Jackeline Gallo do Amaral
Figure 1. a: XRD patterns of the synthetic HA and CRYSTMET database. b: HA spectra obtained for synthetic
52
Jackeline Gallo do Amaral
Figure 2. XRD patterns of HA according to the groups evaluated associated with TMP. 0 ppm F (a); 100 ppm
53
Jackeline Gallo do Amaral
Figure 3. Mean (± se) of values of Ca (a), P (b) and Ca/P ratio (c) on hydroxyapatite synthetized and after pH cycle
according to the F and TMP concentration. Correlation: concentration of calcium and phosphorus on hydroxyapatite (d). Distinct letters show significant differences between the % TMP for each fluoride concentration
(Student-Newman-Keuls, p <0.05). (*) 0 ppm F = 100 ppm F = 250 ppm F; (&) 0 ppm F = 100 ppm F; ()) 0 ppm F = 250 ppm
F; (#) 100 ppm F = 250 ppm F; (O) 0 ppm F = 500 ppm F; (:) 100 ppm F = 500 ppm F; (\) 250 ppm F = 500 ppm F;
54
Jackeline Gallo do Amaral
0.0 0.1 0.2 17 18 19 20 21 22 23
100 ppm F
250 ppm F 500 ppm F
0.4 0.6 0.8 1.0 2 4 6 8 10
0 ppm F HA sint TMP concentration C a a to mic %
0.0 0.1 0.2 10 11 12 13 14 15
100 ppm F
250 ppm F 500 ppm F
0.4 0.6 0.8 1.0 2 4 6 8 10
0 ppm F HA sint TMP concentration P a to m ic %
0.0 0.1 0.2 0.0 0.5 1.0 1.5 2.0 2.5
100 ppm F
250 ppm F 500 ppm F
0.4 0.6 0.8 1.0 2 4 6 8 10
0 ppm F HA sint TMP concentration F at om ic %
0.0 0.1 0.2 64
66 68 70 72
100 ppm F
250 ppm F 500 ppm F
0.4 0.6 0.8 1.0 2 4 6 8 10
0 ppm F HA sint TMP concentration O a to m ic % a b c d
55
Jackeline Gallo do Amaral
Figure 5. Mean (± se) of alkali-soluble F on HA after treatment (a) and after pH cycle (b); acid-soluble F on HA
after treatment (c) and after pH cycle (d). Distinct letters show significant differences between the % TMP for each
fluoride concentration (Student-Newman-Keuls, p <0.05). (#) 100 ppm F = 250 ppm F; (\) 250 ppm F = 500 ppm
F; (O) 0 ppm F = 500 ppm F; ()) 100 ppm F = 250 ppm F = 500 ppm F; (:) 100 ppm F = 500 ppm F.
56
Jackeline Gallo do Amaral
Figure 6. Mean (± se) of F and TMP adsorbed to hydroxyapatite (a) adsorption of TMP (expressed through the
amount of phosphorus), (b) adsorption of fluoride. Distinct letters show significant differences between the %TMP for each fluoride concentration (Student-Newman-Keuls, p <0.05). (*) All comparisons show similarity; (&) 100
ppm F = 250 ppm F = 500 ppm F; (O) 250 ppm F = 500 ppm F; ()) no difference among the %TMP in 0 ppm F
57
Jackeline Gallo do Amaral
Table 1. Absorption coefficient obtained in the FTIR analysis according to the groups evaluated regarding the F
and TMP concentration after pH cycle
Groups Wavenumber (cm-1)
ppm F TMP% 565 603 634 874 964 1,039 1,094 1,418 1,451
Synthetic HÁ 4.879 3.740 1.650 0.151 0.695 17.459 8.920 0.590 0.457
0
0 4.132 3.056 1.253 0.220 1.175 13.264 7.366 0.427 0.351
0.4 4.100 3.180 1.300 0.100 0.881 13.230 7.312 0.302 0.205
1 3.488 2.800 1.272 0.120 0.828 10.939 6.283 0.263 0.218
6 3.812 2.936 1.248 0.102 0.815 12.179 6.827 0.280 0.243
10 3.997 3.183 1.529 0.197 0.887 12.165 6.966 0.234 0.196
100
0 4.911 4.159 1.614 0.152 0.965 16.464 9.426 0.541 0.473
0.4 4.389 3.440 1.210 0.121 0.945 14.459 7.967 0.368 0.349
1 3.682 3.166 1.234 0.103 0.758 11.922 6.624 0.289 0.243
6 3.951 3.393 1.318 0.064 0.767 12.730 7.054 0.301 0.262
10 4.259 3.445 1.405 0.089 0.732 13.350 7.227 0.319 0.261
250
0 4.732 3.972 1.637 0.191 0.929 14.803 7.871 0.433 0.365
0.4 3.810 3.177 1.454 0.078 0.671 11.610 6.422 0.405 0.370
1 4.412 3.647 1.604 0.143 0.742 13.302 7.223 0.384 0.318
6 3.353 2.725 1.250 0.058 0.586 9.861 5.735 0.261 0.261
10 3.860 3.201 1.540 0.084 0.638 10.595 6.297 0.327 0.327
500
0 3.185 2.712 1.193 0.058 0.522 9.260 5.412 0.305 0.286
0.4 3.804 3.093 1.312 0.103 0.717 12.131 6.525 0.378 0.339
1 3.379 2.746 1.173 0.056 0.561 10.459 5.889 0.351 0.302
6 3.559 2.803 1.314 0.103 0.619 11.128 5.379 0.316 0.248
10 3.742 3.144 1.515 0.066 0.519 11.016 6.266 0.349 0.299
* 565, 603, 964, 1039 and 1094 cm –1 correspond to phosphate bands; 874 cm-1 correspond to monohydrogen
phosphate (HPO42-); the carbonate vibrational mode is located at regions of 1418 and 1451 cm –1 and the OH
58
Jackeline Gallo do Amaral
59
Jackeline Gallo do Amaral
Biochemical and structural analysis of hydroxyapatite solubility treated with
fluoride and sodium trimetaphosphate
3.1 Abstract
This study aimed to evaluate the effect of sodium trimetaphosphate (TMP) associated with fluoride (F) on structure and dissolution of hydroxyapatite (HA). Synthetic HA powder (1.0 g) was suspended (n=6) in solutions containing TMP varying at 0-10% associated with 0, 1100, 4500 and 9000 ppm F. The precipitates were filtered, dried (24 h at 37°C), ground and submitted to a pH cycle. Samples were analyzed by Fourier transformed infrared spectroscopy (FTIR), X-ray diffraction (XRD) and energy-dispersive X-ray spectroscopy (EDX). The concentration of F, Ca and P were determined in HA, and P and F in the supernatants. Data were submitted to ANOVA, followed by Student-Newman-Keuls’ test (α=0.05). Higher Ca/P ratios were observed with TMP at 2- 4% for the 1100 ppm F solution, and at 4-8% for the 4500 and 9000 ppm F solutions (p<0.05). The overall trend was that alkali-soluble F deposition was directly related to TMP concentrations in the treatment solutions, while acid-soluble incorporation was inversely related to TMP concentrations (p<0.05). The increase of TMP provided a greater P adsorption in the HA structure for the 0 and 1100 ppm F solutions (p<0.05). XRD data indicated that HA powder crystallinity is altered according to the addition of F:TMP and all diffractograms and FTIR spectra obtained showed a similar pattern that for pure HA. In conclusion, when TMP and F are co-administered, TMP interferes with F deposition on HA and an ideal TMP:F ratio can provide an enhancement of the fluoride products and precipitate a HA with low solubility.
Keywords: hydroxyapatite, polyphosphates, fluoride, dissolution.
60
Jackeline Gallo do Amaral
3.2 Introduction
Tooth enamel is predominantly composed by hydroxyapatite (HA), which is a calcium phosphate and can be susceptible to basically two types of demineralization, either caused by dental biofilm acids (dental caries) and arising from acids from food, medicines, environment or gastric acids (known as dental erosion) [1,2]. There is no question that fluoride (F) has been the cornerstone in strategies to prevent dental caries [2]. Moreover, recent reports have shown that F has been studied on the prevention and treatment of dental erosion [3].
Nonetheless, considering modern habits of the population and the increasing of risk factors for the development of these oral diseases, current research is focused on the development of strategies to improve the efficacy of topically applied fluoridated products [4], at the same time as reducing F exposure, as this ion has been related to an increasing of dental fluorosis in young children [5]. A large number of new or improved F products have been released at marketplace, which include toothpastes, fluoride varnishes, gels, restoratives materials and mouthrinses.
Among the promising products that have been studied, several formulations containing F and sodium trimetaphosphate (TMP) are described in the literature. In
vitro [6-13], in situ [14,15] and clinical studies [16] demonstrated that TMP-containing
fluoridated dentifrices, gels, mouthrinses and varnishes have a higher protective effect for both dental caries and erosion when compared with products without TMP. However, the protocols used in the above-mentioned studies do not provide detailed information regarding the interaction between the F:TMP with the tooth structure. Given that the mechanisms of action of F and TMP in association has not yet been completely elucidated, it would be interesting to evaluate the direct interaction of these compounds with HA, which is the main mineral component of enamel. Biochemical and structural analysis in HA powder would be one way to provide new insights into the mechanisms of action of F and TMP when associated in formulations for topical use.
61
Jackeline Gallo do Amaral
F. Combined to this, knowing the ideal F:TMP ratio can be helpful in developing new products for oral hygiene.
3.3 Materials and Methods
Synthesis of HA
HA powders were synthesized according to the protocol by Qu and Wei’s [17]. Initially, 1 mol L-1 (300 mL) calcium nitrate solution (Ca(NO3)2·H2O, Sigma-Aldrich
Corp. St. Louis, MO, USA) and 0.3 mol L-1 (600 mL) diammonium phosphate solution ((NH4)2HPO4, Sigma-Aldrich Corp. St. Louis, MO, USA) were prepared and the pH of
each solution was raised to 10–12 by adding NH4OH (29.5%). Diammonium
phosphate solution was added slowly to the calcium nitrate solution (2–5 mL/min), under constant agitation at 37 °C, in order to precipitate the fully-crystallized HA. The precipitates were aged for 7 days at 37 °C while the pH was checked every day and maintained at around 10 for the growth and formation of a single crystalline phase. During synthesis, the system remained open in order to precipitate a carbonated HA similar to that found in dental tissue. The precipitate was collected by filtration using a Buchner funnel attached to a vacuum system (–600 mmHg), washed repeatedly with deionized water (250 ml/0.5 g HA) and anhydrous ethanol in order to remove the contaminated ions (NH4+ and N03-) [18], and subsequently dried for 24 h at 70 °C.
The precipitate was then ground into a fine powder, all samples had the particle size reduced to less than 53 µm using a ball mill (Pulverisette 7, Fritsch, Germany). Six samples of approximately 0.5 g were separated for biochemical and structural analysis (Anexo B).
Treatment and pH Cycle
Solutions (100 mL, n=6) of TMP (Na3P3O9, Sigma-Aldrich Co., USA) were
prepared at 0, 0.1, 0.2, 0.4, 0.6, 0.8, 1.0, 2.0, 4.0, 6.0, 8.0, and 10%, associated with 0, 1100, 4500 and 9000 ppm F (NaF, Merck, Darmstadt, Germany), totaling 48 combinations. Following, synthetic HA powder were submitted to the treatment and subsequently to one pH cycle.
Treatment. The synthetic HA powder (1.0 g) was suspended under agitation in
62
Jackeline Gallo do Amaral
mmHg), washed repeatedly with deionized water (250 ml/0.5 g HA) and dried for 24 h at 37°C. The precipitate was then ground again into a fine powder with the aid of a ball mill (Pulverisette 7, Fritsch, Germany). An aliquot of supernatant was collected to evaluated the F and P concentration in order to calculate the P and F adsorption in the HA.
pH Cycle. After the treatment with the solutions, HA powder of each group was
suspended in deionized water and the pH of the suspensions was slowly reduced to 4.0 using 1 mol L-1 nitric acid (HNO3, Merck, Darmstadt, Germany) under agitation.
After 30 min of equilibration, the pH of each solution was raised to 7.0 by the addition of 1 mol L-1 sodium hydroxide (NaOH, Merck, Darmstadt, Germany). Samples of synthetic HA powder (n= 6) were suspended in deionized water and used as negative control. After completion of this process, the precipitates were immediately separated by filtration, washed with deionized water, dried for 24 h at 37 °C and ground into a fine powder as described above (Anexo C).
HA powder was analyzed in duplicate for F, calcium (Ca) and phosphorus (P) concentrations; for energy-dispersive X-ray spectroscopy (EDX), X-ray diffraction (XRD) and Fourier transform infrared spectroscopy (FTIR).
Calcium and phosphorus analysis in hydroxyapatite
63
Jackeline Gallo do Amaral
Fluoride analysis (alkali- and acid-soluble)
For fluoride analysis, 5 mg of the treated and cycled HA powder was weighed into pre-weighed micro-centrifuge tubes, and 2.0 mL of 1 mol L-1 KOH was added for alkali-soluble extraction, according to the protocol described by Caslavska et al. [21], with some modifications. After 24 h of continuous agitation (Shaker, SK-300, Lab. Companion, Kimpo City, Korea), the samples were centrifuged for 20 min at 2900 × g. A 0.5 mL aliquot of the supernatant was neutralized with 0.5 mL of TISAB II (total ionic strength adjustment buffer) modified with 1 mol L-1 HCl (0.82 mL HCl/L). Alkali-soluble F concentration was determined by using a specific electrode (Orion 9409BN, Thermo Scientific, Beverly, MA, USA) and reference electrode (Orion 900100) connected to an ion analyzer (Orion 720+, Thermo Scientific, Beverly, MA, USA).
For determination of acid-soluble F [22], the precipitate was washed three times with deionized water and once with methanol. After methanol evaporation (overnight at 60 °C), 1 mL of 1 mol L-1 HCl was added, and the samples were homogenized for 30 s by vortexing, and subsequently agitated for 1 h at room temperature. 0.5 mL aliquot of these samples was then added to 0.5 mL of TISAB II modified with 20 g NaOH/L. Samples were analyzed for acid-soluble F as described for alkali-soluble F (Anexo E)
Phosphorous and fluoride analysis in suspension during HA treatment
64
Jackeline Gallo do Amaral
was calculed from the initial concentrations of these compounds in the solutions and the concentration after pH-cycle.
Structural analyses (FTIR and XRD)
HA samples (n=1) of all F concentrations tested associated with TMP at 0, 1, 4 and 10% were submitted to the FTIR and XRD analysis. These concentrations were selected based on the results obtained in the biochemical analysis of HA. For FTIR analysis, all samples had the particle size reduced to less than 53 µm using a ball mill (Pulverisette 7, Fritsch, Germany) in order to allow lower IR irradiation scattering, especially at high wavenumber. Samples (1 mg) were mixed to 600 mg of a dry potassium bromide (KBr) and a pellet was prepared. The infrared absorbance spectra were recorded by a transmitted radiation method through a FTIR spectrophotometer (Nexus 670, Nicolet Instrument Corporation, Madison, USA) using 128 scans at 4 cm-1 resolution in the spectral range between 400 and 4000 cm-1. The intensity of the absorption band was divided by the pellet thickness, and the coefficient of absorption (α) was measured regarding the baseline joining the points of lowest absorbance on the peak using the subtraction of a straight line. Thus, α value obtained was compared among the groups evaluated. The error of α measurement was of the 0.005 order.
XRD analysis was performed at room temperature using a CuKα radiation (Ultimate IV X-ray diffractometer, Rigaku Corp., Osaka, Japan) generated at a voltage of 40 kV and a current of 20 mA. The scanning range (2θ) was from 10 to 60º with a step size of 0.02°. The CRYSTMET database (Toth Information Systems Inc., Ottawa, Canada) was used for phase identification. The crystallite sizes were estimated using the Scherrer equation (d= K λ/ β cos θB), where d is the diameter
dimension of the crystalline particle, K (0.9) is the slope factor, λ is the wavelength of the incident X-ray (1.542 Å), β is the line broadening at half the maximum intensity (FWHM), θB is the Bragg angle obtained from the XRD pattern.
Energy-dispersive X-ray spectroscopy (EDX)
65
Jackeline Gallo do Amaral
by structural as well as biochemical analysis. HA powders were dropped onto a specific holder and the characterization was carried out using a scanning electron microscope (Carl Zeiss, model EVO LS-15, NTS, LTD, Germany) at a voltage of 20kV (× 500-1000 magnification) associated with energy-dispersive X-ray spectrophotometer (Oxford Instrument, Inca X-act) with 133eV resolution.
Data analysis
For statistical analysis, SigmaPlot 12.0 was used, and the significance limit was set at 5%. Ca, P, Ca/P ratio, alkali- and acid-soluble F of HA, and F and P data in the suspensions showed normal (Shapiro Wilk test) and homogeneous (Cochran’s test) distributions and were subjected to two-way ANOVA followed by Student-Newman-Keuls’ test. Correlation between Ca and P in HA (Pearson's test) was calculated to quantify the relationships between these ions under all conditions studied. FTIR and XDR were described according to the presence of specific bands obtained from different treatment submitted to the pH cycle. FTIR data were analyzed as absorption coefficient and data obtained from XRD were used to evaluated from the diameter values of crystallite sizes. EDX data were described as atomic percentage of the elements.
3.4 Results
The diffractograms obtained for the HA synthetic were compared with the HA XRD pattern in the CRYSTMET data base, confirming that the powder synthetized by the method used in the present study consists of HA (Figure 1a). The synthetic HA powder spectra (Figure 1b) show typical peaks of a carbonated HA in the regions of 565 (ѵ4), 603 (ѵ4), 874 (ѵ2), 964 (ѵ1), 1039 (ѵ3c) and 1094 (ѵ3a) cm –1, which
correspond to phosphate bands; the carbonate vibrational mode is located at regions of 1418 and 1451 cm –1 (ѵ3) and the OH band was observed at 634 cm –1 (ѵ4). The
FTIR data are presented in the Table 1.