IRACENIR ANDRADE DOS SANTOS
LAND USE SYSTEMS IN THE AMAZON: IMPACTS ON ANT BIODIVERSITY
IRACENIR ANDRADE DOS SANTOS
LAND USE SYSTEMS IN THE AMAZON: IMPACTS ON ANT BIODIVERSITY
Tese apresentada à Universidade Federal de Viçosa, como parte das exigências do Programa de Pós-Graduação em Entomologia, para obtenção do título de Doctor Scientiae.
Approved: September 9, 2010.
______________________________ ______________________________ Dra. Ivette Perfecto Dr. Ronaldo Reis Junior
(Co-Orientadora)
______________________________ ______________________________ Dr. José Cola Zanuncio Dra. Madelaine Venzon
______________________________ Dr. Evaldo Ferreira Vilela
DEDICATORIA
À minha querida mãe Reinalda que sempre foi minha grande
inspiracao para vencer todos os obstáculos e ver que o que
realmente importa é sermos felizes.
Ao Senhor Yhan que é minha fonte de felicidade. Por ser o menino
mais importante da minha vida. Pelos seus sorrisos, felicidade
contagiante e por ser o meu melhor amigo e parceiro ao longo de
ACKNOWLEDGMENTS
I am grateful for Conselho Nacional de Desenvolvimento Científico e Tecnológico-CNPq
for the Scholarship in Brazil and also SWE at the University of Michigan (UM), Federal
University of Viçosa, Graduate Program of Entomology.
I am grateful to my great family that always has shown how to be close no matter the
distance. They always supported me emotional, and philologically each moment, and made
me strong and happy every day since I left.
To my Advisor Dr. Evaldo F. Vilela, for his competence and ability to do so much more
than asked ... thanks for being my advisor and for your friendship.
I thank Dra. Ivette Perfecto (UM) for being a brilliant co-advisor and an excellent example
of professionalism, also for her friendship throughout my sandwich program at the
University of Michigan, SNRE, in Ann Arbor.
Thanks to Dr. John Vandermeer (UM) for his valuable comments on this research, for his
friendship and making me so happy during my Sandwich program at the University of
Michigan, EEB, Ann Arbor, MI, USA.
Thank so much to Paula and Miriam (Entomology secretaries) for their help throughout
graduate school (Master and PhD course).
I am grateful to my long-time friends: Patricia (Paty), Negrão, Maurício, Marcelo Grot
(Primão forever), Marcia Gisele, Walter Silveira.
Thanks to my great friends Farah de Castro and Ana Vitta for their encouragement every
moment, their advice and for sharing coffee breaks, travel and friendship.
Also to my Brazilian Lab’s mate Wendel, Silvana (Silvaninha Evolução em tempo real),
Hernane, Andreza Fantine, (pelos momentos de muitas bobeiras que me fizeram
Thanks to Dr. Eraldo Lima for his support when I was at the Insect Behavior and
Pheromone laboratory.
Thanks to Dr. José Lino-Neto for his support, friendship throughout my stay in Viçosa city.
I am also grateful for Perfecto’ and Vardermeer’s Lab mates who were always very
friendly, lovely, and always improved my research with their comments: Kate Enies, Jane
Remfert, Senay, Andy Macdonald, Stacy Mates, Linda Marins, Stacy Philpport, Doung
Jackson, Leslie, Colin, Jess, Bob and Kim.
To David Allen for your friendship, professionalism and making me so happy during the
whole summer (2010), while we worked together.
I would like to say thanks very much for Hsun-Yi Hsieh for her help, lovely friendship that
was so great every day in Ann Arbor -- for being my “second best friend,” as she said. (I
am just wondering who is the first one?)
Thanks to my great friend in the USA Dr. Eduardo Bresciani, for all the fun and happy
moments, and his help. We (Yhan and I) are so glad to have met you.
Thanks to Osvaldo Kato, the friend who was responsible for all the field works support and
also for helping me each moment -- before, during and after my field work in the Amazon
region, and for your friendship too.
I thank to Silvio Brienza Junior and Walkymário Lemos for their support during my field
work in EMBRAPA/CPATU, Belem, PA, Brazil.
Thank also to Henrique, Joseane, Dr. Olinto, Claudia, Ronaldo, Tia Dora and Davi for
provided logistic support in Belém, Igarapé-Açú, Capitão Poço and Garrafão do Norte, and
Paragominas in Pará State, Brazil.
Thanks to Fernando Fernandez and C. Ortiz (Universidade Nacional de Colombia), Rogerio
Rosa Silva (Museu de Zoologia de Sao Paulo), Phil Ward (University of California at
Davis, U.S.A.), Christian Rabeling (Attini tribe) with ant species identifications.
I would like to say thanks to the plantations owners for letting me conduct this research on
their land.
Finally, thanks to my conversation partner Hilary Levison, Harry Sheehan, Patrick and
Abgail. It was great to meet all of you! Also to someone else that had any contribution to
make this study possible.
This research was funded by a CNPq- Conselho Nacional de Desenvolvimento Científico -
grant (I. A. Dos Santos and E. F. Vilela) and supported for Pro-Ambiente-Pará, Embrapa
Important Notes
This thesis is comprised of four chapters, each representing papers submitted or soon to be
submitted to different journals. Individual chapters are composed in accordance with the
structure and reference rules requested by the specific journal. They are as follows:
General Introduction: accord of Conservation Biology journal rules.
Chapter I: “Biodiversity declines following the expansion of soybean and cattle ranching in the Amazon” accord of Nature journal rules.
Chapter II: “Soybean Expansion and the Loss of Biodiversity in the Amazon”, accord of the Proceedings of the National Academy of Sciences (PNAS) journal rules.
Chapter III: “The Impact of Forest Plantations of Native and Exotic Species on Ant Biodiversity in the Amazon Region”, accord of Conservation Biology journal rules.
Index
of
Contents
Resumo ... x
Abstract... xiii
GENERAL INTRODUCTION... 1
REFERENCE BIBLIOGRAPHY... 7
CHAPTER I ... 13
BIODIVERSITY DECLINES FOLLOWING THE EXPANSION OF SOYBEAN AND CATTLE RANCHING IN THE AMAZON ... 13
Abstract... 14
Acknowledgements ... REFERENCE ... 24
SUPPLEMENTARY INFORMATION ... 26
Methods... Study Site ...26
Ant Sampling...26
Measuring distance from the nearest forest fragment...27
Ants as an Indicator Group...27
Prediction Models ... Conversion System Rate Model (CSRM)...27
Environmental Variables Prediction Model (EVPM)Distance from the Forest ...28
Likelihood ...28
Restricted Environmental Variables Model ...30
RESULTS ... 31
Species Accumulation Curves... Conversion System Rate Model – Conversion of Forest to Agriculture Using Genus as the Taxonomic Unit of Analysis... REFERENCES OF SUPPLEMENTARY INFORMATION ... 35
Supplementary Table S – EVPM Results ... Supplementary Table S – List of Ant Species... CHAPTER II ... 43
SOYBEAN EXPANSION AND THE LOSS OF BIODIVERSITY IN THE AMAZON ... 43
ABSTRACT... 44
INTRODUCTION ... 45
Predictive Bayesian Model: Environmental Variables...
DISCUSSION... 49
Acknowledgments... REFERENCE ... 54
CHAPTER III ... 58
THE IMPACT OF FOREST PLANTATIONS OF NATIVE AND EXOTIC SPECIES ON ANT BIODIVERSITY IN THE AMAZON REGION ... 58
ABSTRACT... 59
INTRODUCTION ... 60
METHODS... 62
Ant Sampling ... Environmental Variables... Statistical Analyses ... Biodiversity of Ants...64
The effects of environmental variables on ant biodiversity ...65
RESULTS ... 66
DISCUSSION... 73
Acknowledgments... LITERATURE CITED ... 78
CHAPTER IV ... 86
EFFECTS OF ORGANIC AND CONVENTIONAL ORANGE ORCHARD MANAGEMENT ON ANT DIVERSITY IN THE AMAZON ... 86
ABSTRACT... 87
INTRODUCTION ... 88
MATERIALS AND METHODS ... 91
CONCLUSIONS ... 114
Acknowledgments...
REFERENCES ... 116 GENERAL CONCLUSION ... 128
Paper : Biodiversity declines following the expansion of soybean and cattle ranching in the Amazon...
Paper : Soybean expansion and the loss of biodiversity in the Amazon...
Paper : The impact of forest plantations of native and exotic species on ant biodiversity in the Amazon region...
Paper : Effect of Organic and Conventional Orange Orchard Management on Ant Diversity in the Amazon. ...
Final Thought...
Resumo
DOS SANTOS, Iracenir Andrade, D. Sc., Universidade Federal de Viçosa, setembro de 2010. Sistemas de uso da terra na Amazônia: Impactos sobre a biodiversidade de
formigas. Orientador: Evaldo Ferreira Vilela. Co-Orientadores: Ivette Perfecto, Flávia
Maria da Silva Carmo e Simon Loke Elliot.
As florestas tropicais cobrem menos de dois por cento da superfície da terra, mas
abrigam cerca de 50% das espécies terrestres do planeta. A região Amazônica é o maior
reservatório de biodiversidade no mundo com mais de 40.000 espécies de plantas
vasculares descritas, mais da metade das espécies animais descritas no mundo, e a maior
bacia hidrográfica com uma extraordinária alta diversidade de organismos de água doce.
Porém, essa grande diversidade está altamente ameaçada pelos desmatamentos. A
agricultura e a pecuária são as causas primárias do desmatamento nessa região, com a
pecuária contando com 65 a 70%, a agricultura em pequena escala responsável por 20-25%
e a agricultura em larga escala com outros 5-10%. Nessa região existem muitos tipos de
sistemas de uso da terra e a maioria não tem nenhum plano de manejo sustentável. Como
esses diferentes sistemas (agricultura, silvicultura e pecuária) são estabelecidos em areas
fragmentadas ou mesmo em sistemas naturais como o Cerrado, é importante entender a
indicadores de biodiversidade e impactos ambientais, em ecossistemas tropicais porque são
sensíveis a distúrbios de habitats, tem complexas interações ecológicas com muitos
organismos bióticos em ecossistemas terrestres e serem, relativamente, de fácil amostragem
e identificação. Nesse estudo foi comparado a diversidade de formigas em uma variedade
de agroecossistemas, na região Amazônica brasileira com o objetivo de identificar sistemas
que pode ser estimulados e sistemas que devem ser evitados devido aos impactos causados
sobre a biodiversidade. Esse trabalho também teve como objetivo entender quais são as
variáveis ambientais que podem manter alta biodiversidade entre e dentro de cada tipo de
agroecossistema. Para direcionar essas questões foram usados sete agroecossistemas no
Estado do Pará, Amazônia Brasileira. Além dos sistemas de uso da terra, foram coletadas
um conjunto de variáveis ambientais dentro de cada agroecossistema. No geral, esse estudo
mostrou que a serapilheira e a diversidade florística foram diferentes entre todos os
agroecossistemas e foram altamente correlacionados com a riqueza de espécies de
formigas, sugerindo que essas variáveis desempenham importante papel para a conservação
da bioiversidae de formigas dentro das matrizes agrícolas e de pecuária encontradas na
região Amazônica. Esse estudo também mostrou que sistemas agroflorestais, plantações de
laranjas sob manejo organico e tradicional e florestas plantadas com espécies nativas
(Paricá) foram os melhores sistemas de uso para conservação da biodiversidade de
formigas. Enquanto, plantações de soja, sistemas de pastagens para pecuária e florestas
plantadas com espécie exótica (teca) foram os sistemas de uso da terra mais hostís a
biodiversdidade de formigas. Também foi evidente que os sistemas que sustentam elevados
níveis de biodiversidade são aqueles que tem components arbóreos (sistemas agroflorestais,
sistemas baseados em árvores foram benéficos para a biodiversidade de formigas, como
demonstrado pela baixa diversidade de formigas encontrada em plantações de teca. No
entanto, a presença de árvores parece contribuir para a biodiversidade. Portanto, nos
processos de tomada de decisão sobre implantação de novos sistemas de uso da terra na
Amazônia, é importante considerar sistemas que incorporem árvores, tais como sistemas
agroflorestais. Além disso, mais pesquisas devem conduzidas para aumentar e diversificar
os agroecossistemas que podem prover hábitas à diferentes espécies e aumentar a
biodiversidade, que também possam favorecer processos migratórios entre fragmentos
florestais, e assegurar outros serviços ambientais, tais como sequestro de carbono, serviços
de polinização, e ao mesmo tempo melhorar a qualidade de vida das populaçõoes locais e
Abstract
DOS SANTOS, Iracenir Andrade, D. Sc., Universidade Federal de Viçosa, September, 2010. Land use systems in the Amazon: Impacts on ant biodiversity. Advisor: Evaldo Ferreira Vilela. Co-Advisors: Ivette Perfecto, Flávia Maria da Silva Carmo and Simon Loke Elliot.
Tropical forests cover less than two percent of the surface of the Earth but they
host an estimated 50 percent of terrestrial species on the planet. The Amazon region, in
particular, is the largest reservoir of biodiversity in the world, home to more than 40,000
described vascular plant species, more than half of the described animal species in the
world and major river basins that contain an extraordinarily high diversity of fresh water
organisms. The great diversity of the Amazon is highly threatened by deforestation.
Agriculture and cattle ranching are the primary causes of deforestation in the region, with
cattle ranching accounting for 65 to 70% of forest clearings, small-scale agriculture for
20-25% and large-scale agriculture for another 5-10%. There are many different land use
systems in the Amazon region and most of them do not have any sustainable management
planning. As these different systems -- agriculture, forestry and livestock -- get establish
and fragment the forest and other natural ecosystems like the cerrado, it is important to
understand the structure and dynamics of the biodiversity that colonize these land-use
systems. That knowledge will allow us to measure the impacts on biodiversity of the
various production systems as well as the tradeoffs and potential synergies regarding
production and conservation objectives. Studies of biodiversity have often used a variety of
disturbances, they have complex ecological interactions with many other biotic organisms
in terrestrial ecosystems and they are relatively easy to sample and identify. In this study
we compare ant diversity in a variety of land use systems in the Amazon region of Brazil
with the aim at identifying systems that should be promoted and those that should be
avoided based on their impact on ant biodiversity. We also want to understand what are the
environmental variables that support high ant biodiversity among and within each land use
system. To address these questions we used seven land use systems that are found in the
State of Pará in the Brazilian Amazon and that have not received much attention from the
scientific community, and we sample a set of environmental variables within each system.
Overall this study found that leaf litter biomass and floristic diversity of the herbaceous
layer were different among all land use systems and were highly correlated with ant species
richness, suggesting that they play an important role for the conservation of biodiversity of
ants within the agricultural matrices found in the Amazon region. This study also found that
agroforestry systems, orange orchard under organic and conventional management and
native forest tree plantations (paricá) were the best land use systems (of those examined)
for the conservation of ant biodiversity in region. While soybean plantations, cattle
pastures, and exotic forest tree plantations (teak), were found to be the worst for ant
incorporate trees, such as diverse agroforestry systems. Furthermore, more research should
be conducted on diversifying these systems to provide habitat for biodiversity, promote
migration between forest fragments, ensure other ecosystem services, such as carbon
sequestration and pollination services, and at the same time contribute to improve the
GENERAL INTRODUCTION
Tropical forests cover less than two percent of the surface of the Earth but they
host an estimated 50 percent of terrestrial species on the planet (Feeley & Silman 2009).
The Amazon region, in particular, is the largest reservoir of biodiversity in the world, home
to more than 40,000 described vascular plant species (Feeley & Silman 2009), more than
half of the described animal species in the world (Capobianco et al. 2001; Dirzo & Raven
2003), and major river basins that contain an extraordinarily high diversity of fresh water
organisms.
The great diversity of the Amazon is highly threatened by deforestation. Although
the rate of deforestation in the Amazon region has been declining since 2004, in 2009 it
was reported that more than 7,008 square kilometers were deforested, and between 2000
and 2008 more than 250,000 square kilometers of rainforest were cleared in the Brazilian
Amazon (INPE 2010). Agriculture and cattle ranching are the primary causes of
deforestation in the region, with cattle ranching accounting for 65 to 70% of forest
clearings, small-scale agriculture for 20-25% and large-scale agriculture for another 5-10%
(Foley et al. 2007; Gibbs et al. 2008; PRODES/INPA 2010).
With the increase in soybean price in the international market and the introduction
In addition to the dynamic changes that are leading to the expansion of the
agricultural frontier in the Amazon, another threat to biodiversity in the region is the
unsustainable management of agricultural and forestry systems within the areas that have
been cleared for decades. There are many different land use systems in the Amazon region
and most of them do not have any sustainable management planning. Over the last decade,
the critical role of the agricultural matrix in conserving biodiversity has been recognized by
the scientific community (Donald & Evans 2006; Harvey et al. 2008; Hughes et al. 2000;
Kumawat et al. 2010; Moorhead et al. 2010; Perfecto & Vandermeer 2002, 2008; Perfecto
et al. 2009; Ricketts 2004; Scherr & McNeely 2008; Vandermeer & Perfecto 2007a). In
particular, it has been demonstrated that in fragmented landscapes, the agricultural matrix
plays a critical role in the conservation of biodiversity by facilitating or hindering migration
of organisms to forest fragment (Perfecto & Vandermeer 2008, 2010). Diverse agroforestry
systems that do not use toxic chemicals and resemble forests allow organisms to move
through the agricultural matrix and migrate to forest fragments, while intensive annual
monocultures that use toxic chemicals, eliminate ground cover and extend over very large
areas, prevent forest organisms from migrating from one forest fragment to another.
Without the necessary gene flow and immigration, forest organisms are bound to local
extinctions and with the recolonization potential minimized, those local extinctions will
eventually become regional or even global (Perfecto et al. 2009).
At a very large scale, the agricultural matrix in the Amazon region consists of a
mosaic of many different land-use systems. As these different systems -- agriculture,
forestry and livestock -- get establish and fragment the forest and other natural ecosystems
that colonize these land-use systems. That knowledge will allow us to measure the impacts
on biodiversity of the various production systems as well as the tradeoffs and potential
synergies regarding production and conservation objectives. By understanding how these
systems impact biodiversity, and what environmental variables contribute the most to this
diversity, we will be able to develop more biodiversity-friendly systems for the agricultural
matrix within the Amazon region. Since biodiversity has been linked to a variety of
ecosystem services (Balvanera et al. 2006; Swift et al. 2004; Tscharntke et al. 2005), as
well as to sustainability and productivity of managed ecosystems (Balirwa et al. 2003;
Brussaard et al. 2007; Finegan et al. 1998; Primavesi 2006; Scherr & McNeely 2008;
Tilman 1999; Tilman et al. 2002), promoting biodiverse systems will not only conserve
biodiversity within the agricultural matrix, but it can also contribute to the productivity and
sustainability of production systems within the Amazon region.
Studies of biodiversity have often used a variety of taxonomic groups as indicators
(Lawton et al. 1998; Lindenmayer et al. 2000; Schulze et al. 2004). Although no single
taxonomic group has been found to be a good surrogate for all other groups, most groups
are affected in similar ways by habitat modification and follow similar patterns of species
diversity (Lawton et al. 1998; Schulze et al. 2004). Ants are often used as indicators of
In the Brazilian Amazon, ants are extremely diverse and abundant. According to
Wilson (1971) there are more ant species in a square kilometer of Brazilian entire animal
biomass of the terra firme forest in the Amazon is composed of ants and termites
(Holldobler & Wilson 1990; Wilson 1971). However, the importance of ants is more
related to the diversity and strength of the interactions they have with other organisms and
their functions as ecosystem engineers (Folgarait 1998; Holldobler & Wilson 1990;
Vandermeer & Perfecto 2007b).
In this study we compare ant diversity in a variety of land use systems in the
Amazon region of Brazil with the aim at identifying systems that should be promoted and
those that should be avoided based on their impact on ant biodiversity. We also want to
understand what are the environmental variables that support high ant biodiversity among
and within each land use system. To address these questions we used seven land use
systems that are found in the State of Pará in the Brazilian Amazon and that have not
received much attention from the scientific community, and we sample a set of
environmental variables within each system.
The first paper focuses on two of the fastest-growing and most controversial land
use systems in the Brazilian Amazon today, soybean plantations and cattle pastures. Since
soybean plantations tend to be established in cattle ranches, which are then displaced to the
agricultural frontier, we sampled ants in both of these systems. Furthermore, since
agroforestry systems (AFS), have been suggested as an alternative and appropriate form of
agriculture for reducing the environmental impacts of agriculture in the region (Anderson
1990; Finegan et al. 1998; Fujisaka & White 1998; Nicholaides et al. 1985) we also sample
same methodology used in the current study, we compare ant species richness of all three
land use systems with that in forest fragments in the same region. In addition to comparing
ant species richness in all three production systems and forest fragments, we developed a
model using Conversion System Rate Model (CSRM) to simulate ant species richness
under various scenarios of land use. The first scenario examined the transformation of the
landscape from cattle pasture to soybean; the second examined the transformation from
forest to cattle pasture; and the last two, examined the transformation of both soybean and
cattle pasture to agroforestry systems.
The second paper compares estimated species richness, abundance and
composition of the ant community in the same three land use systems, soybean plantations,
cattle pastures and agroforestry systems, and examined in more detail the environmental
variables that contribute to ant species richness in each of them. Using predictive bayesian
models we predict ant species richness based on the various environmental variables
sampled.
Tree plantations are increasingly favored land use systems in the Amazon. The
National Forest Program has as one of its key objectives the reforestation of degraded lands
with tree plantations, with plans to cultivate 22 million hectares of tree plantations on
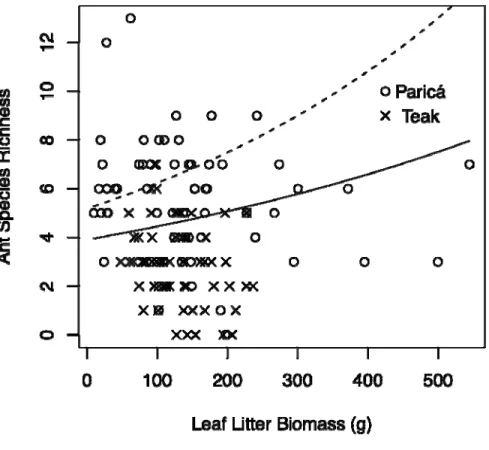
(Tectona grandis), an exotic species often used in timber plantations throughout the tropics
(FAO 2009), and especially in the Amazon region (ABRAF 2009), and under paricá
(Schizolobium amazonicum), one of the most common native trees planted for timber in the
region. This study also examines which environmental variable best explained ant
biodiversity in native- and exotic-planted forests and discuss the tradeoffs associated with
these two types of plantations.
Finally, since organic systems are increasing worldwide due to a higher demand
for these products (IFOAM 2010), in the last paper evaluate ant species richness and
composition in orange orchards under organic and conventional management. In this paper
we also investigate what environmental variables contribute the most to the maintenance of
ant diversity in these systems.
The last chapter of this thesis summarizes the main findings and conclusions of the
studies and discusses alternatives for enhancing the agricultural matrix in the Amazon
region emphasizing systems that create synergies between conservation and livelihood
REFERENCE BIBLIOGRAPHY
ABRAF, A. B. d. P. d. F. P. 2009. Anuário estatístico da ABRAF 2010 ano base 2009.
ABRAF – Associação Brasileira de Produtores de Florestas Plantadas, Brasília.
Andersen, A. N., A. Fisher, B. D. Hoffmann, J. L. Read, and R. Richards. 2004. Use of
terrestrial invertebrates for biodiversity monitoring in Australian rangelands, with
particular reference to ants. Austral Ecology 29:87-92.
Andersen, A. N., B. D. Hoffmann, W. J. Muller, and A. D. Griffiths. 2002. Using ants as
bioindicators in land management: simplifying assessment of ant community
responses. Journal of Applied Ecology 39:8-17.
Anderson, A. B. 1990. Alternatives to deforestation: Steps toward sustainable use of the
Amazon Rain Forest. Columbia Univ. Press, New York, NY.
Armbrecht, I., L. Rivera, and I. Perfecto. 2005. Reduced diversity and complexity in the
leaf-litter ant assemblage of Colombian coffee plantations. Conservation Biology
19:897-907.
Balirwa, J. S., C. A. Chapman, L. J. Chapman, I. G. Cowx, K. Geheb, L. Kaufman, R. H.
Lowe-McConnell, O. Seehausen, J. H. Wanink, R. L. Welcomme, and F. Witte.
2003. Biodiversity and fishery sustainability in the Lake Victoria Basin: An
Capobianco, J. P., A. Veríssimo, A. Moreira, D. Sawyer, I. Santos, and L. P. Pinto 2001.
Biodiversidade na Amazônia Brasileira: Avaliações e ações prioritárias para a
conservação, uso sustentável e repartição de benefícios. Estação Liberdade &
Instituto Socioambiental Belem.
Dirzo, R., and P. H. Raven. 2003. Global state of biodiversity and loss. Annual Review of
Environment and Resources 28:137-167.
Donald, P. F., and A. D. Evans. 2006. Habitat connectivity and matrix restoration: the
wider implications of agri-environment schemes. Journal of Applied Ecology
43:209-218.
FAO 2009. State of the world's forests. Food and Agriculture Organization of the United
Nations, Rome.
Feeley, K. J., and M. R. Silman. 2009. Extinction risks of Amazonian plant species.
Proceedings of the National Academy of Sciences of the United States of America
106:12382-12387.
Finegan, B., W. Palacios, N. Zamora, and D. Delgado. 1998. Ecosystem-level Forest
Biodiversity and Sustentainability Assessments for Forest Management. Page 37 in
R. J. Raison, A. G. Brown, and D. W. Flinn, editors. Criteria and indicators for
sustainable forest management. CABI Publishing, London, UK.
Floren, A., and K. E. Linsenmair. 2005. The importance of primary tropical rain forest for
species diversity: An investigation using arboreal ants as an example. Ecosystems
8:559-567.
Foley, J. A., G. P. Asner, M. H. Costa, M. T. Coe, R. DeFries, H. K. Gibbs, E. A. Howard,
degradation and loss of ecosystem goods and services in the Amazon Basin.
Frontiers in Ecology and the Environment 5:25-32.
Folgarait, P. J. 1998. Ant biodiversity and its relationship to ecosystem functioning: a
review. Biodiversity and Conservation 7:24.
Fujisaka, S., and D. White. 1998. Pasture or permanent crops after slash-and-burn
cultivation? Land-use choice in three Amazon colonies. Agroforestry Systems
42:45-59.
Gibbs, H. K., M. Johnston, J. A. Foley, T. Holloway, C. Monfreda, N. Ramankutty, and D.
Zaks. 2008. Carbon payback times for crop-based biofuel expansion in the tropics:
the effects of changing yield and technology. Environmental Research Letters 3:-.
Harvey, C. A., O. Komar, R. Chazdon, B. G. Ferguson, B. Finegan, D. M. Griffith, M.
Martinez-Ramos, H. Morales, R. Nigh, L. Soto-Pinto, M. Van Breugel, and M.
Wishnie. 2008. Integrating agricultural landscapes with biodiversity conservation in
the Mesoamerican hotspot. Conservation Biology 22:8-15.
Holldobler, B., and E. O. Wilson 1990. The ants. Springer, Berlin.
Hughes, J. B., G. C. Daily, and P. R. Ehrlich. 2000. Conservation of insect diversity: a
habitat approach. Conservation Biology 14:1788-1797.
production cross section for the Li-6+Zr-90 system at energies near the fusion
barrier. Physical Review C 81:-.
Laurance, W. F., A. K. M. Albernaz, P. M. Fearnside, H. L. Vasconcelos, and L. V.
Ferreira. 2004. Deforestation in Amazonia. Science 304:1109-1109.
Lawton, J. H., D. E. Bignell, B. Bolton, G. F. Bloemers, P. Eggleton, P. M. Hammond, M.
Hodda, R. D. Holt, T. B. Larsen, N. A. Mawdsley, N. E. Stork, D. S. Srivastava,
and A. D. Watt. 1998. Biodiversity inventories, indicator taxa and effects of habitat
modification in tropical forest. Nature 391:72-76.
Lindenmayer, D. B., C. R. Margules, and D. B. Botkin. 2000. Indicators of biodiversity for
ecologically sustainable forest management. Conservation Biology 14:941-950.
Moorhead, L. C., S. M. Philpott, and P. Bichier. 2010. Epiphyte Biodiversity in the Coffee
Agricultural Matrix: Canopy Stratification and Distance from Forest Fragments.
Conservation Biology 24:737-746.
Nicholaides, J. J., D. E. Bandy, P. A. Sanchez, J. R. Benites, J. H. Villachica, A. J. Coutu,
and C. S. Valverde. 1985. Agricultural Alternatives for the Amazon Basin.
Bioscience 35:279-285.
Pacala, S., and R. Socolow. 2004. Stabilization wedges: Solving the climate problem for
the next 50 years with current technologies. Science 305:968-972.
Perfecto, I., and J. Vandermeer. 2002. Quality of agroecological matrix in a tropical
montane landscape: Ants in coffee plantations in southern Mexico. Conservation
Perfecto, I., and J. Vandermeer. 2008. Biodiversity conservation in tropical agroecosystems
- A new conservation paradigm. Annals of New York Academy of Sciences
1134:173-200.
Perfecto, I., and J. Vandermeer. 2010. The agroecological matrix as alternative to the
land-sparing/agriculture intensification model. Proceedings of the National Academy of
Sciences of the United States of America 107:5786-5791.
Perfecto, I., J. H. Vandermeer, and A. L. Wright 2009. Nature's matrix: linking agriculture,
conservation and food sovereignty. Earthscan, London; Sterling, VA.
PNF 2000. Programa Nacional de Florestas. Ministerio do Meio Ambiente, BR, Brasilia.
Primavesi, O. 2006. Biodiversity and Sustainability in R. Lal, editor. Encyclopedia of Soil
Science. Taylor & Francis.
PRODES/INPA. 2010. Projeto PRODES: Monitoramento da Floresta Amazonica Brasileira
por satelite. in INPE, editor, Sao Jose do Campos.
Ricketts, T. H. 2004. Tropical forest fragments enhance pollinator activity in nearby coffee
crops. Conservation Biology 18:1262-1271.
Roth, D. S., I. Perfecto, and B. Rathcke. 1994. The Effects of Management-Systems on
Ground-Foraging Ant Diversity in Costa-Rica. Ecological Applications 4:423-436.
2004. Biodiversity indicator groups of tropical land-use systems: Comparing plants,
birds, and insects. Ecological Applications 14:1321-1333.
Swift, M. J., A. M. N. Izac, and M. van Noordwijk. 2004. Biodiversity and ecosystem
services in agricultural landscapes - are we asking the right questions? Agriculture
Ecosystems & Environment 104:113-134.
Tilman, D. 1999. Global environmental impacts of agricultural expansion: The need for
sustainable and efficient practices. Proceedings of the National Academy of
Sciences of the United States of America 96:5995-6000.
Tilman, D., K. G. Cassman, P. A. Matson, R. Naylor, and S. Polasky. 2002. Agricultural
sustainability and intensive production practices. Nature 418:671-677.
Tscharntke, T., A. M. Klein, A. Kruess, I. Steffan-Dewenter, and C. Thies. 2005.
Landscape perspectives on agricultural intensification and biodiversity - ecosystem
service management. Ecology Letters 8:857-874.
Vandermeer, J., and I. Perfecto. 2007a. The agricultural matrix and a future paradigm for
conservation. Conservation Biology 21:274-277.
Vandermeer, J., and I. Perfecto. 2007b. The agricultural matrix and a future paradigm for
conservation. Conserv Biol 21:274-277.
Wilson, E. O. 1971. The Insect Societies. Harvard paperbacks.
Yu, C. M. 2004. O seqüestro florestal de carbono no Brasil: dimensões políticas,
CHAPTER I
BIODIVERSITY DECLINES FOLLOWING THE EXPANSION OF SOYBEAN AND CATTLE RANCHING IN THE AMAZON
Iracenir A. Dos Santos1,2, David N. Allen3, Ines Ibanez2, Evaldo F. Vilela1, Osvaldo R.
Kato4, John Vandermeer2,3 , Jarbas M. Queiroz5 and Ivette Perfecto2.
1
Department of Animal Biology. Federal University of Viçosa, Av. P. H. Rolfs, SN,
Graduate Program in Entomology, Viçosa, MG, Brazil.
2
School of Natural Resources and Environment, University of Michigan, Ann Arbor, MI,
USA.
3
Department of Ecology and Evolutionary Biology, University of Michigan, Ann Arbor, MI,
USA.
4
Embrapa Amazônia Oriental, Belém, PA, Brazil.
5
Abstract
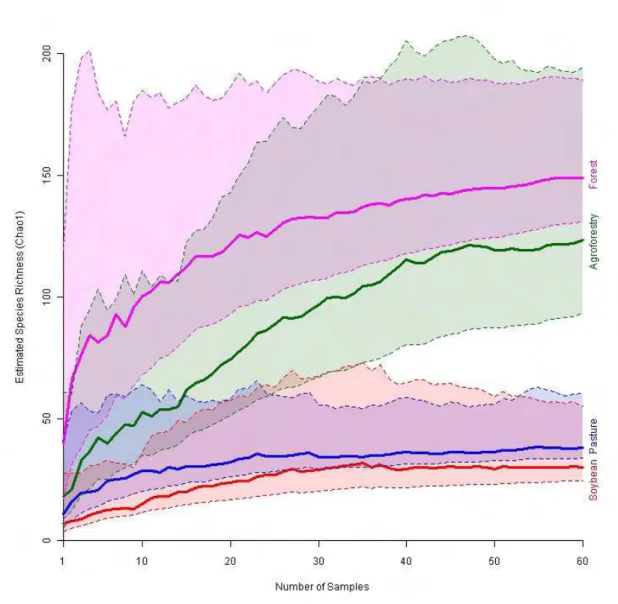
It is familiar knowledge that the expansion of pastures and soybeans in the Amazon contributes to biodiversity loss. Yet a quantitative accounting of that loss has focused on hectares deforested with less regard for the actual impacts on biodiversity over the entire landscape. Here we use ants as an indicator group to study species diversity in forests, pastures, soybean plantations and agroforestry systems in the Amazon region. We also developed projections of species richness under various scenarios with different proportions of these agricultural systems at the landscape level. We find that ant species richness in pasture and soybean is only 25% and 20% of that in primary forest, while agroforestry systems contain 83% of the species richness of the forest. Furthermore, projection models based on species richness estimates indicate that agricultural landscapes dominated by either pasture or soybean will harbour extremely low diversity as compared to landscapes dominated by agroforestry systems.
The loss of biodiversity is one of the major environmental challenges facing
humanity, with deforestation of tropical rain forests receiving the bulk of attention. In the
Brazilian Amazon, conversion to agriculture is frequently the proximate cause of
deforestation. Brazil is the world’s largest exporter of beef and the second largest exporter
of soybeans,1 contributing significantly to the economic performance of this country,1,2.
The recent growth of both of these sectors has contributed to the deforestation crisis in
Brazil.2,3 Concern has been raised as to the effect that massive soybean expansion in the
Amazon might have on this especially biodiversity rich area of the world.3-5 Partly in
and the Brazilian National Grains Exporters’ Association (ABIOVE/ANEC), the two major
Brazilian soybean traders. In 2008 it was extended for one more year with the additional
cooperation of the Brazilian Ministry of the Environment, and since has had one-year
renewals in July 2009 and 2010.6 As a response to this moratorium, soybean producers
began expanding their production to former pasture lands.7 Not surprisingly, the continued
demand for beef products resulted in further expansion of pastures into the forest.5-9
Although deforestation rates in the Amazon have been declining since 2004, in 2009 more
than 7,000 square kilometers of forest were cleared.10 In other words, the socio-political
dynamics of the situation presently are for forest to be converted to pasture, which is
subsequently converted to soybeans, all in conformity with the moratorium against
expanding soybean production directly into forested areas.
Another type of agricultural system, practice primarily by smallholders in the
Amazon, is agroforestry, which consists of the use of timber or fruit trees along with crops
or pastures. Agroforestry systems have long been a traditional form of production in the
humid tropics,11 including many areas of the Amazon basin, and have been proposed as
productive alternatives to soybean and pastures.12-17
Although the environmental impacts of converting large tracks of primary forests to
pastures and soybean are evident and well documented in terms of the loss of habitat,18
there are no quantitative studies of the biodiversity value of soybean, nor any comparisons
of biodiversity with the habitats they replace, particularly pastures and agroforestry
systems.19 Given the current rate of conversion of forest to pasture and pasture to soybean
in some areas of the Amazon basin,20 it is imperative that some quantitative measure of the
biodiversity conservation potential of these land use systems be made, and compared to the
then employed a Conversion System Rate Model (CSRM) based on a re-sampling analysis
to predict ant species richness under various scenarios of landscapes composed of different
proportions of pasture, soybean and agroforestry systems. We used the same model to
predict the number of ant genera under three scenarios of primary forest conversion – forest
to pasture, forest to soybean and forest to agroforestry (see supplementary information).
Further exploration of the effects of distance from the nearest forest fragment was
conducted using predictive Bayesian models. For detailed information on methods and
analyses see supplementary information and supplementary Table S1.
Soybean and pasture sites had significantly lower estimated species richness than that
found in agroforestry or primary forest sites (Fig. 1). Agroforestry systems contained 83%
of the estimated ant species richness of the primary forest, a difference that was not
statistically significant (Fig. 1). Pastures had only 25% and soybeans 20% of the estimated
species richness of forests (statistically significant in both cases). Furthermore, pastures had
31% and soybean 24% of the estimated species richness of agroforestry systems, and the
pattern of species accumulation with increasing sampling intensity suggests that our
methods were actually more efficient in soybean fields and pastures than in agroforestry
systems and primary forests (see supplementary information, Fig. S1). Consequently, the
estimates of species decline with conversion to soybean or pasture are conservative. Finally
there were 41 ant species found in agroforestry sites which were not found in pasture or
soybean sites, compared to just four species unique to pasture and five to soybean, the latter
being species well-known from human-influenced environments (see supplementary
information for ant species list, Table S2).
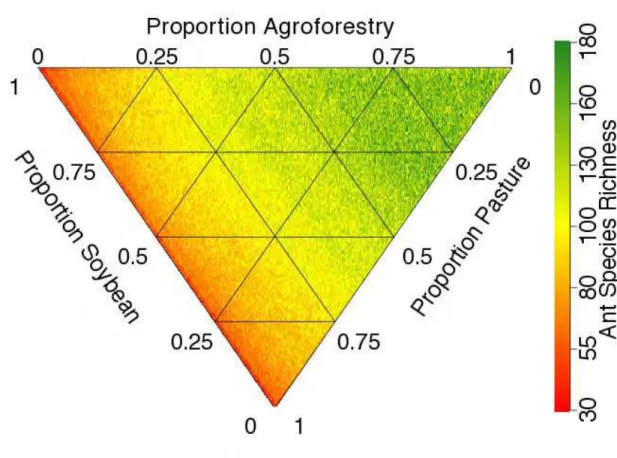
Application of the conversion system rate model provides us with an estimate of ant
species richness within the agroecosystem sector, based on the fraction of land devoted to
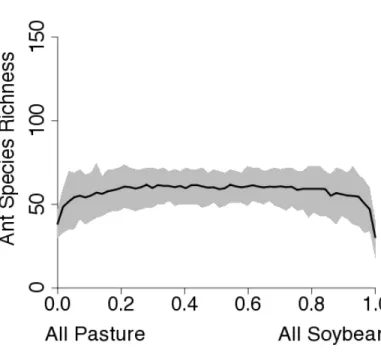
each agroecosystem (Fig. 2). With either a soybean or pasture-dominated landscape the ant
biodiversity would decline dramatically (Fig. 2a and b). As pasture is replaced by soybean
in our re-sampling simulations, as is currently happening in the Amazon region, there is no
decrease in ant species richness because the two land use systems have a similar number of
species (Fig. 2c). It is not until more than 90 percent of the landscape is converted from
and pastures contains more species than a landscape composed entirely of either one.
Further analysis (see supplementary information, Fig. S2) demonstrates that although
conversion from forest to agroforestry systems results in a small loss of biodiversity, our
model estimates that the loss will be far more dramatic when primary forest is converted to
pasture, and even more so when the forest is converted to soybean. Looking at a matrix
landscape composed of the three land use systems (Fig. 2d) as the proportional mix
increases in either soybean or pasture – particularly soybean – dramatic declines in species
richness are to be expected and, strictly from the point of view of biodiversity conservation,
maximizing the area devoted to agroforestry is the best way to conserve biodiversity in the
agricultural landscape.
In addition to the direct conservation value of particular agroecosystems, recent
literature has emphasized the importance of the agroecosystem as a matrix in which an
overall landscape, including natural forest fragments, would be biodiversity-friendly.22,23 In
short, a “high quality” or “permeable” matrix is one in which migration among forest
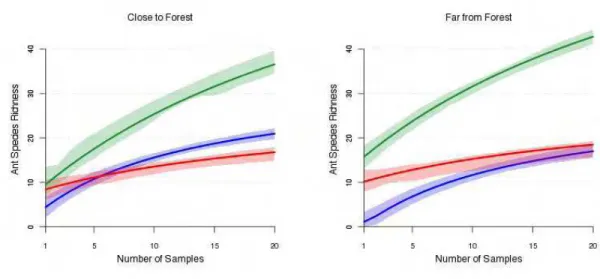
fragments is encouraged.24 Parsing our data to examine sampling sites near to forest
fragments versus far from forest fragments (see supplementary information) we find a
significant effect (Fig. 3). Biodiversity in the agroforestry system is maintained at a high
level even far from forest fragments, suggesting that it might represent a high quality
matrix, whereas the biodiversity in soybean fields is reduced in samples far from forest
fragments. Indeed, in sites far from the forest, ant species richness in agroforestry sites
show a slight, but statistically significant increase in ant species richness, suggesting that in
highly deforested areas, agroforestry systems could represent a refuge for biodiversity.
We conclude that the expansion of soybeans, whether directly through forest clearing
Supplementary Information is linked to the online version of the paper at www.nature.com/nature.
Acknowledgements
We thank F. Fernandez and C. Ortiz with ant species identifications and also to the plantations owners for letting us conduct this research on their land. This research was funded by a CNPq- Conselho Nacional de Desenvolvimento Científico grant (I.A.D.S. and E.F.V.) and supported by the Pro-Ambiente-Pará, Embrapa Amazônia Oriental and TIPITAMBA Project.
Author Contributions I.A.D.S. was involved in study design, collected and analyzed the data, performed the
identification of the ants, and wrote the paper; D.N.A. wrote the paper and developed the CSRM model; I.I. developed the EVPM Bayesian model and provided significant intellectual input to the manuscript; J.Q. collected and identified the ants for the primary forest sites; J.V. and I.P. provided significant intellectual input to the manuscript; E.F.V and O.R.K discussed the results and commented on the manuscript.
Author information The ants collected in this study have been deposited at Regional Entomology Museum
in Federal University of Viçosa. The authors declare no competing financial interest.
Correspondence and requests for materials should be addressed to IADS
Figure 1. Estimated species accumulation curve (Chao1). Solid lines are the mean estimated
number of species at specific number of samples, dotted lines embracing constant colour
A
C
Figure 2. Predictions from the Conversion System Rate Model for ant species richness. A)
Mean number of species with 95 percent confidence intervals for agroforestry to pasture
conversion. The x-axis is the proportion of the landscape converted to pasture. B)
D
Figure 2. Predictions from the Conversion System Rate Model for ant species richness. D)
Predictions from the Conversion System Rate Model for a mixture of the three
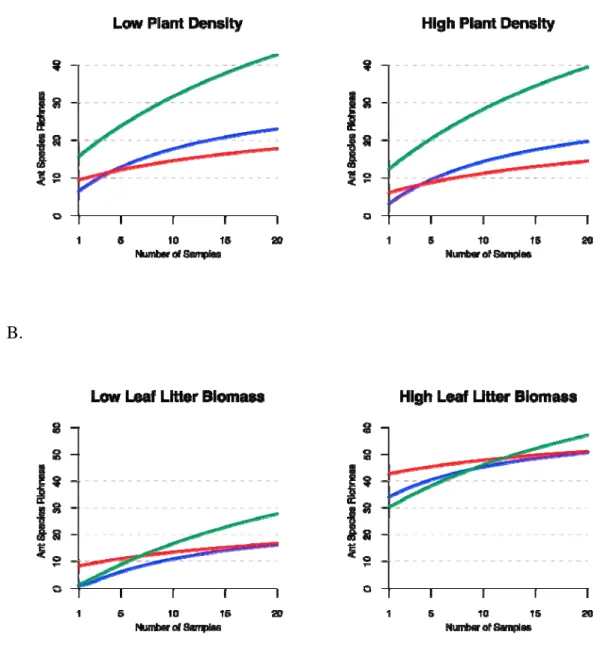
Figure 3. Species accumulation curves from a predictive Bayesian model (described in
detail in the supplementary information) for the three agroecosystems close to and far from
a forest fragment. The green line is agroforestry; blue line is pasture; and red line is
REFERENCE
1 Johnston, M. & Holloway, T. A global comparison of national biodiesel production potentials. Environ Sci Technol 41, 7967-7973 (2007).
2 USDA. Vol. FOP 6-09 (ed United States Department of Agriculture) (USDA, Washington DC, 2009).
3 Fearnside, P. M. Soybean cultivation as a threat to the environment in Brazil. Environ Conserv 28, 23-38 (2001).
4 Hecht, S. B. Soybeans, development and conservation on the Amazon frontier. Dev Change 36, 375-404 (2005).
5 Morton, D. C. et al. Cropland expansion changes deforestation dynamics in the southern Brazilian Amazon. P Natl Acad Sci USA 103, 14637-14641, doi:DOI 10.1073/pnas.0606377103 (2006).
6 ABIOVE. Soy Moratorium, <www.abiove.com.br> (2010).
7 Barona, E., Ramankutty, N., Hyman, G. & Coomes, O. T. The role of pasture and soybean in deforestation of the Brazilian Amazon. Environ Res Lett 5, -, doi:Doi 10.1088/1748-9326/5/2/024002 (2010).
8 Lapola, D. M. et al. Indirect land-use changes can overcome carbon savings from biofuels in Brazil. P Natl Acad Sci USA 107, 3388-3393, doi:DOI
10.1073/pnas.0907318107 (2010).
9 Michalski, F., Peres, C. A. & Lake, I. R. Deforestation dynamics in a fragmented region of southern Amazonia: evaluation and future scenarios. Environ Conserv 35, 93-103, doi:Doi 10.1017/S0376892908004864 (2008).
10 INPE/PRODES. Taxa de desmatamento anual na Amazônia Legal (km2/ano)
<http://www.obt.inpe.br/prodes/index.html> (2010).
11 Nicholaides, J. J. et al. Agricultural Alternatives for the Amazon Basin. Bioscience 35, 279-285 (1985).
12 Perfecto, I., Mas, A., Dietsch, T. & Vandermeer, J. Conservation of biodiversity in coffee agroecosystems: a tri-taxa comparison in southern Mexico. Biodivers Conserv 12, 1239-1252 (2003).
14 Peck, R. B. & Bishop, J. P. Management of Secondary Tree Species in Agroforestry Systems to Improve Production Sustainability in Amazonian Ecuador. Agroforest Syst 17, 53-63 (1992).
15 Loker, W. M. Wheres the Beef - Incorporating Cattle into Sustainable Agroforestry System Sin the Amazon Basin. Agroforest Syst 25, 227-241 (1994).
16 Browder, J. O. & Pedlowski, M. A. Agroforestry performance on small farms in Amazonia: Findings from the Rondonia agroforestry pilot project. Agroforest Syst 49, 63-83 (2000).
17 McGrath, D. A., Comerford, N. B. & Duryea, M. L. Litter dynamics and monthly fluctuations in soil phosphorus availability in an Amazonian agroforest. Forest Ecol Manag 131, 167-181 (2000).
18 Fearnside, P. M. Deforestation in Brazilian Amazonia: History, rates, and consequences. Conserv Biol 19, 680-688 (2005).
19 Donald, P. F. Biodiversity impacts of some agricultural commodity production systems. Conserv Biol 18, 17-37 (2004).
20 INPE. Taxa de desmatamento anual na Amazônia Legal (km2/ano) (2010).
21 Colwell, R. K., Mao, C. X. & Chang, J. Interpolating, extrapolating, and comparing incidence-based species accumulation curves. Ecology 85, 2717-2727 (2004).
22 Donald, P. F. & Evans, A. D. Habitat connectivity and matrix restoration: the wider implications of agri-environment schemes. J Appl Ecol 43, 209-218, doi:DOI 10.1111/j.1365-2664.2006.01146.x (2006).
23 Harvey, C. A. et al. Integrating agricultural landscapes with biodiversity conservation in the Mesoamerican hotspot. Conserv Biol 22, 8-15, doi:DOI 10.1111/j.1523-1739.2007.00863.x (2008).
SUPPLEMENTARY INFORMATION
Methods Study Site
The three agroecosystems (soybean, pastures and agroforestry) were sampled
between January and April, 2008 in Paragominas (soybean plantations- around 03°04'50"S;
47°22'42"W), Igarapé-Açú (Pasture plantations- around 01°04'36.6"S; 47°36'48"W) and
Igarapé-Açú and Inhangapí (agroforestry systems, around 01°02'39.7”S; 47°35'39.9"W).
We used three replicates for each system. The district of Paragominas is the main soybean
production area in the State of Pará and, in the last nine years, has been the region with the
second highest rate of deforestation, second only to São Félix do Xingu.1 The other two
districts in the study have substantial areas devoted to agroforestry and pasture. The forest
samples were part of a separate study and were collected in August 2009 in primary forest
sites within the National Forest of Tapirapé-Aquiri, Serra de Carajas, Pará State (site a-
around 05°49'24.6"S; 50°31'50.1"W; site b- around 05°46'22"S; 50°29'54.1"W; and site c-
around 05°46'19.8"S; 50°33'53"W).
Ant Sampling
For the three types of agroecosystems we collected ants using pitfall traps (18 cm
diameter and 10.5 cm height). In each replicate we installed 20 traps 15 m apart, arranged
in four rows of five pitfalls. We left the traps open for 48 hours. Specimens were sorted,
mounted and identified to genus and species or morphospecies based on literature2,3 and on
comparisons with specimens of the Formicidae Collection of the Museum of Zoology of
the University of São Paulo. The forest ants were also identified to genus and
morphospecies but since another research team conducted the study, the morphospecies
classification does not necessarily correspond to precisely the same species as in the three
agroecosystems and therefore overlap of species between forest and the other three sites
Measuring distance from the nearest forest fragment
For each pitfall trap the distance from the forest was determined by measuring the
distance between the center of the pitfall trap and the closest forest using a 200m measuring
tape. When distances were large -- more than 200m and the distance to the nearest forest
fragment was ambiguous (i.e. there were several forest fragments at similar distances) -- we
used a Topcon Pulse Total Station GPT 3000 to measure various distances and determine
the shortest distance. Once that point was selected we measured the distance with a 200m
measuring tape. This was done to avoid errors generated by the Topcon Pulse Total Station
GPT 3000 under conditions of high humidity.
Ants as an Indicator Group
Studies of biodiversity have often used a variety of taxonomic groups as
indicators.4-6 Although no single taxonomic group has been found to be a good surrogate
for all other groups, most groups are affected in similar ways by habitat modification and
follow similar patterns of species diversity.4,6 Ants are often used as indicators of
biodiversity in tropical ecosystems because they are sensitive to anthropogenic habitat
disturbances, they have complex ecological interactions with many other biotic organisms
in terrestrial ecosystems and they are relatively easy to sample and identify.7-11
In the Brazilian Amazon, ants are extremely diverse and abundant. One third of the
entire animal biomass of the terra firme forest in the Amazon is composed of ants and
termites.3 However, the importance of ants is more related to the diversity and strength of
the interactions they have with other organisms and their functions as ecosystem
calculated the number of samples it took for the Chao1 species accumulation curve to
asymptote (Figure 1). In our hypothetical landscapes we sampled each habitat by taking a
number of samples equal to a fraction of that asymptote-sample number. We used Chao1
estimates to count the number of species found within the pooled samples from across the
fractional habitats, making sure not to double count the overlapped species, which Chao1
also estimates. For each habitat-fraction combination we repeated the resampling 100
times. Figure 2a-c shows the results for hypothetical habitats composed of two of the three
habitat types with the 95 percent confident intervals for the 100 runs, and Figure 2d for
those composed of a combination of all three. To compare these three agroecological
habitat types to the forest we conducted the above analysis at the genus level since we
could not verify the congruency among the morphospecies in the forest sites and the
agroecosystems (Figure S2). In recent years it has been demonstrated that analyses at the
genus level represent taxonomic sufficiency for Neotropical ant assemblages14.
Environmental Variables Prediction Model (EVPM)-Distance from the Forest
In this study we collected data on many environmental variables, however, here we
report the results for only distance from the forests because it was our only landscape level
variable and the most relevant to the data presented here. The effects of vegetation and soil
variables on ant species richness are reported elsewhere (Dos Santos et al., in preparation).
To estimate ant species richness as a function of the distance from the forest we developed
a Bayesian model.15,16 The Bayesian framework allowed us to estimate different responses
at each of the three agroecosystems while still having an overall response to the variability
sampled. The Bayesian method was also useful to deal with the variability found among the
environmental variables (see below).17
Likelihood
From the expected species accumulation curves (Mao Tau) estimates, the number of
accumulated species of ants, S, found in each system, s, at each replicate or farm, f, for a
S
s,f ,nt~
Normal
μ
s,f,nt
,
σ
nt(
)
The mean, μ, is then estimated as a combination of the number of traps sampled, nt, which
follows a saturation curve, and of the environmental variables measured. We were
particularly interested in the effects of distance to the nearest forest fragment18 on ant
diversity, but we are also aware that other environmental variables may affect diversity and
consequently included them in the analysis to better evaluate the effects due solely to
distance, the final model was then:
μ
s, f ,nt=
α
snt
nt
+
θ
s+
β
1NP
s, f+
β
2DP
s, f+
β
3Dist
s, f+
β
4Biom
s, f+
β
5SD
s, f+
β
6N
s, f+
β
7OM
s, f+
β
8pH
s, f+
β
9K
s, f+
β
10Na
s, f+
β
11Ca
s, f+
β
12PH
s, fThe full model included the following environmental variables: NP, plant species number;
DP, plant density; Biom, leaf-litter biomass; SD, soil depth; N, soil nitrogen content; OM,
soil organic matter; pH, soil pH; K, soil potassium; Na, soil sodium; Ca, soil calcium; and
PH, plant height. These variables were measured at each ant baiting site. The parameters α,
estimated for each system as a lognormal distribution (to ensure positive values), determine
the expected maximum number of species at each system. The parameters θ represent the
half saturation point along the species accumulation curves, i.e., how many traps are needed
to sample half of the number of species in the system. Both sets of parameters were
estimated at the system level as:
The precision, τ, (inverse of the variance σ) estimated at each number of traps was modeled from a gamma distribution. We expected larger variances at a low number of traps as they
almost cover the full range of number of species observed at each trap, and at high number
of traps as the sample sizes decrease (e.g., for 20 traps sample size we only have one
observation per farm):
τnt ~Gamma
(
0.01,0.01)
All parameter priors and initial values used in the runs were non-informative. Models were
run in OpenBUGS19 for 100000 iterations to ensure convergence of the parameters. Burn-in
iterations were discharged in the estimation of the posterior parameter means.
Restricted Environmental Variables Model
Since many of the environmental variables were strongly correlated we choose three
of them that seemed to be representative of all the others: distance to forest fragment,
herbaceous plant density and leaf-littler biomass. The environmental variables included in
the analysis were then considered to be latent variables that were also estimated as part of
the model. For each number of pitfall traps, nt, at each replicate or farm, f, the value of each
environmental variable was estimated based on the farm’s mean and standard deviation,
estimated values were then standardized (see above) for the analysis:
env
.var .
f,nt~
Normal env.var.mean
(
f,
env.var.variance
f)
In this paper we show the results only for distance to the nearest forest fragment
because this is the only landscape-level variable that we recorded, and the most pertinent to
RESULTS
Species Accumulation Curves
In addition to the species accumulation curves based on the Chao1 estimates, we
constructed species accumulation curves (sample-based rarefaction) using the observed
(Mao Tau) adjusted estimates with 95% confidence intervals. These curves show
significant differences in species richness between the forest sites and the agroforestry sites
(Fig. S2). However, as can be seen from Figure 1 in the main text, once Chao1 estimates
are calculated, that difference disappears (using 95% CI). As with the Chao1 estimates (Fig.
1 in main text), these curves show that both the soybean and the pasture sites have
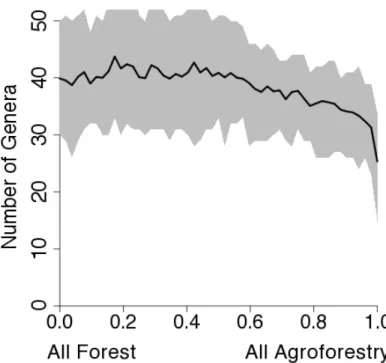
Conversion System Rate Model – Conversion of Forest to Agriculture Using Genus as the Taxonomic Unit of Analysis
The Conversion System Rate Model was run to examine the change in the number
of ant genera when primary forest is converted to agriculture (see methods above). The
results predict a large loss in ant genera with conversion to pasture and soybean but a
A
C.
Figure S2. Predictions from the Conversion System Rate Model for ant genus richness. A)
Mean number of species with 95% confidence intervals for forest to pasture conversion.
The x axis is the proportion of landscape converted to pasture. B) Conversion from forest to
REFERENCES OF SUPPLEMENTARY INFORMATION
1 PRODES/INPA. Projeto PRODES: Monitoramento da Floresta Amazonica
Brasileira por satelite., <http://www.obt.inpe.br/prodes/> (2010).
2 Bolton, B. 1 CD-ROM (Harvard University Press, [Cambridge, Mass.], 2006). 3 Hölldobler, B. & Wilson, E. O. The ants. (Belknap Press of Harvard University
Press, 1990).
4 Lawton, J. H. et al. Biodiversity inventories, indicator taxa and effects of habitat modification in tropical forest. Nature 391, 72-76 (1998).
5 Lindenmayer, D. B., Margules, C. R. & Botkin, D. B. Indicators of biodiversity for ecologically sustainable forest management. Conserv Biol 14, 941-950 (2000). 6 Schulze, C. H. et al. Biodiversity indicator groups of tropical land-use systems:
Comparing plants, birds, and insects. Ecol Appl 14, 1321-1333 (2004).
7 Andersen, A. N., Fisher, A., Hoffmann, B. D., Read, J. L. & Richards, R. Use of terrestrial invertebrates for biodiversity monitoring in Australian rangelands, with particular reference to ants. Austral Ecol 29, 87-92 (2004).
8 Andersen, A. N., Hoffmann, B. D., Muller, W. J. & Griffiths, A. D. Using ants as bioindicators in land management: simplifying assessment of ant community responses. J Appl Ecol 39, 8-17 (2002).
9 Armbrecht, I., Rivera, L. & Perfecto, I. Reduced diversity and complexity in the leaf-litter ant assemblage of Colombian coffee plantations. Conserv Biol 19, 897-907 (2005).
10 Floren, A. & Linsenmair, K. E. The importance of primary tropical rain forest for species diversity: An investigation using arboreal ants as an example. Ecosystems 8, 559-567, doi:DOI 10.1007/s10021-002-0272-8 (2005).
11 Roth, D. S., Perfecto, I. & Rathcke, B. The Effects of Management-Systems on Ground-Foraging Ant Diversity in Costa-Rica. Ecol Appl 4, 423-436 (1994).
12 Folgarait, P. J. Ant biodiversity and its relationship to ecosystem functioning: a review. Biodivers Conserv 7, 1221-1244 (1998).
13 Vandermeer, J. & Perfecto, I. in Ecosystems Engineers: Concepts, Theory, and Applications in Ecology. eds K. M. D. Cuddington, J. E. Byers, A. Hastings, & W. G. Wilson) Ch. 19, (Elsevier, 2007).
14 Groc, S. et al. A new method based on taxonomic sufficiency to simplify studies on
Neotropical ant assemblages. Biol Conserv 143, 2832-2839,
doi:doi:10.1016/j.biocon.2010.07.034 (2010).
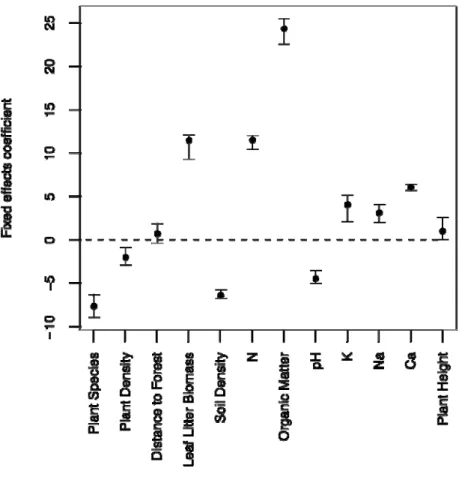
Supplementary Table S1– EVPM Results Posterior mean +SD (95% credible interval).
Fixed effects coefficients
Variable coefficient
Mean +SD (95% CI)
Coefficients statistically significant, different from zero, are indicated in bold
Plant Species - NP -7.25 +0.57 (-8.94,-6.33) Plant Density - DP -1.89 +0.6
(-2.91,-0.9) Distance from the Forest - Dist 0.78 +0.61
(-0.36,1.89) Leaf Litter Biomass - Biom 10.99+0.92 (9.28,12.13) Soil Density - SD -6.39 +0.23 (-6.74,-5.77)
Nitrogen - N 11.44 +0.41
(10.43,12.04) Organic Matter - OM 24.18 +0.94
(22.58,25.51)
soil pH - pH -4.35 +0.42
(-5.03, -3.5)
Potassium – K 3.95 +0.94
(20.6, 5.11)
Sodium – Na 3.04 +0.56
(2.01, 4.03)
Calcium – Ca 6.03 +0.17
(5.7,6.38) Plant High – PH 1.11 +0.73
(0.03,6.38)
Parameters α (maximum number of species) and θ (half saturation) from the saturation curves
Parameter Mean +SD (95% CI)
α pasture 31.2 +0.66
(30.01, 32.27)
α soybean 18.2 +1.04
(20.3,20.72)
α agroforestry system 76.75 +1.64 (73.09,78.2)
θ pasture 13.44 +0.89
(12.5,14.7)
θ soybean 24.31 +2.96
(20.1,26.2)
Number of pitfall traps sampled Mean +SD (95% CI)
1 8.46 +19.4
(4.27, 23.7)
2 5.11 +11.52
(2.5, 14.9)
3 3.71 +7.85
(1.75,11.53)
4 2.76 +5.59
(1.25, 9.19)
5 2.05 +4.09
(0.93, 7)
6 1.48 +2.89
(5.32, 0.67)
7 1.06 +1.96
(3.88,0.45)
8 0.69 +1.18
(0.28, 2.73)
9 0.41 +0.64
(0.16, 1.76)
10 0.20 +0.22
(0.06, 1.1)
11 0.063 +0.03
(0.01, 0.56)
12 0.017 +0.013
(0.002, 0.21)
13 0.0106 +0.011
(0.003, 0.11)
14 0.015 +0.011
(0.004, 0.24)
15 0.05 +0.03
(0.01, 0.48)
16 0.14 +0.16
(0.046, 0.82)
17 0.26 +0.37
(0.1, 1.18)
18 0.4 +0.62
(0.15, 1.73)
19 0.55 +0.94
(0.22, 2.2)
Supplementary Table S2– List of Ant Species a) Ants from the three agroecosystems:
Ant species Past1 Past2 Past3 Soy1 Soy2 Soy3 Agrof1 Agrof2 Agrof3
Dolichoderinae
Dolichoderus bispinosus 1
Dolichoderus diversus 1
Dolichoderus
quadridenticulatus 1
Dorymyrmex (px) jheringi 1 13 13 9
Dorymyrmex brunneus 6 1 2 4 9
Dorymyrmex spurius 4 1 2 1 4
Ecitoninae
Labidus coecus 1
Nomamyrmex esenbeckii 1
Ectatomminae
Ectatomma brunneum 12 11 2 16
Ectatomma tuberculatum 1
Gnamptogenys rastrata 1 1
Formicinae
Acropyga palaga 1
Brachymyrmex pictus 1
Brachymyrmex sp20 1
Brachymyrmex sp21 1
Brachymyrmex sp22 1 1
Camponotus sp21 2
Camponotus cingulatus 1
Camponotus crassus 2 4
Camponotus renggeri 3 1
Camponotus sp10 1
Camponotus sp20 1
Camponotus sp21 1
Camponotus sp4 1
Paratrechina fulva 1 5 1 5 1
Paratrechina sp20 1 2
Myrmicinae
Acromyrmex laticeps
nigrosetosus 1
Mycetarotes paralellus 1
Oxyepoecus nsp 1 1
Oxyepoecus vezenyii 1
Pheidole (gr. fallax) sp36 2 1 3 3
Pheidole (gr. flavens) sp1 1
Pheidole (gr. flavens) sp36 2 2 1
Pheidole fallax 4 13 4 12 24 18 9 8 15
Pheidole flavens 2 2 1 4 1
Pheidole sp20 1 1
Pheidole sp24 1
Pheidole sp25 4 3 1 8 5 6 3 3
Pheidole sp26 2 3 1 1