TCD
3, 307–321, 2009Radio-echo free zone in ice sheets
R. Drews et al.
Title Page
Abstract Introduction
Conclusions References
Tables Figures
◭ ◮
◭ ◮
Back Close
Full Screen / Esc
Printer-friendly Version
Interactive Discussion The Cryosphere Discuss., 3, 307–321, 2009
www.the-cryosphere-discuss.net/3/307/2009/ © Author(s) 2009. This work is distributed under the Creative Commons Attribution 3.0 License.
The Cryosphere Discussions
The Cryosphere Discussionsis the access reviewed discussion forum ofThe Cryosphere
Layer disturbances and the radio-echo
free zone in ice sheets
R. Drews1, O. Eisen1,2, I. Hamann1, S. Kipfstuhl1, A. Lambrecht1,*, D. Steinhage1, F. Wilhelms1, and H. Miller1
1
Alfred-Wegener-Institut f ¨ur Polar- und Meeresforschung, Bremerhaven, Germany 2
Institut f ¨ur Umweltphysik, Heidelberg, Germany *
now at: Bundesanstalt f ¨ur Geowissenschaften und Rohstoffe, Hannover, Germany
Received: 20 March 2009 – Accepted: 23 April 2009 – Published: 28 April 2009
Correspondence to: R. Drews ([email protected])
TCD
3, 307–321, 2009Radio-echo free zone in ice sheets
R. Drews et al.
Title Page
Abstract Introduction
Conclusions References
Tables Figures
◭ ◮
◭ ◮
Back Close
Full Screen / Esc
Printer-friendly Version
Interactive Discussion
Abstract
Radio-echo sounding of the Antarctic and Greenlandic ice sheets often reveals a layer in the lowest hundreds of meters above bedrock more or less free of radio echoes, known as the echo-free zone (EFZ). The cause of this feature is unclear, so far lacking direct evidence for its origin. We compare echoes around the EPICA drill site in Dron-5
ning Maud Land, Antarctica, with the microstructural and dielectrical properties of the EPICA-DML ice core. We find that echoes disappear in the depth range, where the coherency of the layers is lost due to disturbances caused by the ice flow. At the drill site, the EFZ onset at∼2100 m marks a boundary, below which the ice core may have
experienced flow induced disturbances on various scales. The dating of the climate 10
record becomes increasingly difficult below 1900 m, until correlation with the Dome C record is lost below 2417 m depth. The onset also indicates changing rheology which needs to be accounted for in the modeling of ice sheet dynamics.
1 Introduction
For over 40 years radio-echo sounding (RES) has been successfully applied to deter-15
mine ice thickness and internal structure of large ice bodies. Internal echoes (hori-zons) are caused by layers contrasting significantly in the dielectric properties of the surrounding ice. The three causes for such changes are: density variations in shallow ice, acid layers and changing crystal orientation fabric (COF) in deeper ice (∼>500 m)
(Fujita et al., 1999). Changes in density and conductivity have isochronous character 20
(Vaughan et al., 2004; Eisen et al., 2004). Changing COF might have isochronous character, but is also influenced by the ice flow (Eisen et al., 2007).
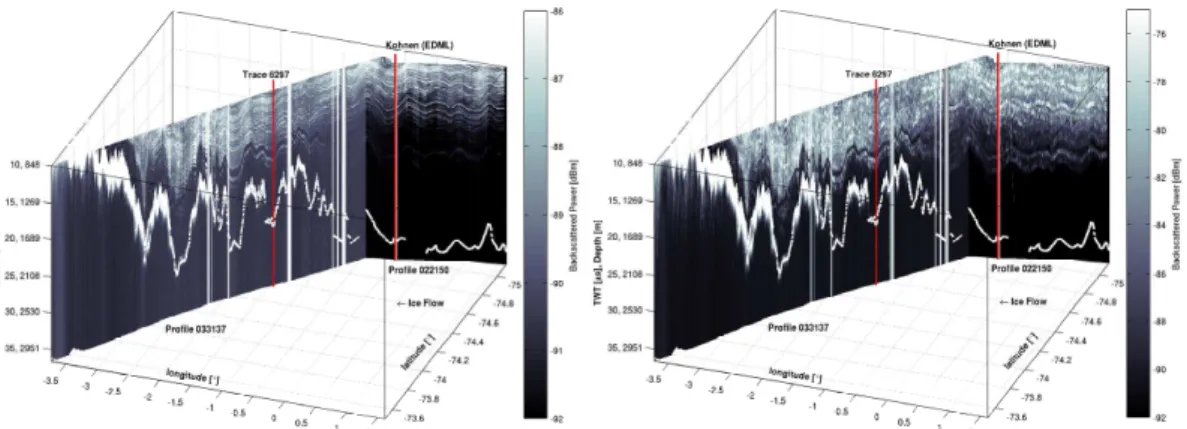
A commonly observed but hitherto unexplained phenomenon is the basal echo free zone (EFZ), a hundreds of meters thick band above the ice bed interface more or less free of radio echoes. An example is illustrated in Fig. 1. The absence of layering was 25
TCD
3, 307–321, 2009Radio-echo free zone in ice sheets
R. Drews et al.
Title Page
Abstract Introduction
Conclusions References
Tables Figures
◭ ◮
◭ ◮
Back Close
Full Screen / Esc
Printer-friendly Version
Interactive Discussion Meldrum (1978). It is often characterized by an abrupt transition and a variable upper
onset. Therefore it is usually not attributed to the loss of RES sensitivity. Typically it follows the bedrock topography and increases in thickness away from ice domes (Mat-suoka et al., 2003). Because direct evidence has been unavailable, it is unclear what triggers the absence of internal reflections within the EFZ, although the EFZ is ob-5
served in extensive parts of the Antarctic ice sheet (e.g. Drewry and Meldrum, 1978; Robin and Millar, 1982; Fujita et al., 1999; Siegert and Kwok, 2000; Matsuoka et al., 2003). It has been suggested by Robin and Millar (1982) that layers become increas-ingly deformed and tilted as the bedrock relief starts to influence stress and strain rates towards the bottom. Fujita et al. (1999) argue that variable shear over an irreg-10
ular surface causes folding, mixing, and faulting of layers and thus inhibits the return of coherent reflections. Siegert and Kwok (2000) propose that recrystallization and recirculation of ice are also involved.
If the EFZ is not due to the system sensitivity, Bogorodsky et al. (1985) consider it as a proxy for the reliability of ice-core records in paleoclimate resarch which relies on 15
parallel layering for the age-depth conversion. As the EFZ likely indicates a change in flow behavior, the mechanisms are also important for the modeling of ice sheet dynamics and stability (Dowdeswell and Evans, 2004).
In order to check the existing hypotheses we compare airborne RES data around the EPICA drill site in Dronning Maud Land (DML), Antarctica, with the microstructural 20
and dielectrical properties of the 2774 m long EPICA-DML (EDML) ice core. Along with data from dielectric profiling (DEP) and the distribution of COF, we use line-scan images to visualize the integrity of layering. Line-scan images display the stratigraphy of high-scattering zones, called cloudy bands (CBs). They correlate with the impurity content of ice and we take them as a proxy for the layering of RES horizons.
25
TCD
3, 307–321, 2009Radio-echo free zone in ice sheets
R. Drews et al.
Title Page
Abstract Introduction
Conclusions References
Tables Figures
◭ ◮
◭ ◮
Back Close
Full Screen / Esc
Printer-friendly Version
Interactive Discussion and cloudy bands which enables a direct comparison with RES data. We find that
radio echoes disappear below∼2100 m at the drill site and that this transition coincides
with progressive disturbances in CB-stratigraphy. We discuss possible reasons for the absence of echoes in that zone and implications for the suitability of ice for paleoclimate research and ice-sheet modeling.
5
2 Methods and findings
2.1 Dielectric profiling and fabric analyzer
For DEP the ice core is placed between cylindrical electrodes to measure the com-plex dielectric permittivity from which bulk density and conductivity can be inferred (Wilhelms et al., 1998). The electrodes were driven with a 250 kHz signal and the 1 cm 10
electrodes were shifted along-core with a 0.5 cm increment. DEP records are corrected for variations in temperature, core diameter, and breaks. The data are scaled (Eisen et al., 2006) to the center frequency of the RES system (150 MHz). In the conduc-tivity profile the number and height of peaks decreases towards greater depths. The last dominant peaks rising three times above the background noise occur at 2180 m. 15
Below 2400 m the typical conductivity peaks are missing. We argue that this is partly due to diffusion but also due to geometric effects of dipped and thinned layers which aggravates the DEP record.
The fabric data are collected from thin sections between crossed polarizers (Wilson et al., 2003). The data are usually displayed in Schmidt diagrams or in terms of three 20
Eigenvalues characterizing an ellipsoid which best approximates the c-axes distribu-tion. Between 2025–2045 m the distribution in COF changes from a vertical girdle type to a single maximum distribution continuing to the bottom (see plots in Eisen et al., 2007). At∼2375 m the fabric resembles a vertical girdle distribution, but COF data in
TCD
3, 307–321, 2009Radio-echo free zone in ice sheets
R. Drews et al.
Title Page
Abstract Introduction
Conclusions References
Tables Figures
◭ ◮
◭ ◮
Back Close
Full Screen / Esc
Printer-friendly Version
Interactive Discussion
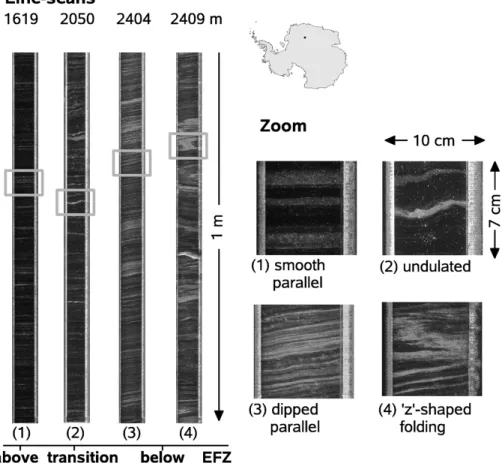
2.2 Line-scans and ice-core characteristics
The line-scan camera images 1-m segments of the ice core at a resolution of 0.1 mm (Svensson et al., 2005). While being moved along the core, the camera records light which is scattered by grain boundaries, air-bubbles and microparticles. Transparent zones appear black, and zones with inclusions appear milky.
5
We see progressive disturbances in CB-stratigraphy with depth (see Fig. 2) which correspond to other ice-core characteristics: above 1700 m the CBs appear straight, smooth, and parallel. They dip slightly due to the inclination of the borehole. Between
∼1700–2050 m the CBs develop mm-scale undulations. From approximately 2050 m
downwards the dip of CBs increases to 10–15◦. Most CBs are still parallel, but
mm-10
scaled z-folds start to develop.
Crystals with diameters larger than 10 cm are present in the last interglacial (MIS5, ∼2300–2375 m) and below ∼2600 m. At the transition from MIS5 to glacial
MIS6 (below about 2400 m), we see a mixture of dipping and undulating CBs on var-ious scales. In the fine-grained ice of MIS6, the CBs appear parallel, horizontal or 15
inclined up to 30◦ alternated with isoclinal z-folds on the cm- to dm-scale. Below a
depth of about 2400 m CBs occur with opposite sign of dip within a single core seg-ment of 1 m length.
2.3 RES internal structure
The airborne RES system operates at a frequency of 150 MHz in a toggle mode al-20
ternately transmitting a pulse with length of 60 and 600 ns (Nixdorf et al., 1999). The theoretical vertical resolution is 5 and 50 m in ice respectively. Conversion of two-way traveltime (TWT) to depth is based on synthetic traces (Eisen et al., 2006).
Figure 1 displays two profiles in the vicinity of the drill site at Kohnen station. Profile 022150 was taken in 2002 and runs parallel to the ice divide. Profile 032137 was 25
TCD
3, 307–321, 2009Radio-echo free zone in ice sheets
R. Drews et al.
Title Page
Abstract Introduction
Conclusions References
Tables Figures
◭ ◮
◭ ◮
Back Close
Full Screen / Esc
Printer-friendly Version
Interactive Discussion ice column and prominent layers can be traced from one profile to the other. At EDML,
the majority of internal reflectors below∼900 m originates from individual conductivity peaks, with some being an interference signal of closely spaced peaks (Eisen et al., 2006). The last two detected signals in the 60 ns RES data at EDML correspond to a reflector from changes in COF at 2040 m (Eisen et al., 2007) and a conductivity peak at 5
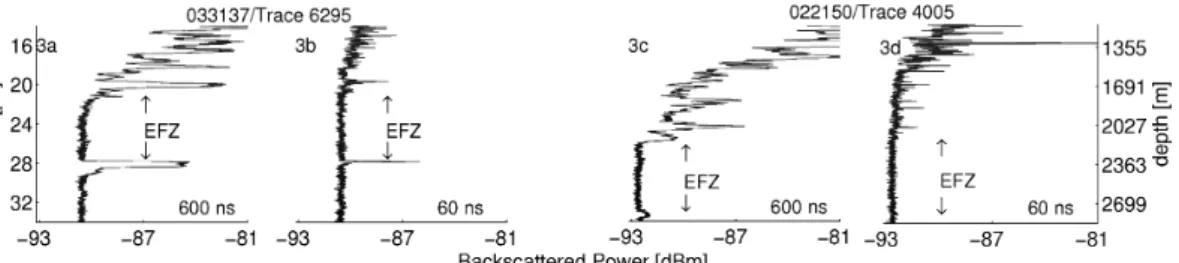
2080 m. The EFZ is observed in both profiles. Small signals sometimes appear within the EFZ but these are laterally usually not continuous. Figure 3a and b display and example from profile 032137, where the last continuous reflector is found at 1654 m depth, 690 m above the bed ice interface. The backscattered intensity in the long pulse data drops by 10 dB. At EDML, the EFZ is less pronounced but still evident (see Fig. 3c 10
and d). Below about 2100 m no continuous internal layering can be found, short and long pulse data fade at similar depth, and the signal drop in the long pulse data is about 4 dB. Between 2300 and 2400 m a weak, frayed, discontinuous, and partly incoherent signal occurs in the 600 ns data. It coincides with the previously mentioned change in COF at 2375 m, and a section of undisturbed CBs below about 2385 m depth. Similar 15
reflectors within the EFZ are also observed at other locations (Robin and Millar, 1982).
3 Physical mechanisms of the EFZ
We hypothesize that in our case the EFZ is due to the absence of suitable reflecting surfaces rather than RES sensitivity. We therefore compare data from the two different pulse lengths (600 and 60 ns, whereby in the portrayed examples the 60 ns pulse was 20
damped by 15 dB on the system side already). The short pulse is used to detect internal layering at high vertical resolution, whereas the long pulse carries more energy and is designed for the sounding of bedrock topography. Comparing the long pulse data with the short pulse data, there is often a direct correspondence between the peaks although the short pulse layering results from interferences within a smaller vertical 25
TCD
3, 307–321, 2009Radio-echo free zone in ice sheets
R. Drews et al.
Title Page
Abstract Introduction
Conclusions References
Tables Figures
◭ ◮
◭ ◮
Back Close
Full Screen / Esc
Printer-friendly Version
Interactive Discussion still be detected with the short pulse. Thus we define the EFZ’s upper onset with the
simultaneous disappearance of continuous layers in the 60 and 600 ns data, whereby backscattered power in the 600 ns data should drop by several dB to ensure that the long pulse has not reached its detection limit.
Using this technique, we identify the EFZ in many places of Fig. 1. It is evident that 5
the EFZ’s upper onset is variable in height and largely follows the bedrock topogra-phy. The onset ranges from 1600–2100 m depth, with a 600–700 m thick gap to the bedrock. Again, a loss of system sensitivity for the internal layering around 1600 m depth (e.g. Fig. 3a and b) seems unlikely, since internal layering is detected at this depth in other places of the profile. One might argue that the onset represents an 10
isotherm as it follows the bedrock topography, and hypothesize a change in temper-ature as the cause. However, in order to explain the sudden absence of echoes one would need a sudden increase in temperature which is not observed in the EDML bore-hole data (Wilhelms et al., 2006). Around the drill site (Fig. 3c and d), backscattered amplitudes and signal drops are weaker. However, since long and short pulse data 15
fade at similar depths, and the EFZ can be traced from shallower depths to the drill site, it seems likely that physical mechanisms other than the loss of system sensitivity are responsible for the absence of layering.
The DEP record changes its characteristic below about 2200 m. Conductivity peaks are broader, less distinct and not as frequent. Thus a one dimensional forward model 20
(Eisen et al., 2006) does not predict reflections within the EFZ. The lack of strong conductivity signals can be due to diffusive effects (counteracted by compression of layers) and small scale mechanical mixing lowering the dielectric contrast. How-ever, the peak broadening can also be linked to layer dipping which is observed in the line-scan data. Non-horizontal conductivity signals cause a wider and broader 25
peak, since the DEP device integrates over the entire core diameterD along the hor-izontal. The magnitude of this effect can be estimated by assuming the conductiv-ity signal σ(z, x) to be Gaussian along the vertical z and dipped with slope m along the horizontal x. This meansσ(z, x)=Aexp−(z−mx)
2
d2
TCD
3, 307–321, 2009Radio-echo free zone in ice sheets
R. Drews et al.
Title Page
Abstract Introduction
Conclusions References
Tables Figures
◭ ◮
◭ ◮
Back Close
Full Screen / Esc
Printer-friendly Version
Interactive Discussion amplitude and d the peak width. The integration over the core diameter D yields
σ(z)=RD
0 σ(z, x)dx=A
√ πd
2 m h
ERFmdx−√z d
iD
0. The magnitude of peak broadening is mainly determined by the initial peak width and the dip angle. With an exemplary peak width ofd=1.5 cm and a dip angle of 15◦, the initial peak height decreases by
∼30%.
Thus the lack of strong conductivity peaks in the DEP record is influenced by geometric 5
effects on the dm-scale.
We suggest that the absence of layering in the radar data is due to a larger scale layer roughness within the first Fresnel zone (diameter∼60 m at 2100 m depth). Not
assuming a one-to-one correspondence between CB an RES reflector, we take the CB stratigraphy as a proxy for the occurrence of coherent RES reflections. Although 10
we do find some undisturbed CBs below about 2100 m, the large majority is disturbed. The increasing waviness of the CBs suggests that the coherence of the reflected RES signals is becoming lost. In contrast, above this transition quasi-parallel layering within the first Fresnel zone results in a coherent superposition from the different parts of the propagating wave. The increasingly disturbed layering at depth reduces the coherent 15
reflections and results in increased destructive superposition, whereby the reflection is lost. Studies about scattering on rough interfaces are often based on the Kirch-hoff approximation, where random and isotropic gaussian surfaces with a specified roughness and correlation length are used. In our case, we estimate that a rms-roughness of∼0.2 m results in ∼10 dB loss in the specular component (Peters et al.,
20
2005). A quantitative derivation of these parameters for the first Fresnel zone from CB disturbances seen in the ice-core is speculative. If we assume that CB-layers do not intersect (as they are isochrones) we can linearely extrapolate dipped cloudy bands in a single core segment and estimate the layer roughness and correlation length from anticipated intersection points. However, this strongly depends on which CBs are used 25
for extrapolation and also does not boarder the parameters with an upper or lower boundary.
TCD
3, 307–321, 2009Radio-echo free zone in ice sheets
R. Drews et al.
Title Page
Abstract Introduction
Conclusions References
Tables Figures
◭ ◮
◭ ◮
Back Close
Full Screen / Esc
Printer-friendly Version
Interactive Discussion by changing COF at the EFZ onset, and by a change in borehole geometry at 2385 m
depth, when drilling was interrupted for two years during 2004 and 2006. The mea-sured borehole closure of 2 mm/a indicates an increase in differential flow by an order of magnitude compared to the upper ice column. In the vicinity around Dome-F an EFZ is also observed. It seems to be stronger developed in the flank-flow regions than di-5
rectly on the dome position (S. Fujita, personal communication, 2003, 2008), indicating an ice-dynamical link. The EDML ice core is situated in such a flank flow regime like-wise as the GISP2 (Greenland Ice Sheet Project) ice core in Greenland. For GISP2, Jacobel and Hodge (1995) describe an analog coincidence of loss in internal layering in the radar data at equal depth with dipped stratigraphy in the ice core.
10
At EDML we think that layer roughness is the main reason for the loss of internal layering. Not enough data are at hand to generalize our results for other places in Greenland and Antarctica.
4 Conclusions
The onset of the EFZ indicates the beginning of varying flow under stronger shear, with 15
mixing and folding of layers towards greater depth. The changing rheology needs to be accounted for in ice-sheet modeling. The EFZ marks the depth within the ice, below which paleoclimate ice-core records have to be interpreted with care. The small-scale CB features we describe may belong to disturbances on a larger scale, with overturning and thus age reversal of layers. It is likely that the disturbances are enhanced in flank 20
flow regimes. For EDML the climate record is dated to 2417 m depth. However, Ruth et al. (2007) report increasing difficulties in matching volcanic events with the Dome Concordia record below 1900 m depth. It is hypothesized that starting at 2050 m depth, complex flow history makes the climate record less reliable until dating is impossible below 2400 m (S. Faria, personal communication, 2009).
25
TCD
3, 307–321, 2009Radio-echo free zone in ice sheets
R. Drews et al.
Title Page
Abstract Introduction
Conclusions References
Tables Figures
◭ ◮
◭ ◮
Back Close
Full Screen / Esc
Printer-friendly Version
Interactive Discussion search for the oldest ice within the framework of the International Partnerships in Ice
Core Sciences (IPICS).
Acknowledgements. This work is a contribution to the European Project for Ice Coring in Antarctica (EPICA), a joint European Science Foundation/European Commission scientific pro-gramme, funded by the EU and by national contributions from Belgium, Denmark, France,
Ger-5
many, Italy, the Netherlands, Norway, Sweden, Switzerland and the United Kingdom. The main logistic support was provided by IPEV and PNRA (at Dome C) and AWI (at Dronning Maud Land).
Preparation of this work was supported by the Emmy Noether-programme of the Deutsche Forschungsgemeinschaft grant EI 672/5 to O. Eisen and a scholarship of the “Evangelisches
10
Studienwerk e.V. Villigst” to R. Drews.
References
Bogorodsky, V., Bentley, C., and Gudmandsen, P.: Radioglaciology, D. Reidel Publishing Co., 1985. 309
Dowdeswell, J. A. and Evans, S.: Investigations of the form and flow of ice sheets and glaciers
15
using radio-echo sounding, Reports on Progress in Physics, 67, 1821–1861, 2004. 309 Drewry, D. J. and Meldrum, D. T.: Antarctic Airborne Radio Echo Sounding, 1977-78, Polar
Record, 19, 267–273, 1978. 308, 309
Eisen, O., Nixdorf, U., Wilhelms, F., and Miller, H.: Age estimates of isochronous reflection horizons by combining ice core, survey, and synthetic radar data, J. Geophys. Res. – solid
20
earth, 109, B04106, doi:10.1029/2003JB002858, 2004. 308
Eisen, O., Wilhelms, F., Steinhage, D., and Schwander, J.: Improved method to determine radio-echo sounding reflector depths from ice-core profiles of permittivity and conductivity, J. Glaciol., 33(12), 299–310, doi:10.1029/2006GL027871, 2006. 310, 311, 312, 313
Eisen, O., Hamann, I., Kipfstuhl, S., Steinhage, D., and Wilhelms, F.: Direct evidence for
contin-25
uous radar reflector originating from changes in crystal-orientation fabric, The Cryosphere, 1, 1–10, 2007,
TCD
3, 307–321, 2009Radio-echo free zone in ice sheets
R. Drews et al.
Title Page
Abstract Introduction
Conclusions References
Tables Figures
◭ ◮
◭ ◮
Back Close
Full Screen / Esc
Printer-friendly Version
Interactive Discussion Fujita, S., Maeno, H., Uratsuka, S., Furukawa, T., Mae, S., Fujii, Y., and Watanabe, O.: Nature
of radio echo layering in the Antarctic ice sheet detected by a two frequency experiment, J. Geophys. Res., 104, 13013–13024, 1999. 308, 309
Jacobel, R. W. and Hodge, S. M.: Radar internal layers from the Greenland summit, Geophys. Res. Lett., 22, 587–590, 1995. 315
5
Matsuoka, K., Furukawa, T., Fujita, S., Maeno, H., Uratsuka, S., Naruse, R., and Watanabe, O.: Crystal orientation fabrics within the Antarctic ice sheet revealed by a multipolarization plane and dual-frequency radar survey, Geophys. Rese. solid earth, 108(B10), 2499, doi: 10.1029/2003JB002425, 2003. 309
Nixdorf, U., Steinhage, D., Meyer, U., Hempel, L., Jenett, M., Wachs, P., and Miller, H.: The
10
newly developed airborne radio-echo sounding system of the AWI as a glaciological tool, Ann. Glaciol., 29, 231–238, 1999. 311
Peters, M. E., Blankenship, D. D., and Morse, D. L.: Analysis techniques for coherent airborne radar sounding: Application to West Antarctic ice streams, J. Geophys. Res., 110, B06303, doi:10.1029/2004JB003222, 2005. 314
15
Robin, G. Q. and Millar, D. M.: Flow of ice sheets in the vicinity of subglacial peaks, Ann. Glaciol., 3, 290–294, 1982. 309, 312
Robin, G. Q., Drewry, D., and Meldrum, D.: International studies of ice sheet and bedrock, Philosophical Transactions of the Royal Society of London, 279, 185–196, 1977. 308 Ruth, U., Barnola, J.-M., Beer, J., Bigler, M., Blunier, T., Castellano, E., Fischer, H., Fundel, F.,
20
Huybrechts, P., Kaufmann, P., Kipfstuhl, S., Lambrecht, A., Morganti, A., Oerter, H., Parrenin, F., Rybak, O., Severi, M., Udisti, R., Wilhelms, F., and Wolff, E.: “EDML1”: a chronology for the EPICA deep ice core from Dronning Maud Land, Antarctica, over the last 150 000 years, Clim. Past, 3, 475–484, 2007,
http://www.clim-past.net/3/475/2007/. 315
25
Siegert, M. and Kwok, R.: Ice-sheet radar layering and the development of preferred crystal orientation fabrics between Lake Vostok and Ridge B, central East Antarctica, Earth Planet. Sci. Lett., 179, 227–235, 2000. 309
Svensson, A., Nielsen, S. W., Kipfstuhl, S., Johnsen, S. J., Steffensen, J. P., Bigler, M., Ruth, U., and R ¨uthlisberger, R.: Visual stratigraphy of the North Greenland Ice Core
30
Project (NorthGRIP) ice core during the last glacial period, J. Geophys. Res., 110, D02108, doi:10.1029/2004JD005134, 2005. 311
TCD
3, 307–321, 2009Radio-echo free zone in ice sheets
R. Drews et al.
Title Page
Abstract Introduction
Conclusions References
Tables Figures
◭ ◮
◭ ◮
Back Close
Full Screen / Esc
Printer-friendly Version
Interactive Discussion Imaging of firn isochrones across an Antarctic ice rise and implications for patterns of snow
accumulation rate, J. Glaciol., 50, 413–418(6), doi:10.3189/172756504781829882, 2004. 308
Wilhelms, F., Kipfstuhl, S., Miller, H., Heinloth, K., and Firestone., J.: Precise dielectric profiling of ice cores: A new device with improved guarding and its theory, J. Glaciol., 44, 171–174,
5
1998. 310
Wilhelms, F., Sheldon, S. G., Hamann, I., and Kipfstuhl, S.: Implications for and Findings from Deep Ice Core Drillings An Example: The Ultimate Tensile Strength of Ice at High Strain Rates, vol. 311, The Royal Society of Chemistry Special Publication, 2006. 313
Wilson, C. J. L., Russell-Head, D., and Sim, H. M.: The application of an automated fabric
10
TCD
3, 307–321, 2009Radio-echo free zone in ice sheets
R. Drews et al.
Title Page
Abstract Introduction
Conclusions References
Tables Figures
◭ ◮
◭ ◮
Back Close
Full Screen / Esc
Printer-friendly Version
Interactive Discussion
TCD
3, 307–321, 2009Radio-echo free zone in ice sheets
R. Drews et al.
Title Page
Abstract Introduction
Conclusions References
Tables Figures
◭ ◮
◭ ◮
Back Close
Full Screen / Esc
Printer-friendly Version
Interactive Discussion
TCD
3, 307–321, 2009Radio-echo free zone in ice sheets
R. Drews et al.
Title Page
Abstract Introduction
Conclusions References
Tables Figures
◭ ◮
◭ ◮
Back Close
Full Screen / Esc
Printer-friendly Version
Interactive Discussion
Fig. 3.The EFZ is identified by the simultaneous disappearance of continuous layers in the 60 and 600 ns data, whereby backscattered power in the 600 ns data drops by several dB,(a)and