*e-mail: [email protected]
Presented at the International Symposium on High Temperature Corrosion in Energy Related Systems, Angra dos Reis - RJ, September 2002.
Lifetime Modelling for MCrAlY Coatings
in Industrial Gas Turbine Blades
Pavel Krukovskya*, Konstantin Tadlyaa, Alexander. Rybnikovb, Iosif Kryukovb, Natalia Mojaiskaiab, Vladislav Kolarikc, Maria Juez-Lorenzoc
aInstitute of Engineering Thermophysics, 2a, Zhelyabov str., 03057 Kiev, Ukraine
bPolzunov Central Boiler and Turbine Institute
Politechnicheskaya, 24, 194021 St. Petersburg, Russia
cFraunhofer-Institut für Chemische Technologie
Joseph-von-Fraunhofer Str. 7, 76327 Pfinztal, Germany
Received: September 2, 2002; Revised: September 4, 2002
A novel theoretical and experimental approach for lifetime modelling of MCrAlY coatings for stationary gas turbines has been undertaken using the Inverse Problem Solution (IPS) tech-nique. With this technique feasible experimental data acquired after a defined experimental time
τe are used as input values for the model parameters estimation. In the first stage of the approach a model, based on the oxidation and diffusion processes (Fick’s first and second law) was assumed, which considers the Al concentration profile across the coating. The measured average Al con-centration profiles in the two-phase γ+β and γ - regions of coating as well as base metal were used as input values for the model parameters estimation and calculational prediction of the long term diffusion and oxidation behavior of the coating was performed. The time, when the β-NiAl phase is completely consumed was assumed as the coating lifetime end. Exposure experiments were carried out with a NiCoCrAlY coating (200 micron thickness) with 8% Al in air at 900 °C and 950 °C, currently up to 10000 h. The oxide scale is growing continuously and no other oxides were observed. The average and β-NiAl phase concentration profiles of Al across the coating thickness were determined by electron microprobe and image analysis systems in the initial state after 700 and 10000 h of oxidation. The concentration profile measured after 700 h was used as input values for the model parameters estimation in order to calculate the Al and β-NiAl phase concentration profiles after 10000 h. The computational forecast for 10000 h at 950 °C and 900 °C are in good agreement with the measured data. The approach was applied for NiCoCrAlY (200 micron thickness) coating lifetime modelling at 950 °C and 900 °C as well as for different coating thicknesses at 950 °C.
Keywords: gas turbines blades, coatings, lifetime modelling, inverse problem
1. Introduction
In modern stationary gas turbines for electric power gen-eration MCrAlY type coatings are used world-wide for pro-tective overlay coatings against oxidation (M comprises Ni and/or Co) 1,2. In future developments higher gas inlet tem-peratures are envisaged for a further increase of the turbine efficiency and for more economic use of the energy re-sources. Higher temperatures however, lead to a significantly increased oxidation attack and accelerated diffusion proc-esses at the coating – substrate interface1.
importance as an applicable model of the oxidation and dif-fusion processes in an MCrAlY coating.
In the case of the MCrAlY coatings the protection against oxidation is achieved by the formation of a thin Al2O3 layer on the coating surface. The Al, which generally is found as a
β-NiAl phase in the coating, is consumed by both Al2O3 for-mation at the surface and by interdiffusion at the substrate – coating interface, producing aluminium depletion zones that increase with time and temperature. When the β-NiAl phase is completely consumed and the Al concentration reaches a critical minimum value, other oxides like Cr2O3 and/or spinels may form besides the protective alumina, leading to internal oxidation1. The time, when the β-NiAl phase is completely consumed is assumed as a coating lifetime end.
So, the long term modelling of Al oxidation and diffu-sion processes in MCrAlY coatings until the β-NiAl phase disapears is the main object of the coating lifetime end esti-mation.
There are models which describe the main physical and chemical processes during the oxide scale and depletion zones formation based on the Fick’s first and second laws3,4 and deliver therefore reliable prediction of the oxidation and diffusion processes. For a reliable quantitative application of latter models however, parameters must be known, which are needed for the calculation. Such parameters are for ex-ample diffusion coefficients of the oxide forming element and the kinetic rate constants for the oxide formation. For the modelling and lifetime prediction reported in5 for in-stance, special experiments and calculation techniques were used for the determination of the diffusion coefficients in Ni-Cr-Al alloys at 1100 and 1200 oC. Furthermore, experi-ments had to be carried out to determine the rate constants of the Al2O3 formation.
The main innovative aspect of the approach described in the present work is the application of the Inverse Prob-lem Solution technique (IPS) to determine the quantitative
values of the model parameters. In the case of the lifetime modelling of MCrAlY coatings only the concentration pro-file of Al across the coating thickness measured after a de-fined time τe of exposure is needed as input values (Fig. 1). All model parameters needed for the modelling like the ef-fective diffusion coefficients are then determined by the IPS technique and used for the forecast calculation. Thus the IPS technique allows an economic quantitative lifetime modelling, which is easily feasible in practice, and enables long-term prediction using experimental data from short exposure times, supposed that no change in the relevant mechanisms occurs.
2. Modelling Approach
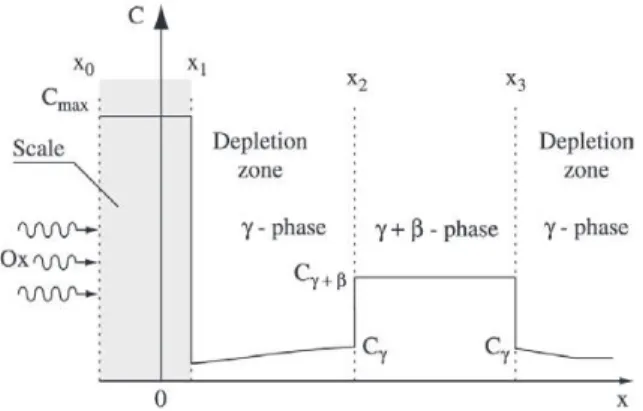
A typical transversal concentration profile of an oxide – Al forming element in the coating near region of the base alloy is shown schematically in Fig. 2 4.
In the case of the MCrAlY coatings the protection against oxidation is achieved by the formation of a thin Al2O3 layer on the coating surface (x1-x0). The Al, which generally is found as a β-NiAl phase in the coating, is consumed by both Al2O3 formation at the surface and by interdiffusion at the substrate – coating interface, producing aluminum de-pletion zones that increase with time and temperature.
A physical and mathematical model considering the Al concentration profile across the coating was applied accord-ing to4. In our case we used the above mentioned model with an effective diffusion coefficient of aluminum DAl. In Fig. 2 Cγ+β is the average aluminum concentration in the two-phase γ+β - region, Cγ is the interfacial concentration of aluminum at the γ / γ+β interfaces. Cγ+β is determined by the volume fraction and the equilibrium concentration of each phase in the two-phase region4. The physical model takes into account that during the oxidation the oxide surface x0 moves outwards, while the boundaries x1 move inwards into the coating alloy, x2 and x3 move towards each other. Time,
Figure 1. Scheme of the Inverse Problem Solution technique for
when the β-NiAl phase is completely consumed, may be assumed as a coating lifetime end.
The modern models for modeling the oxidation and dif-fusion processes in MCrAlY coatings (Fick’s first and sec-ond law) like mentioned above usually can’t be used with good accuracy for lifetime prediction due to unknown model parameters for the complicated MCrAlY coating composi-tions. The physical and mathematical model under consid-eration comprises three kind of input data, which must be known for the prediction of the oxidation and diffusion proc-esses: the DAl effective diffusion coefficient of aluminum, the Cγ interfacial concentration of aluminum at the γ / γ+β
interfaces and oxide scale growth low.
3. Lifetime Prediction by Inverse Problem
Solution (IPS)
The main innovative aspect of the approach described in the present work is the application of the Inverse Prob-lem Solution technique (IPS) to determine the quantitative values of the model parameters. This technique was consid-ered in6,7 for modeling a single-phase coatings.
In the case of the lifetime modeling of MCrAlY coat-ings the concentration profile of Al across the coating thick-ness measured after a defined time τe of exposure to tem-perature is needed as input value only. All model param-eters needed for the modeling like DAl are then determined by the IPS technique and used for the predictive
calcula-tion. Thus the IPS technique allows an economic quantita-tive lifetime modeling, which is easily feasible in practice, and enables long term prediction using short time experi-mental data, supposed that no change in the relevant mecha-nisms occurs.
The approach (Fig. 3) consists of four fundamental steps: 1. Design of a mathematical model or the use of an
ex-isting one.
2. Experiments with given experimentation time and tem-perature delivering input data for the model param-eter estimation.
3. Estimation of the key parameters of the mathematical model for different temperatures (calibration of math-ematical model).
4. Computational prediction of the alloying element dis-tributions and coating lifetime end.
Using the Inverse Problem Solution technique the con-centration profile of Al across the coating thickness CE is needed as experimental input data for the calibration of the mathematical model. For the estimation of the model pa-rameters DAl, and Cγ the following convergence criterion is applied:
,
where P = P(DAl, Cγ ) is the unknown model parameter vec-tor, Cj,M and Cj,E are the calculated and measured Al con-centrations at the jth measuring point of the concentration profile at a given position x, time τ and temperature T, m is the number of the measuring points, δ is the average square root error. The fit procedure of the model parameters is iter-ated until F reaches the given limit of δ, which is 0.8% in the present case.
For performing the lifetime modelling approach by In-verse Problem Solution with the selected MCrAlY coating the following assumptions were considered:
•
One alloying element only, in the present case the alu-minium, forms the oxide scale.•
Oxidation and diffusion mechanism and model pa-rameters do not vary with the time.•
The oxide scale formation occurs at the boundary x1.•
The diffusion coefficients of the Al alloying element DMe are constant and are effective empirical param-eters obtained by short-time experiments with IPS.4. Experimental
Exposure experiments were carried out for a 200 mi-cron NiCoCrAlY coating thickness with 8% Al in air at 900 and 950 °C. The oxide scale growth low was obtained from Figure 3. Scheme of computational and experimental approach
experiment with approximation of the experimental data as a two parabolic curves (see Fig. 4). The oxide scale is grow-ing continuously and no other oxides were observed. The
Al concentration profile (weight %) across the coating and base metal was determined by electron microprobe analy-sis after 700 h (Fig. 5) and 10000 h (Fig. 6). β-phase con-centration profile (volume %) was determined by an optical image analysis system.
5. Results
The measured concentration values CjE (Al total con-centration) after 700 h (Fig. 5) were used to estimate the coefficient DAl and Cγ concentration of the model using the Inverse Problem Solution method. The estimated param-eters value were: DA l = 7.12 ×10⁻¹⁴, m2 s-1, C
γ = 3.65,% at
950 °C. Cγ concentration does not change with time, but different for other temperatures.
A prediction for 10000 h was calculated with the model4 using model parameters estimated from the data after 700 h and compared with the experimentally obtained Al concen-tration profile (Fig. 6).
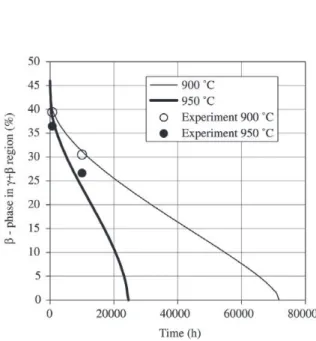
Figure 7 gives predicted and measured beta phase con-centrations during oxidation. The time ≈24000 h means coat-ing lifetime end at 950 °C. The time ≈72000 h is coating lifetime end at 900 °C. The calibrated model with the ISP technique also allows the beta phase life prediction for vari-ous coating thicknesses during oxidation (see Fig. 8).
6. Conclusions
1. The approach by the Inverse Problem Solution showed to be a technically easily feasible way to obtain input values for the model parameter estimation.
Figure 4. Oxide thickness during isothermal oxidation at 950 °C (points are the experimental data).
Figure 5. Measured and calculated total Al concentration profile (weight %) and β- phase (volume %) across the coating and base metal after 700 h at 950 °C.
Figure 6. Measured and calculated total Al concentration profile (weight %) and β- phase (volume %) across the coating and base metal after 10000 h at 950 °C.
2. The model calibrated by the Inverse Problem Solution Technique and short time experimental data can be used for long time modeling and prediction of oxida-tion and diffusion processes in MCrAlY coatings. 3. The diffusion coefficients estimated and used in the
model are effective diffusion coefficients represent-ing the real processes in the coatrepresent-ing under the given conditions.
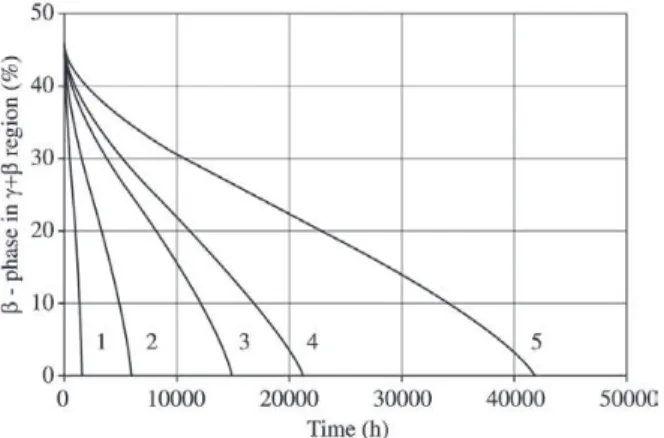
Figure 8. The predicted beta phase amount for various coating thicknesses during isothermal oxidation at 950 °C. (1) curve is 50 micron; (2) is 100 micron; (3) is 150 micron; (4) is 175 micron; (5) is 250 micron.
Acknowledgements
The authors would like to thank NATO for the support of the research work and W. Stamm and S. Alpérine for their contribution in numerous discussions.
References
1. Streiff, R. High Temperature Corrosion 3, Streiff, R.; Stringer, J.; Krutenat, R.C.; Caillet Eds, M. J. Phys.
(France) IV, Colloque C9, v. 3, p. 17-41, 1993.
2. Beele, W.; Czech, N.; Quadakkers, W.J.; Stamm, W. Surf. Coat. Technol., v. 41, p. 94-95, 1997.
3. Nesbitt, J.A. Numerical Modeling of High-Temperature Corrosion Processes, Oxidation of Metals, v. 44, p. 309-338, 1996.
4. Lee, E.Y.; Chartier, D.M.; Biederman, R.R.; Sisson Jr., R.D. Modelling the microstructural evolution of M-Cr-Al-Y coatings during high temperature oxidation. Sur-face and coatings technology, v. 32, p. 19-39, 1987. 5. Nesbitt, J.A.; Heckel, R.W. Interdiffusion in Rich,
Ni-Cr-Al Alloys at 1100 and 1200 °C: Part II. Diffusion Coefficients and Predicted Concentration Profiles, Met. Trans. 18A, December, 1987.
6. P. Krukovsky, V. Kolarik, K. Tadlya, A. Rybnikov, I. Kryukov, M. Juez-Lorenzo Lifetime Modelling of High Temperature Corrosion Processes. Proceedings of an EFC Workshop, 231-245, (2001).