Adriana AnaMaria DAVIDESCU1 Cristian BUSU2
Alexandra Catalina NEDELCU3 Marji Tania Issa EID4
ABSTRACT
The aim of this paper is to highlight the socio-demographic differences regarding the main determinants of employee satisfaction in Jordanian hospitals using a sample of 325 employees from six different hospitals in 2015. Therefore, it has been used Warr-Cook-Wall scale in order to assess job satisfaction according to four dimensions: extrinsic job satisfaction, intrinsic job satisfaction, working conditions satisfaction, employee relations satisfaction. The socio-demographic differences on the job satisfaction factors were analyzed using t-test, Anova test and correlation coefficients. The empirical results pointed out that young and older employees express higher degrees of satisfaction comparative with other age group regarding the extrinsic satisfaction and employee relations and that administrative staff, helpers and doctors are more satisfied intrinsic satisfaction, extrinsic satisfaction, working conditions, employee relations and also on the overall level of satisfaction. Also individuals from horizontal structure exhibit higher levels of satisfaction regarding the job satisfaction factors than the ones from vertical structure.
KEYWORDS: socio-demographic, job satisfaction, hospitals, health workers, Warr-Cook-Wall scale, Jordan
JEL CLASSIFICATION: C25, C38, C83, O15
1. INTRODUCTION
The purpose of this paper is to identify differences of perception regarding the key determinants of job satisfaction among the health workers from Jordanian hospitals. The analysis was made using a sample of 325 employees from six hospitals at the level of the year 2015, based on Warr-Cook-Wall scale. In this respect, t-test, Anova test and correlation coefficients have been applied.
The paper is structured in 4 parts, presenting the literature review, the methodology, the data used, the profile of the respondents and the main empirical results followed by the main conclusions and recommendations.
253 2. LITERATURE REVIEW
Researching on the issue of the socio-demographic differences regarding the main determinants of employee satisfaction in Jordanian hospitals has to take into consideration the
previous studies that focused on the topic of workers’ satisfaction.
Performing highly demanding activity such as the one from the health care area, in particular the hospital one, means that the hospital staff has to be competent, productive and also
receptive. Assessing workers’ job satisfaction should be a constant activity for management
staff. In determining job satisfaction is essential using the right evaluation instruments and such one was created by War, Cook and Wall (1979) – it refers to eight scales suitable to the quality of working life.
Job satisfaction has been a constant preoccupation for other researchers as well: Lehmann, Dieleman & Martineau (2008) considered that financial benefits could be explained as a positive effect only in the case of low salaries, while Lynn & Redman(2005), Joyce et al.(2003) argued that professional support, control over working life, career opportunities and professional development are key-factors when approaching the issue of job satisfaction. Physical working conditions, relationships with fellow workers and managers, pay, promotion, job security, responsibility, recognition were considered important characteristics when determining job satisfaction, as revealed by the study of Lu et al. (2005).
Although financial incentives are very important, there are cases in which these do not hold the dominant position when assessing job satisfaction; other factors were considered of primarily importance instead: working conditions, organizational and management support, teamwork. These data have been revealed by the studies of researchers like: Franco et al.(2004), Mathauer & Imhoff (2006), Manongi et al.(2006). Heritage, Pollock and Roberts
(2015) tested the factor structure of the Warr, Cook and Wall’s Job Satisfaction Scale (JSS)
using data from the Australian employees.
Goetz, Campbell, Steinhaeuser, Broge, Willms and Szecsenyi (2011) made an evaluation of job satisfaction on practice staff and general practitioners. Using the same Warr, Cook and Wall questionnaire they have found out that the both non-physician staff and practice staff were satisfied with their colleagues and dissatisfied with the income they gain.
Reading all these studies leads to one, possibly surprising conclusion: in most of the cases, the respondents considered more important such features like: improving working conditions and teamwork, offering non-financial incentives and also providing opportunities for career opportunities and development, rather than just financial incentives.
3. METHODOLOGY AND DATA
254 type of scale was used by Chew et al. (2013).
The study targeted 325 health workers from six Jordanian hospitals:
- three public hospitals - King Abdullah Hospital, Al-Shona Hospital and Princess Basma Hospital (the biggest public hospital in Jordan);
- three private hospitals - Amman Specialist Hospital, Irbid Specialist Hospital and Ibn Al-Nafees.
In order to point out the main differences regarding the main motivational factors in Jordanian hospitals, t-test, Anova test and correlation coefficients have been applied. To perform the analysis was used The Statistical Package for Social Sciences version 18 (SPSS).
The aim of this research was to answer the following research questions:
(1) People from public hospitals are less satisfied with their wage and their job than those from private hospitals?
(2) Youth are more satisfied with their job or married people? (3) Are nurses less satisfied than other categories?
4. EMPIRICAL RESULTS
4.1. Sample profile
66.5% from the total of 325 respondents are from public hospitals, while only 33.5% of respondents work in private hospitals. About 33% of the respondents work in the largest Jordanian Hospital - Princess Basma Hospital, almost 22% of them are working in Irbid hospital and King Abdullah hospital, while at the opposite side only 4.3% of the respondents are from the private hospital IBN Al-Nafes.
The majority of the respondents (51.4%) are young employee between 25 and 35 years and most of the respondents are male (52.9%). In terms of education, 43.3% of respondents have bachelor degree in science. Regarding their marital status, more than one-fourth of the employees were single (28.3%).
Most of respondents (40.3%) claimed to have more than 10 years’ experience in the hospital,
while 33.5% of the employees declared to have more than 10 years’ experience in the same
position and only 38.8% of the respondents have declared their intention to stay.
51.7% of the respondents work in therapeutic area. Nursing staff represents 36.2% of the total
staff while medical doctor take up about 19%. Regarding the unit’s average daily census,
62.5% of the respondents declared that they have more than 20 patients per day. The majority of the respondents consider that the changes that affect the hospitals in Jordan are heavy workload and health care financing issues.
255
4.2. Analyzing the differences between demographic characteristics and job satisfaction factors in Jordanian hospitals
It is important to point out that information offered by this scale is regarding the overall level of job satisfaction and that is also a measure of satisfaction related to financial incentives.
After analyzing the employee job satisfaction from Jordanian hospitals, it was shown that only 51.1% of respondents are somewhat satisfied with their job and only 16% declared to be very satisfied. Regarding the level of satisfaction by wage, only 39.1% of the respondents declared to be satisfied and only 8% of the respondents declared to by very satisfied.
Table 1. The level of overall job and wage satisfaction
Very dissatisfied
Dissatisfied Neither satisfied
nor dissatisfied
Satisfied Very satisfied
All in all, I am satisfied with my job
29 40 38 166 52
8.9% 12.3% 11.7% 51.1% 16.0% All in all, I am
satisfied with my wage
51 83 38 127 26
15.7% 25.5% 11.7% 39.1% 8.0%
Source: Davidescu, Eid and Sacala (2016)
Analyzing the individuals’ responses on job satisfaction by demographic and employment
variables, we can point out the following:
Almost 70% of employees from both public and private hospitals declared to be satisfied on overall situation, while only 41.2% of public hospitals employees are satisfied with their wages;
70% of males and females are satisfied with their jobs and only 49% of females and 45% of males are satisfied with their salaries;
The young employees are the most satisfied with both their job and their salaries, while 81.3% of the employees with post diploma declared to be satisfied with their jobs;
Almost 70% of employees having 1 year experience in hospital and in the same position stated to be satisfied with their job.
83% of the divorced people stated to be satisfied with their job while helpers and the administrative staff have the highest level of motivation;
More than 70% of people from managerial and diagnostic are satisfied with their job; Extrinsic job satisfaction and employee relations satisfaction was significantly low
among the people over 55 years old, while there is a statistically significant difference between type of employees and the all components of job satisfaction, stating that the most satisfied are the administrative staff and helpers.
256
Overall job satisfaction Overall wage satisfaction
Dissatisf Neutral Satisf Dissatisf Neutral Satisf.
Row N %
Row N %
Row N %
Row N %
Row N %
Row N %
TYPE OF HOSPITAL private 16.5% 13.8% 69.7% 25.7% 15.6% 58.7%
public 23.6% 10.6% 65.7% 49.1% 9.7% 41.2%
GENDER Male 21.5% 9.3% 69.2% 42.4% 12.2% 45.3%
Female 20.9% 14.4% 64.7% 39.9% 11.1% 49.0%
AGE <25 years 11.5% 15.4% 73.1% 19.2% 15.4% 65.4%
[25-35 years] 20.4% 15.6% 64.1% 44.3% 14.4% 41.3%
[36-45 years] 27.4% 6.0% 66.7% 42.9% 6.0% 51.2%
[46-55 years] 25.8% .0% 74.2% 41.9% 6.5% 51.6%
>55 years 5.9% 17.6% 76.5% 35.3% 17.6% 47.1%
GRADUATION DEGREE
Illiterate 38.5% 15.4% 46.2% 61.5% 7.7% 30.8%
Under diploma 31.3% 6.3% 62.5% 62.5% .0% 37.5%
Diploma 18.2% 10.4% 71.4% 48.1% 10.4% 41.6%
Post diploma 18.8% .0% 81.3% 25.0% 18.8% 56.3%
Bachelor of science
21.3% 12.8% 66.0% 41.8% 11.3% 46.8%
Master of science or doctor of medicine
22.2% 11.1% 66.7% 33.3% 13.3% 53.3%
Doctor of philosophy
11.8% 23.5% 64.7% 5.9% 23.5% 70.6%
TIME WORKING IN HOSPITAL
<1 year 5.3% 21.1% 73.7% 31.6% 21.1% 47.4%
[1-2] years 32.5% 10.0% 57.5% 52.5% 12.5% 35.0%
[3-4] years 19.7% 9.8% 70.5% 37.7% 14.8% 47.5%
[5-9] years 16.2% 18.9% 64.9% 25.7% 13.5% 60.8%
>=10 years 23.7% 7.6% 68.7% 49.6% 7.6% 42.7%
YEARS IN THE SAME POSITION
<1 year 25.0% 5.0% 70.0% 40.0% 10.0% 50.0%
[1-2] years 23.6% 14.5% 61.8% 45.5% 14.5% 40.0%
[3-4] years 20.5% 9.6% 69.9% 30.1% 11.0% 58.9%
[5-9] years 19.1% 16.2% 64.7% 35.3% 10.3% 54.4%
>=10 years 21.1% 10.1% 68.8% 50.5% 11.9% 37.6%
MARITAL STATUS Married 21.6% 13.2% 65.2% 44.1% 9.7% 46.3%
Single 20.7% 8.7% 70.7% 34.8% 17.4% 47.8%
Separated/divorced or widowed
16.7% .0% 83.3% 33.3% .0% 66.7%
POSITION Doctors 25.0% 15.0% 60.0% 38.3% 16.7% 45.0%
Nurses 30.5% 8.5% 61.0% 49.2% 6.8% 44.1%
Helpers 11.4% 13.6% 75.0% 34.1% 13.6% 52.3%
257 Administrative
staff
8.9% 8.9% 82.2% 31.1% 15.6% 53.3%
Other health related staff
13.7% 15.7% 70.6% 41.2% 9.8% 49.0%
AREA OF WORK Managerial and
clerical
6.8% 12.3% 80.8% 32.9% 8.2% 58.9%
Ancillary or logistic
22.7% 11.4% 65.9% 40.9% 6.8% 52.3%
Therapeutic 28.6% 11.3% 60.1% 47.6% 11.3% 41.1%
Diagnostic 15.0% 12.5% 72.5% 30.0% 25.0% 45.0%
MANAG.POSITION Yes 19.8% 5.2% 75.0% 39.6% 6.3% 54.2%
No 21.8% 14.4% 63.8% 41.9% 14.0% 44.1%
INTENTION_LEAVE Yes 34.9% 9.5% 55.6% 57.1% 8.7% 34.1%
No 12.6% 13.1% 74.4% 31.2% 13.6% 55.3%
ORGANIS_STRUCTURE Vertical 17.1% 11.0% 71.9% 29.5% 8.9% 61.6%
Horizontal 14.0% 15.8% 70.2% 28.1% 17.5% 54.4%
Matrix 27.3% 18.2% 54.5% 36.4% 27.3% 36.4%
Unclear 29.7% 9.9% 60.4% 64.0% 10.8% 25.2%
AVERAGE DAILY CENSUS
.[1-5] patients 39.1% 8.7% 52.2% 69.6% .0% 30.4%
[6-10] patients 28.1% 12.5% 59.4% 53.1% 12.5% 34.4%
[11-15] patients 9.7% 19.4% 71.0% 25.8% 12.9% 61.3%
[16-20] patients 30.6% 8.3% 61.1% 44.4% 11.1% 44.4%
> 20 patients 18.2% 11.3% 70.4% 37.9% 12.8% 49.3%
Source: Authors contribution
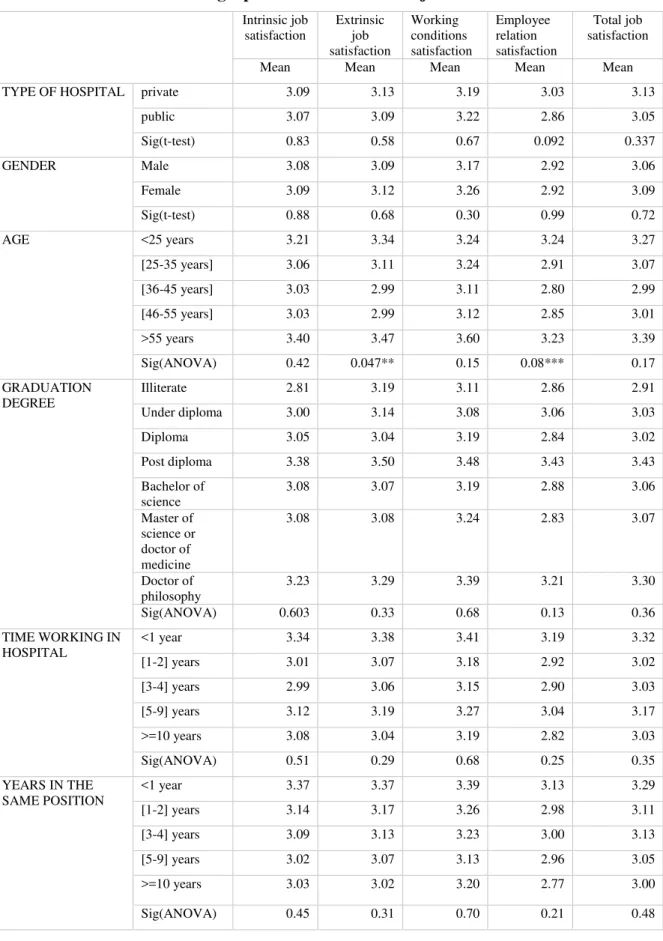
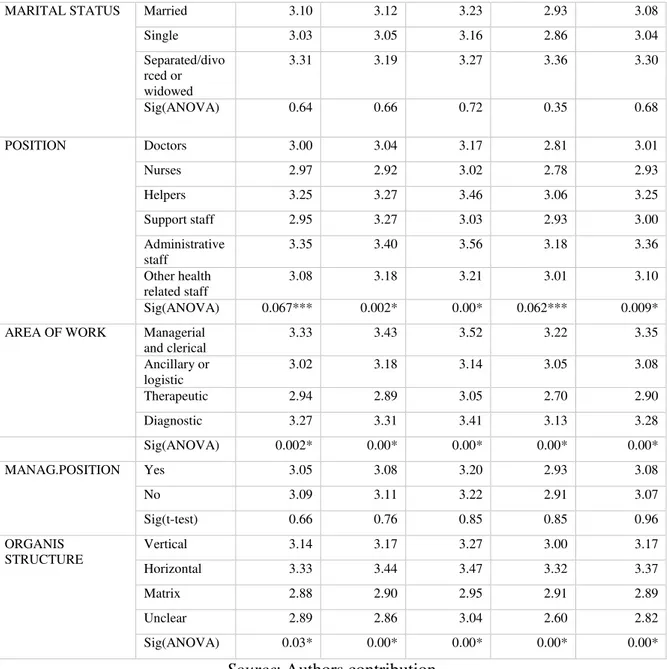
Analyzing the opinions of the respondents concerning the personal and work-related characteristics and the level of satisfaction in Jordanian hospitals we can conclude that there are not significant differences regarding the overall satisfaction level and also intrinsic, extrinsic, working conditions and employee relations by type of hospital, gender, graduation degree, time working in hospital, experience in the same position, marital status, area of work or management position.
But instead we can prove that we have different perceptions of individuals regarding age, position and organization structure.
Therefore, we can mention that young and older employees exhibited higher degrees of satisfaction comparative with other age group regarding the extrinsic satisfaction and employee relations. Also there are quite significant differences between doctors, nurses, supporting staff and administrative staff regarding several satisfaction factors (prob<1%). Thus, administrative staff, helpers and doctors are more satisfied intrinsic satisfaction, extrinsic satisfaction, working conditions, employee relations and also on the overall level of satisfaction. Also individuals from horizontal structure exhibit higher levels of satisfaction regarding the job satisfaction factors than the ones from vertical structure.
258
organizational structure and all components of satisfaction.
Table 3. Socio-demographic differences on the job satisfaction factors
Intrinsic job satisfaction
Extrinsic job satisfaction
Working conditions satisfaction
Employee relation satisfaction
Total job satisfaction
Mean Mean Mean Mean Mean
TYPE OF HOSPITAL private 3.09 3.13 3.19 3.03 3.13
public 3.07 3.09 3.22 2.86 3.05
Sig(t-test) 0.83 0.58 0.67 0.092 0.337
GENDER Male 3.08 3.09 3.17 2.92 3.06
Female 3.09 3.12 3.26 2.92 3.09
Sig(t-test) 0.88 0.68 0.30 0.99 0.72
AGE <25 years 3.21 3.34 3.24 3.24 3.27
[25-35 years] 3.06 3.11 3.24 2.91 3.07
[36-45 years] 3.03 2.99 3.11 2.80 2.99
[46-55 years] 3.03 2.99 3.12 2.85 3.01
>55 years 3.40 3.47 3.60 3.23 3.39
Sig(ANOVA) 0.42 0.047** 0.15 0.08*** 0.17
GRADUATION DEGREE
Illiterate 2.81 3.19 3.11 2.86 2.91
Under diploma 3.00 3.14 3.08 3.06 3.03
Diploma 3.05 3.04 3.19 2.84 3.02
Post diploma 3.38 3.50 3.48 3.43 3.43
Bachelor of science
3.08 3.07 3.19 2.88 3.06
Master of science or doctor of medicine
3.08 3.08 3.24 2.83 3.07
Doctor of philosophy
3.23 3.29 3.39 3.21 3.30
Sig(ANOVA) 0.603 0.33 0.68 0.13 0.36
TIME WORKING IN HOSPITAL
<1 year 3.34 3.38 3.41 3.19 3.32
[1-2] years 3.01 3.07 3.18 2.92 3.02
[3-4] years 2.99 3.06 3.15 2.90 3.03
[5-9] years 3.12 3.19 3.27 3.04 3.17
>=10 years 3.08 3.04 3.19 2.82 3.03
Sig(ANOVA) 0.51 0.29 0.68 0.25 0.35
YEARS IN THE SAME POSITION
<1 year 3.37 3.37 3.39 3.13 3.29
[1-2] years 3.14 3.17 3.26 2.98 3.11
[3-4] years 3.09 3.13 3.23 3.00 3.13
[5-9] years 3.02 3.07 3.13 2.96 3.05
>=10 years 3.03 3.02 3.20 2.77 3.00
259
MARITAL STATUS Married 3.10 3.12 3.23 2.93 3.08
Single 3.03 3.05 3.16 2.86 3.04
Separated/divo rced or widowed
3.31 3.19 3.27 3.36 3.30
Sig(ANOVA) 0.64 0.66 0.72 0.35 0.68
POSITION Doctors 3.00 3.04 3.17 2.81 3.01
Nurses 2.97 2.92 3.02 2.78 2.93
Helpers 3.25 3.27 3.46 3.06 3.25
Support staff 2.95 3.27 3.03 2.93 3.00
Administrative staff
3.35 3.40 3.56 3.18 3.36
Other health related staff
3.08 3.18 3.21 3.01 3.10
Sig(ANOVA) 0.067*** 0.002* 0.00* 0.062*** 0.009*
AREA OF WORK Managerial
and clerical
3.33 3.43 3.52 3.22 3.35
Ancillary or logistic
3.02 3.18 3.14 3.05 3.08
Therapeutic 2.94 2.89 3.05 2.70 2.90
Diagnostic 3.27 3.31 3.41 3.13 3.28
Sig(ANOVA) 0.002* 0.00* 0.00* 0.00* 0.00*
MANAG.POSITION Yes 3.05 3.08 3.20 2.93 3.08
No 3.09 3.11 3.22 2.91 3.07
Sig(t-test) 0.66 0.76 0.85 0.85 0.96
ORGANIS STRUCTURE
Vertical 3.14 3.17 3.27 3.00 3.17
Horizontal 3.33 3.44 3.47 3.32 3.37
Matrix 2.88 2.90 2.95 2.91 2.89
Unclear 2.89 2.86 3.04 2.60 2.82
Sig(ANOVA) 0.03* 0.00* 0.00* 0.00* 0.00*
Source: Authors contribution
Notes: * means significance at 1% level; ** 5% significance level and *** 10% significance level.
Table 4. Table Correlations
Intrinsic job satisfacti on Extrinsic job satisfaction Working conditions satisfaction Employee Relation satisfaction
All in all, I am satisfied with my
job
All in all, I am satisfied with my wage Spearman's rho TYPE OF HOSPITAL Correlation Coefficient
-.011 -.030 .015 -.085 .011 -.191**
Sig. (2-tailed) .841 .592 .791 .127 .843 .001
GENDER Correlation
Coefficient
.005 .006 .038 -.001 .006 .008
Sig. (2-tailed) .926 .912 .496 .983 .915 .888
AGE Correlation
Coefficient
.008 -.051 -.012 -.053 .009 -.002
Sig. (2-tailed) .884 .363 .834 .341 .869 .972
GRADUATI ON DEGREE
Correlation Coefficient
260
WORKING IN
HOSPITAL
Coefficient
Sig. (2-tailed) .881 .322 .692 .150 .903 .471
YEARS IN THE SAME POSITION
Correlation Coefficient
-.085 -.112* -.058 -.111* -.015 -.081
Sig. (2-tailed) .126 .043 .300 .046 .793 .145
MARITAL STATUS
Correlation Coefficient
-.023 -.051 -.047 -.020 .026 .046
Sig. (2-tailed) .684 .357 .398 .723 .646 .410
POSITION Correlation
Coefficient
.111* .155** .136* .143** .167** .063
Sig. (2-tailed) .045 .005 .014 .010 .003 .256
AREA OF WORK
Correlation Coefficient
-.093 -.175** -.136* -.148** -.094 -.094
Sig. (2-tailed) .095 .002 .014 .008 .092 .089
MANAG.POS ITION
Correlation Coefficient
.029 .015 .005 -.004 -.069 -.088
Sig. (2-tailed) .598 .786 .928 .948 .217 .113
INTENTION_ LEAVE
Correlation Coefficient
.267** .220** .186** .254** .223** .235**
Sig. (2-tailed) .000 .000 .001 .000 .000 .000
ORGANIS_S TRUCTURE
Correlation Coefficient
-.132* -.178** -.140* -.196** -.111* -.323**
Sig. (2-tailed) .017 .001 .011 .000 .046 .000
*. Correlation is significant at the 0.05 level (2-tailed).
**. Correlation is significant at the 0.01 level (2-tailed).
Source: Authors contribution
5. CONCLUSIONS
The results of this research show us the differences of perception regarding the main determinants of job satisfaction among the health workers from Jordanian Hospitals. We have found out that from our total of 325 respondents (from both public and private hospitals), only 51.1 % of them are satisfied with their job and 16% seem to be very satisfied.
Taking into account the individuals’ responses on job satisfaction, by demographic and
employment variables, we have revealed the following data: the young employees are the most satisfied with their jobs and salaries, the proportion between male and female satisfaction, on what the salary is concerned, is quite well-balanced, with a difference of only
4% between men and women’s satisfaction score. Regarding the employees, from both public
and private hospitals, 70% stated their satisfaction on the overall situation. Another element worth mentioning is the satisfaction of the divorced employees – 83% of them stated that they are satisfied with their job, while the administrative staff and the helpers have the highest scores for the motivation. In addition, more than 70% of people from managerial and diagnostic departments declared that they are satisfied with their job.
Moreover, we have analyzed the answers of our respondents in what the personal and work-related characteristics and the level of satisfaction for the hospitals from Jordan are concerned
– there are no significant differences regarding the overall satisfaction level, no matter the type of hospital, gender, area of work management, degree, the period of time of the
261
we have proven that there are differences in individuals’ perceptions regarding position, age
and organization structure – the elders and the young employees scored higher levels of
satisfaction, in contrast with other age group regarding the employees’ relations and extrinsic
satisfaction.
In conclusion, the issue of the socio-demographic differences of the main determinants of employee satisfaction in Jordanian Hospitals demands a deeper insight and further investigation by comparing the practices and the experiences of different countries in the process of employee satisfaction.
REFERENCES
Chew, B. H., Ramli, A. S., Omar, M., & Ismail, I. Z. (2013). A preliminary study of job satisfaction and motivation among the Malaysian primary healthcare professionals.
Malaysian family physician: the official journal of the Academy of Family Physicians of Malaysia, 8(2), 15-25.
Davidescu, A.A., Eid, M.T.I., & Sacala, C. (2016). Analyzing the determinants of job satisfaction among Jordanian Hospital Employees using the Warr-Cook-Wall Scale.
Romanian Statistical Review, 3, 81-94
Franco, L.M, Bennett, S., Kanfer, R., & Stubblebine, P. (2004). Determinants and consequences of health worker motivation in hospitals in Jordan and Georgia. Social Science and Medicine, 58(2), 343-355
Goetz, K., Campbell, S. M., Broge, B., Dorfer, C. E., Brodowski, M., & Sczecsenyi, J. (2012). The impact of intrinsic and extrinsiv factor on the job satisfaction of dentists.
Community Dentistry and Oral Epidemology, 40, 474-480
Heritage, B., Pollock, C., & Roberts, L. D. (2015). Confirmatory Factory Analysis of Warr,
Cook, and Wall’s (1979) Job Satisfaction Scale. Australian Psychologist, 50(2), 122-129 Joyce, C., Veitch, C., & Crossland, L. (2003). Professional and social support networks of
rural general practitioners. Australian Journal of Rural Health, 11, 7–14.
Lehmann, U., Dieleman, M., & Martineau, T., (2008). Staffing remote rural areas in middle- and low-income countries: literature review of attraction and retention. BMC Health Services Research, 8, Retrieved July 24, 2016, from
http://bmchealthservres.biomedcentral.com/articles/10.1186/1472-6963-8-19
Lu, H., While, AE., & Bariball, L. (2005). Job satisfaction among nurses: a literature review.
International Journal of Nursing Studies, 42(2), 211-227.
Lynn, M.R., & Redman, R. (2005). Faces of the nursing shortage: influences on staff nurses’ intentions to leave their positions or nursing. Journal of Nursing Administration, 35(5), 264–270.
Mathauer, I., & Imhoff, I. (2006). Health worker motivation in Africa: the role of non-financial incentives and human resources management tools. Human Resources for Health, 4. Retrieved July 26, 2016, from https://human-resources-health.biomedcentral.com/articles/10.1186/1478-4491-4-24
Manongi, R.N., Marchant, T., & Bybjerg, C. (2006). Improving motivation among primary health care workers in Tanzania: a health worker perspective. Human Resources for Health, 4. Retrieved July 26, 2016, from http://human-resources-health.biomedcentral.com/articles/10.1186/1478-4491-4-6
Warr, P., Cook, J. D., & Wall, T. D. (1979). Scales for measurement of work attitudes and psychological well-being. Journal of Occupational and Organizational Psychology, 58,