FACULDADE DE BIOCIÊNCIAS
PROGRAMA DE PÓS-GRADUAÇÃO EM ZOOLOGIA
DEMOGRAFIA HISTÓRICA E CONTEMPORÂNEA DE GUEPARDOS (Acinonyx jubatus) NA NAMÍBIA, ÁFRICA AUSTRAL
Ezequiel Chimbioputo Fabiano
TESE DE DOUTORADO
PONTIFÍCIA UNIVERSIDADE CATÓLICA DO RIO GRANDE DO SUL Av. Ipiranga 6681 – Caixa Postal 1429
Fone: (051) 320-3500 – Fax: (051) 339-1564 CEP 90619-900 Porto Alegre – RS
Brasil
PONTIFÍCIA UNIVERSIDADE CATÓLICA DO RIO GRANDE DO SUL
FACULDADE DE BIOCIÊNCIAS
PROGRAMA DE PÓS-GRADUAÇÃO EM ZOOLOGIA
DEMOGRAFIA HISTÓRICA E CONTEMPORÂNEA DE GUEPARDOS (Acinonyx jubatus) NA NAMÍBIA, ÁFRICA AUSTRAL
Ezequiel Chimbioputo Fabiano
Orientador: Dr. Eduardo Eizirik
Sumário
Dedicatória... ii
Acknowledgments... iii
Resumo... v
Abstract……….. vii
Capitulo I: Introdução Geral………...1-25
Capitulo: II: Inferindo a história demográfica de guepardos da Namibia com
base na análise Bayesiana de dados de microssatélites …………... 26-77
Capitulo III: Estimativas do tamanho efetivo da população de guepardos
(Acinonyx jubatus) da Namibia: comparação de abordagens analíticas e
avaliação do impacto da variação de taxas vitais... 78-127
Capitulo IV: Levantamento e monitoramento de tendências em abundância e
densidade: um estudo de caso de uma população de guepardos (Acinonyx
jubatus) no centro-norte da Namíbia... ... 128-189
Capítulo V: Padrões de atividade temporais de uma população de guepardos,
no centro-norte da Namíbia...190-223
Dedication
This dissertation is dedicated to Almighty God, for giving the opportunity of gaining
new knowledge and to Dr. Martin Mbewe who introduced me to the world of
Acknowledgments
First, I thank God for seeing me through. For being my anchor, source of strength,
motivation, wisdom, calmness, provider, indeed "The Lord is ever present".
Second, I would like to my supervisor Dr. Eduardo Eizirik for taking me in, for your
guidance, patience and perseverance. I did enjoy being under your tutelage and
learning not only about population and conservation genetics but also about human
relations. I appreciated the flexibility you gave me so that I could explore my ideas. I
would like to thank my committee Drs Sandro Luis Bonatto and Nelson
Ferreira Fontoura for advice throughout this journey.
Third, many thanks to my family Marjolein van Dieren, Debora, Delfina and Ambrosio
Fabiano, for keeping me on your prayers and simple being who you are. Marjolein
you are AWESOME!!! Love you all!
Fourth, my gratitude goes to the Cheetah Conservation Fund in particular Dr. Laurie
Marker for believing in me, and Dr. Bruce Brewer. Dr. Anne Schmidt-Küntzel it has
been joyful to work with you. Thank you for always listening and being critical.
Fifth, many thanks to my daughter, Graciela, the best daughter I could have asked
from God. My friends, who where ever present, believed in me, remained true and
honest when necessary and encouraged me, including but not limited to Marianne
De Jonge "Fabiano you will never change when comes to numbers", Veronika
Brinschwitz "Keeping me smiling", Suzie Kenny "Enjoy playing with R", Patricia
Tricorache "Fabiano you can do it, and Manoel Rodrigues "For being a friend, the
I would also like to thank everyone else that in one or another way contributed
towards my journey, members of the Central Baptist Church of Porto Alegre, Prayer
Partners around the globe, colleagues from the Genoma in particular Fernanda
Pedone "for introducing me to world of non-invasive genetics", Ana, Analise, Lucas,
Laura; those who took time to help reviewing the dissertation manuscripts in
particular Katherine Forsythe, Marina and Alexandro, Amanda Fabiano, Frederico
Lemos, Likulela, Carolyn among others....
Lastly but not least, I also thank CAPES, the Cheetah Conservation Fund, the
Rufford Small Grants Foundation and the Wildlife Conservation Network for their
Resumo
Contexto: A diversidade genética contemporânea de espécies e populações é resultante da interação entre aspectos ecológicos e biológicos das mesmas em relação aos efeitos de processos históricos naturais, bem como ao efeito atual dos humanos. Essas forças causaram alterações no tamanho efetivo da população de muitos elementos da fauna e flora, afetando não só os seus potenciais evolutivos, mas também suas distribuições geográficas. Conseqüentemente, existe uma necessidade de caracterizar a história demografica de espécies em diferentes níveis.
A baixa diversidade genética contemporânea de guepardos é usualmente
considerada como o resultado de um severo gargalo genético em torno do Último Máximo Glacial (8.000 - 20.000 anos atrás), seguido por endogamia, uma expansão em meados do Holoceno (5.000 anos) e finalmente um gargalo durante o ultimo século devido a a uma combinação de fatores humanos e variações climáticas. Hipóteses alternativas incluem uma estrutura de metapopulação e persistência de tamanho efetivo baixo, devido à ocorrência de poliginia, gerando uma alta variância reprodutiva. Apesar dos avanços em ferramentas moleculares nas últimas décadas, estas hipóteses permanecem ainda largamente inexploradas. Da mesma forma, os efeitos de fatores humanos sobre a viabilidade da população, precisam ser
quantificados, assim como é necessário determinar as tendências temporais em abundância e densidade utilizando robustas abordagens sistemáticas.
Neste contexto, o objetivo primário deste estudo foi obter novas informações sobre estes aspectos, as quais são consideradas significantes para que medidas de conservação abrangentes sejam colocadas em prática. Especificamente,
exploramos a historia demografica da maior população de guepardos ao longo dos últimos 60 mil anos. Segundo, avaliamos a viabilidade genética desta população e sua sensibilidade a perturbações e incertezas sobre o tamanho da população atual, bem como estimativas da sua capacidade suporte. Por fim, avaliamos as tendências em densidade e abundância, assim como certos aspectos ecológicos
comportamentais de uma população local.
Ferramentas: Métodos Bayesianos foram aplicados para avaliar e contrastar cenários evolutivos de estabilidade, declínio e de expansão em diferentes períodos nos últimos 60 mil anos. Para estimar o tamanho efetivo contemporâneo da
população, foram utilizadas quatro estimativas genéticas e uma baseada em
simulações de viabilidade. Simulações foram realizadas para avaliar a sensibilidade da estimativa de tamanho efectivo a perturbações nas taxas vitais, incertezas no tamanho da população e capacidade suporte. Por fim, o tamanho populacional de censo e a densidade populacional foram estimados através de métodos espaciais e não espaciais de captura-recaptura.
Segundo, estimativas de tamanho efetivo baseadas em simulações indicaram que a população é viável, porém suscetível a perturbações como a proporção de fêmeas reprodutoras, as taxas de sobrevivência de adultos do sexo feminino, e incertezas em estimativas de abundância e de capacidade de suporte. O tamanho de censo da população também foi influenciado por estes parâmetros. No entanto, a influência em ambos os parâmetros é condicionada aos níveis de perturbações.
Terceiro, as estimativas de densidade, principalmente de machos adultos, variaram entre 5 - 20 km-3 e foram semelhantes entre os levantamentos realizados no
decorrer dos seis anos de amostragem. Os guepardos machos mostraram uma fidelidade de até quatro anos de uso consecutivo de sítios de marcação ( scent-marking sites) dentro de suas áreas próprias, evidenciando também um padrão de
atividade predominantemente noturno.
Discussão: Primeiro, o estudo mostra que a diversidade genética contemporânea da população (e possivelmente de outras populações com as quais está
geneticamente ligada) é resultante de um declínio gradual, provavelmente causado por flutuações e reduções de habitat adequado devidas a oscilações climáticas no Pleistoceno e Holoceno, bem como aumentos no nivel de aridez em tempos mais recentes na Namíbia. Segundo, que a viabilidade da população é em grande parte dependente de aspectos relacionados com fêmeas, e que parecem existir valores limiares além dos quais certas perturbações podem ter uma influência negativa sobre a viabilidade. Por último, a densidade de machos parece ser resultado da dinâmica das áreas de vida, visto que a densidade permaneceu semelhante, exceto durante os períodos de instabilidade social causada por áreas vagas. A instabilidade causada por remoções antropogênicas pode, portanto, levar a maior variância
reprodutiva.
Conclusões: O estudo indica que uma estimativa realista do risco de extinção desta população requer a integração de resultados obtidos por diversas abordagens
Abstract
Background: The contemporary genetic diversity of species and populations is a product of climatic oscillations over deeper timescales and/or anthropogenic factors over recent times. These forces caused alterations in the effective population size of fauna and flora, thus affecting not only their evolutionary potential but also species spatial distributions. Consequently, a need exists for assessing the historical demography of species at different population levels.
The origin of the contemporary genetic diversity of cheetahs is thought to be the result of a severe decline around the Last Glacium Maximum (8,000 - 20,000 years ago, ya), followed by an expansion around the mid-Holocene ( 5,000 years) and a subsequent bottleneck within the past century due to a combination of anthropogenic factors and weather variability. Alternative hypotheses include that of a
metapopulation structure and the persistence at a low effective size due to a high reproductive variance associated with a polygynous mating system. However, these three remain largely untested despite advances in molecular analytical tools over the past decades. Likewise, the effects of anthropogenic factors on population viability merit quantification as well as trends in abundance and density using robust
surveying techniques. This study aims to contribute novel information on these aspects; information deemed of high significance for comprehensive conservation measures that do not underestimate the true risk of extinction the species is facing. First, we explored the historical demography of the largest free-ranging cheetah population over the past 60,000 years. Second, we assessed the population’s
genetic viability and its sensitivity to perturbations on vital rates and uncertainties on current population size and carrying capacity estimates. Lastly, we assessed trends in density, abundance, and behavioural ecology aspects of cheetahs.
Methods: To explore the historical demography, we stratified periods during the last 60,000 years and contrasted evolutionary models assuming stability, decline and expansion using approximate Bayesian computation methods. We estimated the
population’s contemporary effective size using four genetic estimators and population viability analysis (PVA). Sensitivity analyses of the susceptibility of viability estimates to perturbations were also performed using a PVA approach. To estimate density and abundance, we used a combination of Bayesian spatial capture, recapture and non-spatial methods.
Results: First, demographic scenarios indicated that the population has a complex demographic history, characterised by periods of decline intercalated with periods of stability with no signal of expansion contrived during the past 60,000 ya. The
population seems to have been stable over the past 300 years. Additionally, scenarios modeled on abrupt reductions had low levels of support in relation to models assuming gradual reductions. Second, we found the present population to be viable, although susceptible to perturbations such as the proportion of breeding females, adult female survival rates, and uncertainties in current abundance estimates and on carrying capacity. These parameters also influenced the total population size. However, the direction of the impact was related to perturbation levels. Lastly, and mostly applicable for males, we observed density estimates of 5 to 20 km-3 that were largely similar across most of the six multi-year surveys.
locations for up to four consecutive years with possible temporal avoidance. Overall individuals displayed a nocturnal activity pattern.
Discussion: First, the study shows that the population’s contemporary genetic
diversity (and possibly that of other populations to which our population is genetically connected) is the result of a gradual decline, likely caused by fluctuations and
reductions of suitable habitat due to Pleistocene and Holocene climatic oscillations, as well as recent increases in aridification in Namibia. Second, that the population viability is largely dependent on aspects related to females, and that threshold values seem to exist beyond which certain conservation actions may have a negative
influence on viability. Lastly, male density seems to be regulated by home range dynamics, as density remained similar across surveys except during periods of social instability caused by vacant home ranges. The instability caused by removals may lead to higher reproductive variance.
Conclusions: Overall, the study shows that a realistic estimate of the risk of extinction faced by this population requires an integration of results obtained with several analytical approached, and that long-term conservation plans should incorporate such a body of information. The observation that viability is susceptible to different biological and social factors highlights the relevance of this assessment, which is integrated to the other themes investigated in this study. In a broader
Introdução Geral
1.1 Estrutura da tese
A tese é composta de cinco capítulos, incluindo o capitulo introdutório (Capítulo I),
seguido de três capítulos apresentados em formato de artigos científicos, redigidos
de acordo com as exigências dos periódicos para os quais se tem interesse em
submetê-los, e o capítulo conclusivo (Capitulo VI). Os capítulos I e VI foram
redigidos de acordo com as normas da revista científica Population Ecology. O título
dos três artigos e dos periódicos científicos para os quais serão submetidos são os
seguintes:
Capítulo II: "Inferindo a história demográfica de guepardos da Namibia com
base na análise Bayesiana de dados de microssatélites", a ser submetido ao
periódico PLoS ONE;
Capítulo III: "Estimativas do tamanho efetivo da população de guepardos (Acinonyx jubatus) da Namíbia: implicações para conservação", a ser
submetido ao periódico Population Ecology;
Capítulo IV: "Levantamento e monitoramento de tendências em abundância e
densidade: um estudo de caso de uma população de guepardos (Acinonyx
jubatus) no centro-norte da Namíbia", em revisão após a apresentação inicial
ao periódico Ecology and Evolution; e,
Capítulo V: "Padrões de atividade temporais de uma população de
guepardos, no centro-norte da Namíbia" a ser submetido ao periódico
A tese termina com o Capítulo VI, que apresenta uma discussão e
conclusões gerais do estudo, descreve as implicações conservacionistas dos
resultados obtidos, assim como realça áreas importantes para futuras pesquisas.
Todas as seções dessa tese contêm suas próprias referências bibliográficas.
A seguir, os aspectos e conceitos centrais desta tese são revisados, incluindo
as hipóteses principais propostas acerca dos fatores que influenciaram a
diversidade genética contemporânea dos guepardos, e também o conceito do
tamanho efetivo de populações. Em seguida são apresentados a relevância do
estudo, objetivos gerais e específicos, e métodos utilizados.
1.2. Contexto da tese
As mudanças climáticas e sua variabilidade ao longo dos últimos milhares de
anos afetaram a biodiversidade do planeta. É considerada uma força de evolução
por induzir mudanças ao ambiente às quais flora e fauna precisam se adaptar (Holt
1990; Ségalen et al. 2007; Weir e Schluter 2007). Alterações frequentemente
ocorreram em diferentes ritmos e intensidade, e variaram espacialmente (Hewitt
2000, 2004). Conseqüentemente, a capacidade de uma espécie adaptar-se ou não
a novas condições ambientais, ou fugir destas, resultou em alterações de sua
distribuição e abundância (Clark et al. 2009; Fraser et al. 2012; Kharouba et al.
2012), enquanto outras se extinguiram, gerando um “turnover” de linhagens
(Caughley e Gunn 1996; Reynolds 2007; Faith 2012). Conseqüentemente, a
biodiversidade atual, e sua diversidade genética, são o resultado de uma longa
história de mudanças climáticas combinadas ou não com fatores antrópicos
(Lorenzen et al. 2011; Phillips et al. 2012). Em essência, este é o objetivo geral
oscilações climáticas e fatores humanos à diversidade genética contemporânea da
maior população de guepardos no mundo. Os conceitos centrais elaborados nesta
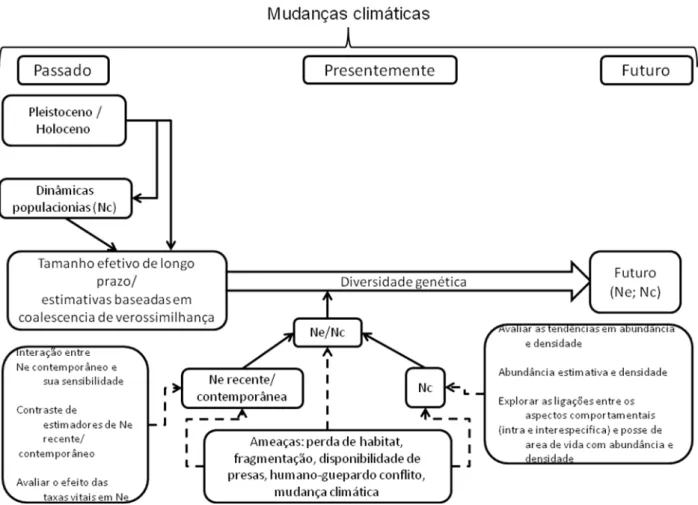
tese e suas relações são apresentados na Figura 1.
Figura 1. Representação esquemática dos aspectos teóricos e conceituais
explorados neste estudo. Ne = effective and Nc = census population sizes.
1.3. Variações da fisionomia vegetacional na África austral durante o Pleistoceno e Holoceno
O clima no continente Africano durante o período Quaternário (2.5 milhões de anos
tendo sido mais instável do que na região austral (Stokes et al. 1997; Dupont et al.
2008; Maslin et al. 2012). Mesmo considerada como tendo sido mais estável em
nível macro, oscilações no clima na África meridional foram notáveis em particular
durante o Pleistoceno e Holoceno (Chase et al. 2010; Weldeab et al. 2012). Pelos
menos quatro eventos periódicos de significante aridez são conhecidos durante o
Pleistoceno nos intervalos 135.000 ou 115.000 - 90.000 anos atrás (aa), 46.000 –
41.000 aa, 26.000 – 20.000 aa e 16.000 – 9.000 aa (Cohen et al. 2007; Stokes et al. 1997). Similarmente, registros indicam que o Último Máximo Glacial (UMG) (~
26.000 – 14.000 aa) (Feankins e deMenocal 2008; Clark et al. 2009) foi intercalado possivelmente por condições úmidas (~ 27.000 – 22.000 aa e 19.000 – 12.000 aa) (Thomas et al. 2003). Estudos mas recentes indicam pelos menos quatro fases
distintas úmidas do sul da África entre 8.500 e 3.500 aa, cada fase durando cerca
de 250 anos, e um aumento da aridez, desde então, até 300 anos atrás (Chase et
al. 2009). Em geral, o clima do Quaternário tornou-se progressivamente mais frio,
mais seco e sazonal (deMenocal 2004) mas às vezes regrediu e manteve-se estável
(de Vivo 2008). Associadas a essas alterações, ocorreram mudanças de paisagem
que conseqüentemente impactaram as linhagens de fauna e flora.
Durante este período, a vegetação do sul da África mudou, alternando
formas, mas progressivamente transicionando de florestas para ambientes abertos
(savanas). Estudos indicam um aumento significante de paisagens mais abertas
entre 1.8 Ma a 0.6 Ma (Cerling 1992; Bobe e Behrensmeyer 2004), com uma
progressão gradual de substituição de plantas adaptadas a condições úmidas por
plantas adaptadas a condições áridas (i.e. C4) (Dupont et al. 2008; Feakins e
deMenocal 2008). Paisagens dominadas por plantas C4 só foram estabelecidas em
aumento da freqüência de secas e aridez também são registradas após 7.000 aa
(Dupont et al. 2008) ou 2.300 – 1.200 aa (Jolly et al. 1997). No entanto, há
evidências de contrações destas paisagens devido à expansão do deserto ao longo
dos últimos 10.000 anos (Hoelzmann et al. 1999; Osmers et al. 2012). Ligadas a
estas alterações de paisagens, houve diversas mudanças na composição da fauna.
A expansão de paisagens abertas resultou em uma substituição de
comunidades dominadas por herbívoros de grandes tamanhos corporais por
ungulados menores de pastagem (Ségalen et al. 2007; de Vivo 2008). O contrário
foi observado durante a transição Pleistoceno-Holoceno (18.000 – 12.000 aa), com uma sobreposição de animais florestais e savânicos em vez de uma comunidade
primariamente composta de herbívoros de áreas abertas (Reed 1997; de Vivo 2008;
Faith 2012). Por exemplo, springbok Antidorcas springbok foi extinto no leste da
África (~ 400.000 anos atrás), mas não no sul da África, onde divergiram em duas
subespécies e recentemente recolonizaram o leste da África (Reynolds 2007).
Assim, além de algumas espécies se extinguirem, a distribuição de várias daquelas
que persistiram foi alterada. Por sua vez, estas mudanças afetaram os padrões de
persistência e distribuição dos carnívoros (Rohland et al. 2005; Cowling et al. 2007).
Bertola et al. (2011) indica que leões (Panthera leo) recolonizaram a parte
oeste-centro da África do Oriente Médio, após a população ter sido extinguida localmente
durante períodos de extrema aridez que levaram à redução de presas durante o
Pleistoceno.
Em suma, a África austral tem experimentado ciclos úmidos – secos de diferentes durações, acompanhados por mudanças em habitat específicas para
na sua distribuição, e mesmo a formação de subespécies (e.g Johnston e Anthony
2012; Osmers et al. 2012).
1. 4 O status quo da história demográfica do guepardo
O guepardo, Acinonyx jubatus, é uma espécie ameaçada de extinção e classificada
como Vulnerável pela União Internacional para a Conservação da Natureza e
Recursos Naturais (IUCN), com menos de 12 mil indivíduos vivos na natureza,
distribuídos em 22 países (Durant et al. 2008). Esta distribuição representa 25% da
sua ocorrência histórica (Ray et al. 2005). Atualmente, com a exceção de Namíbia e
Botswana, as populações restantes são consideradas inviáveis, com populações
inferiores a 500 indivíduos (estimativas baseadas em suposições informadas
(Marker 1998; Durant et al. 2008). Com base nesta abordagem e em questionários,
a população de guepardos na Namibia é estimada de ser de 2.500 indivíduos
adultos, com um tamanho populacional (Nc) total estimado de 3.100 a 5.800
indivíduos (Hanssen e Stander 2004; Durant et al. 2008). No entanto, há uma
escassez de estimativas derivadas de estudos de médio-longo prazo, usando
métodos robustos e sistemáticos (e.g. Durant et al. 2011) Esta falta de estudos de
dinâmica populacional é parcialmente devida a aspectos ecológicos e
comportamentais da espécie (isto é, inconspícuas, noturnas, ocorrendo em baixa
densidade) (Gese 2001), que levam a uma necessidade de esforços de amostragem
maiores (Tomas e de Miranda 2003). Entretanto, tendências de abundância com
base em registros de animais removidos devido a conflito com humanos indicam um
declínio populacional ao longo do século passado (Marker-Kraus et al. 1996; Nowell
1996). Este declínio é resultado de razões ecológicas, incluindo secas, redução de
presas, perda e degradação de hábitat, bem como de caça troféus e remoções pelo
al. 1987; Marker Kraus et al. 1996; Nowell 1996; Marker et al. 2007). Na última
década, contudo, houve uma redução no número de indivíduos removidos, devido a
mudanças de manejo, e a população parece ter se estabilizado (Marker et al. 2007;
Castro-Prieto et al. 2011).
A origem da diversidade genética atual da espécie é resultado da
combinação de eventos anteriores à civilização moderna, em conjunto com fatores
antropogênicos ocorrendo em tempos recentes. Três hipóteses propostas resumem
esta combinação de fatores, embora elas ainda careçam de uma avaliação rigorosa
utilizando métodos estatísticos modernos. A primeira hipótese sugere um severo
gargalo genético em torno do fim do Último Máximo Glacial ou principio do Holocene
(12.000 - 8.000 aa), seguido por um período de endogamia intensa, uma expansão
em meados do Holoceno (5.000 anos) e finalmente um segundo gargalo durante o
ultimo século devido a fatores humanos e variabilidade climática (O’Brien et al.
1985, 1987; Menotti-Raymond e O’Brien 1994; Driscoll et al. 2002). Estas conclusões são baseada no alto nível de homogeneidade detectado com vários
tipos de marcadores genéticos (isoenzimas, RFLPs [polimorfismos de comprimento
de fragmentos de restrição] de DNA mitocondrial [mtDNA], minissatélites,
microssatélites e variabilidade no Complexo Principal de Histocompatibilidade
[MHC]) em amostras da duas subespécies, A. j. jubatus e A.j. raineyi da África
Austral e Oriental, respectivamente (O’Brien et al. 1985, 1987; Menotti-Raymond e
O’Brien 1994). Estudos mas recentes, com maiores amostragens e cobertura geográfica revelam níveis mais altos de diversidade para MHC, mtDNA e
microssatélites (Marker et al. 2008; Castro-Prieto et al. 2011; Charruau et al. 2011),
ainda que não contradigam claramente as inferências reportadas nos estudos
A segunda hipótese sobre a diversidade genética atual dos guepardos
descreve a possibilidade da persistência da população com um baixo tamanho
efetivo (Ne), induzido por uma elevada variação reprodutiva associada com o
sistema de acasalamento poligâmico (Pimm et al. 1989). A terceira sugere que a
diversidade é resultante de dinâmicas de metapopulações, isto é, ciclos contínuos
de extinção de subpopulações e re-colonização de áreas (Pimm et al. 1989; Gilpin
1991; Hedrick 1996). As duas últimas hipóteses foram propostas por razões
demográficas, visto que a gravidade do gargalo sugerido como tendo ocorrrido entre
12.000 e 8.000 aa resultaria em uma probabilidade baixa de sobrevivência da
espécie como um todo.
Com a exceção da segunda hipótese, as outras são compatíveis e invocam o
modelo ambientalmente impulsionado, que prevê fatores ambientais como
geradores de evolução (Vrba 1995). O modelo é suportado por estudos em diversas
espécies da África (e.g. Lorenzen et al. (2012) apresentam um revisão para
ungulados e Teske et al. (2011) para filogeografia marinha) e de outros continentes
(e.g. Turchetto-Zolet et al. (2012) apresenta uma revisão para biodiversidade na
América do Sul, e Hewitt (2000) uma perspectiva global). Novos estudos sobre
guepardos no Serengeti mostram um sistema de acasalamento
poligínico/poliândrico, com uma fidelidade baixa de parceiro (Gotelli et al. 2007),
sugerindo que a existência em longo prazo com níveis baixos de Ne talvez seja
improvável. Igualmente, Ne pode aumentar sob este sistema de acasalamento
devido a uma possível redução na variância reprodutiva masculina (Storz et al.
2001; Pearse and Anderson 2009).
Atualmente, somente dois estudos fornecem informações sobre a viabilidade
uma proporção sexual desviada pró-fêmeas (0,44: 0,56) e Ne 97 (Nc = 101) quando
incluiu indivíduos sem áreas próprias (‘transients”). Em contraste, Kelly (2001), obteve valores de Ne < 50 usando quatro estimadores de Ne com diferentes
suposições, e não incluiu transientes. Além das diferenças nas estimativas, Creel
(1998) observou um efeito mínimo no Ne devido a flutuações no tamanho
populacional ou proporções sexual desiguais, dado não observado por Kelly (2001).
Como as estimativas de abundancia podem afetar o nível de impacto de flutuações
demográficas no valor calculado de Ne (Vucetich e Waite 1998), este fator pode
explicar a falta de influência para o caso de Creel (1998). A exclusão de transientes
por Kelly (2001) pode ter introduzido um viés negativo, considerando a infidelidade
de fêmeas (Gotelli et al. 2007). Contudo, ambos os estudos mostram que Ne é
afetado negativamente por sucessos reprodutivos desiguais. Esses dados reforçam
a necessidade de estudos semelhantes em outras populações.
1.6. Justificativas, e objetivos gerais e específicos do estudo
O estudo teve como objetivo geral a compreensão da demografia histórica e
contemporânea da população de guepardos da Namíbia ao longo dos últimos
60.000 anos, informações estas necessárias para a elaboração de estratégias
adequadas para sua conservação em longo prazo por três razões principais.
Primeiro, é necessária uma melhor compreensão dos processos históricos e
contemporâneos, como por exemplo, o impacto das oscilações climáticas do
Quaternário e fatores humanos que moldaram e possivelmente continuam a
influenciar a diversidade genética contemporânea desta população.
Segundo, a população de guepardos da África austral, e da Namíbia em
et al. 2008; Marker et al. 2010) e tem uma diversidade genética maior do que as
outras populações (Charrua et al. 2011). Além disso, aparenta comportar-se como
uma população panmítica em escala nacional (Marker et al. 2008). No entanto, Ne é
frequentemente menor que Nc e da proporção de indivíduos reprodutores breeding
proportions (Nb) (Frankam 1995; Vucetich e Waite 1998; Palstra e Ruzzante 2008;
Palstra e Fraser 2012), mesmo em populações grandes (Palstra e Fraser 2012),
podendo assim ocasionar uma tendência à perda de variabilidade e menor
viabilidade em longo prazo por influência da deriva genética (Hare et al. 2011).
Finalmente, uma compreensão dos processos que regem a dinâmica
genética (Ne) e demográfica é necessária principalmente para espécies ou
populações em conflito com humanos (Lucherini e Merino 2008; Marker et al. 2010).
A redução de indivíduos adultos na população afeta o tamanho de censo e tem o
potencial de afetar diretamente a diversidade genética da população (Saether et al.
2009; Palstra e Ruzzante 2010; Lee et al. 2011).
De forma geral, a escassez de estudos sobre tamanhos efetivos históricos e
contemporâneos, bem como sobre a dinâmica populacional. Isto limita uma
compreensão dos fatores afetando a diversidade genética das populações e da
espécie.
1.6.1. Objetivos gerais e específicos
Para atingir a meta principal de obter uma compreensão mais ampla sobre os
processos que moldam a diversidade genética da espécie, foram delimitados três
objetivos específicos, sendo eles: (1) uma avaliação estatística da história
demográfica da espécie em relação à variabilidade climática do Quarternário e a
populacional efetivo contemporâneoe e suas taxas vitais; e (3) uma avaliação
aprofundada de tendências de abundância e densidade.
1.7. Ferramentas de estudo
Para explorar a história demográfica de guepardos durante os últimos 60.000 anos,
utilizou-se o método Bayesiano de computação aproximada (ABC) (Storz et al.
2002; Lopes e Beaumont 2010) implementada no pacote DIYABC-FDA (Cornuet et
al. 2010, 2008; Estoup et al. 2012). Este período foi estratificado a fim de avaliar
correlações entre oscilações climáticas e/ou fatores antropogênicos com mudanças
demográficas em escalas menores de tempo. Mudanças demográficas anteriores a
1.000 aa foram interpretadas como sendo relacionadas às oscilações climáticas, e
aquelas com idade de 1.000 aa ou menos como sendo um efeito combinado com
fatores antropogênicos. Em essência, a análise de ABC utiliza uma matriz
coalescente de verossimilhança, gerando um grande número de amostras por meio
de simulações de Monte Carlo, e aplica estatísticas sumárias para selecionar os
conjuntos de dados mais próximos ao conjunto de dados real ) (Excoffier et al. 2005;
Lopes e Beaumont 2010). Em seguida, baseando-se nos conjuntos de dados mais
próximos, a probabilidade relativa posterior de diferentes modelos é calculada,
incluindo inferências de parâmetros demográficos associados.
Para avaliar a sensibilidade da estimativa de viabilidade populacional a
perturbações nas taxas vitais, bem como a incertezas no tamanho da população e
na capacidade suporte, foram realizadas análises de sensibilidade utilizando-se o
programa VORTEX, um software de análise de viabilidade que integra vários
aspectos da história de vida da população (Miller e Lacy 2005). Três métodos foram
método coalescente ABC implementado no programa ONeSAMP (Tallmon et al.
2008); e (ii) método de desequilíbrio de ligação implementado no programa LDNe
(Waples 2006; Waples e Do 2010); e (iii) utilizando as simulações demográficas
realizadas com o programa VORTEX e a fórmula Ne = ½ (1 - exp (logeHt / t)), onde Hté a heterozigosidade esperada após os processos simulados (Crow e Kimura 1970,
ver Eizirik et al. [2002] para uma aplicação).
Por fim, para avaliar as tendências em densidade e abundância em uma
população local de guepardos, métodos espaciais de captura-recaptura (Royle et al.
2009) foram aplicados, utilizando o software SPACECAP (Gopalaswamy et al.
2012). Estes foram baseados em um conjunto de dados de uma área de tamanho
similar amostrada por seis anos com armadilhas fotográficas colocadas, na maior
parte, em sítios de marcação. Padrões de utilização de áreas, marcação, e
fidelidade em relação a áreas de permanência também foram explorados.
Referências
Bertola LD, Van Hooft WF, Vrieling K, Uit de Weerd DR, York DS, Bauer H, Prins
HHT et al. (2011) Genetic diversity, evolutionary history and implications for
conservation of the lion (Panthera leo) in West and Central Africa. J Biogeogr38
1356–1367.
Bobe R, Behrensmeyer AK (2004) The expansion of grassland ecosystems in Africa
in relation to mammalian evolution and the origin of the genus Homo.
Palaeogeogr Palaeoclimatol Palaeoecol 207: 399–420.
Caughley G, Gunn A (1996) Conservation biology in theory and practice.
Castro-Prieto A, Wachter B, Sommer S (2011) Cheetah paradigm revisited: MHC
diversity in the world’s largest free-ranging population. Mol Biol Evol 28: 1455 –
1468
Cerling TE(1992) Development of grasslands and savannas in East Africa during the
Neogene. Palaeogeogr Palaeoclimatol Palaeoecol97: 241–247
Charruau P, Fernandes C, Wengel PO, Peters J, Hunter L, Ziaie H, Jourabchian A,
et al (2011) Phylogeography , genetic structure and population divergence time
of cheetahs in Africa and Asia : evidence for long-term geographic isolates. Mol
Ecol 20:, 706–724
Chase BM, Meadows ME, Carr AS, Reimer PJ (2010) Evidence for progressive
Holocene aridification in southern Africa recorded in Namibian hyrax middens:
Implications for African Monsoon dynamics and the “‘African Humid Period’”.
Quatern Res 74: 36–45
Chase BM, Meadows ME, Scott L, Thomas DSG, Marais E, Sealy J, Reimer PJ
(2009) A record of rapid Holocene climate change preserved in hyrax middens
from southwestern Africa. Geology 37: 703–706
Clark PU, Dyke AS, Shakun JD, Carlson AE, Clark J, Wohlfarth B, Mitrovica JX, et al
(2009) The Last Glacial Maximum. Science 325: 710–4
Cohen AS, Stone JR, Beuning KRM, Park LE, Reinthal PN, Dettman D, Scholz CAet
al (2007) Ecological consequences of early Late Pleistocene megadroughts in
Cornuet J-M, Ravigné V, Estoup A (2010) Inference on population history and model
checking using DNA sequence and microsatellite data with the software
DIYABC (v1.0). Bioinformatics 11, 401. doi:10.1186/1471-2105-11-401
Cornuet J-M, Santos F, Beaumont MA, Robert CP, Marin J-M, Balding DJ,
Guillemaud T, T., et al (2008) Inferring population history with DIY ABC: a
user-friendly approach to approximate Bayesian computation. Bioinformatics 24:
2713–9
Cowling SA, Cox PM, Jones CD, Maslin MA, Peros M, Spall SA (2008) Simulated
glacial and interglacial vegetation across Africa: implications for species
phylogenies and trans-African migration of plants and animals. Global Change
Biol 14: 827–840.
Creel S (1998) Social organization and effective population size in carnivores. In:
Caro T (ed) Behavioral ecology and Conservation biology. Oxford University Press,
New York, pp 246–270
Crow JF, Kimura AM (1970) An introduction to population genetics theory. Harper &
Row, Publishers, London
deMenocal PB (2004) African climate change and faunal evolution during the
Pliocene–Pleistocene. Earth Planet. Sci. Lett 220: 3–24
de Vivo, M. (2008). Mamíferos e mudanças climáticas. In: Buckeridge MS
(ed) Biologia e Mudanças Climáticas no Brasil. São Carlos, Editora Rima, pp.
Driscoll CA, Menotti-Raymond M, Nelson G, Goldstein D, O’Brien SJ (2002) Genomic microsatellites as evolutionary chronometers: a test in wild cats.
Genome Res 12: 414–23
Dupont LM, Behling H, Kim J-H (2008) Thirty thousand years of vegetation
development and climate change in Angola (Ocean Drilling Program Site 1078).
Clim Past 4: 111–147
Durant SM, Craft ME, Hilborn R, Bashir S, Hando J, Thomas L (2011) Long-term
trends in carnivore abundance using distance sampling in Serengeti National
Park, Tanzania. J Appl Ecolo 48: 1490–1500
Durant S, Marker L, Purchase N, Belbachir F, Hunter L, Packer C,
Breitenmoser-Wursten C, Sogbohossou E, Bauer H (2008) Acinonyx jubatus.
In: IUCN 2012. IUCN Red List of Threatened Species. Version 2012.2.
<www.iucnredlist.org>. Downloaded on 10 March 2012
Eizirik E, Indrusiak CB, Johnson WE (2002) Jaguar population viability analysis:
Evaluation of parameters and case-studies in three remnant populations of
southern South America. In: Medellín AR, Chetkiewicz C, Rabinowitz A, Redford
KH, Robinson JG, Sanderson E, Taber A (eds). Jaguars in the new millenium: a
status assessment, priority detection, and recommendations for the
conservation of jaguars in the Americas. Universidad Nacional Autonoma de
Mexico, Mexio and Wildlife Conservation Society, USA, pp 1–20
Estoup A, Lombaert E, Marin J, Guillemaud T, Robert CP, Cornuet J, Antipolis DN,
Bayesian Computation using linear discriminant analysis on summary statistics.
Mol Ecol Resour 12: 846–855
Excoffier L, Estoup A, Cornuet J (2005) Bayesian Analysis of an Admixture Model
with Mutations and Arbitrarily Linked Markers. Genetics 1738: 1727–1738
Frankham R (1995) Effective population size/ adult population size ratios in wildlife.
Genet Res 66: 95-107
Faith JT (2012) Palaeozoological insights into management options for a threatened
mammal: southern Africa’s Cape mountain zebra (Equus zebra zebra). Divers
Distrib18: 438–447
Feankins s, DeMenocal P (2008) Global and African Regional Climate during the
Cenozoic. In Werdelin L, Sanders W (eds) Cenozoic Mammals in Africa.
University California Press, USA, pp 45–56
Fraser CI, Nikula R, Ruzzante DE, Waters JM (2012) Poleward bound: biological
impacts of Southern Hemisphere glaciation. TREE 27: 462–71
Gese EM (2001) Monitoring of terrestrial carnivore populations. In: Gittleman JL,
Funk SM, MacDonald DW (eds) Carnivore Conservation. Cambridge University
Press, UK, pp 372 - 396
Gilpin M (1991) The genetic effective size. Biol J Linn Soc 42: 165–175
Gopalaswamy AM, Royle JA, Hines JE, Jathanna D, Kumar NS, Karanth KU (2012)
spatially-explicit capture recatpure models. Package “ SPACECAP ”. Retrieved from
http://cran.r-project.org/web/packages/SPACECAP/index.html
Gottelli D, Wang J, Bashir S, Durant SM (2007) Genetic analysis reveals promiscuity
among female cheetahs. Proc R Soc B 274: 1993–2001
Hanssen L, Stander P (2004) Namibia large carnivore atlas. Predator Conservation
Trust, Windhoek. Windhoek, Namibia, pp 1–12
Hare MP, Nunney L, Schwartz MK, Ruzzante DE, Burford M, Waples RS, Ruegg K,
Palstra F (2011) Understanding and Estimating Effective Population Size for
Practical Application in Marine Species Management. Conserv Biol 1–12 doi:10.1111/j.1523-1739.2010.01637.x
Hedrick PW (1996) Bottleneck (s) in Cheetahs or Metapopulation. Conserv Biol 10:
897–899
Hewitt G (2000) The genetic legacy of the Quaternary ice ages. Nature 405:907–13
Hewitt G (2004) Genetic consequences of climatic oscillations in the Quaternary. Phil
Trans R Soc B 359: 183–195
Hoelzmann P, Jolly D, Harrison SP, Laarif F, Bonnefille R (1998) Mid-Holocene
land-surface conditions in northern Africa and theArabian peninsula : A data set for
the analysis of biogeophysical feedbacks in the climate system. Global
Biogeochemical Cycles 12: 35–51
Holt RD (1990) The microevolutionary consequences of climate change. TREE 5:
Johnston AR, Anthony NM (2012) A multi-locus species phylogeny of African forest
duikers in the subfamily Cephalophinae: evidence for a recent radiation in the
Pleistocene. J Evolution Biol doi:10.1186/1471-2148-12-120
Jolly D, Taylor D, Marchant R, Hamilton A, Bonnefille R, Buchet G, Riollet G (1997)
Vegetation dynamics in central Africa since 18,000 yr BP : pollen records from
the interlacustrine highlands of Burundi , Rwanda and western Uganda. J
Biogeogr24: 495–512
Kelly MJ (2001) Lineage Loss in Serengeti Cheetahs: Consequences of High
Reproductive Variance and Heritability of Fitness on Effective Population Size.
Conserv Biol 15: 137–147
Kharouba HM, Mccune JL, Thuiller W, Huntley B (2012) Do ecological differences
between taxonomic groups influence the relationship between species ’
distributions and climate? A global meta-analysis using species distribution
models. Ecography 35: 1–8 doi:10.1111/j.1600-0587.2012.07683.x
Lee AM, Engen S, Sæther B (2011) The influence of persistent individual differences
and age at maturity on effective population size Subject collections: Proc R Soc
B doi:10.1098/rspb.2011.0283
Lopes JS, Beaumont MA (2010) ABC: a useful Bayesian tool for the analysis of
population data. Infect Genet Evol 10: 826–833
LorenzenED, Heller R, Siegismund HR (2012) Comparative phylogeography of
Lorenzen ED, Nogués-Bravo D, Orlando L, Weinstock J, Binladen J, Marske KA,
Ugan A, et al (2011) Species-specific responses of Late Quaternary megafauna
to climate and humans. Nature 479: 359–64
Lucherini M, Merino MJ (2008) Perceptions of Human–Carnivore Conflicts in the High Andes of Argentina. Mt Res Dev 28: 81–85. doi:10.1659/mrd.0903
Marker LL (1998) Current Status of the cheetah (Acinonyx jubatus). Proceedig of a
Symposium on Cheetahs as Game Ranch Animals. South Africa, pp 1 – 17
Marker-Kraus L, Kraus D, Barnett D. Hurlbut S (1996) Cheetah survival on Namibian farmlands. Cheetah Conservation Fund, Windhoek.
Marker LL, DickmanAJ, Mills MGL, Macdonald DW (2010) Cheetahs and ranchers in
Namibia : a case study. In: MacDonald D, Loveridge A (eds) Biology and Conservation of Wild Felids. Oxford University Press, UK, pp 353 – 372
Marker LL, Dickman AJ, Wilkinson C, Schumann B, Fabiano E (2007) The Namibian
Cheetah : Status Report. Cat News, Special Issue 3: 4–13
Marker LL, Wilkerson AJP, Sarno RJ, Marteson J, Breitenmoser-Würsten C, O’Brien
SJ, Johnson WE (2008) Molecular Genetic Insights on Cheetah (Acinonyx
jubatus) Ecology and Conservation in Namibia. J Hered 99: 2–13
Maslin MA, Pancost RD, Wilson KE, Lewis J, Trauth MH (2012) Three and half
million year history of moisture availability of South West Africa : Evidence from
ODP site 1085 biomarker records. Palaeogeogr Palaeoclimatol Palaeoecol
Menotti-Raymond MA, O’Brien SJ (1994) Evolutionary conservation of ten microsatellite loci in four species of Felidae. J Hered 86: 319–22
Miller PS, Lacy RC (2005) VORTEX A stochastic simulation of the extinction process
V 9.50. Apple Valley: Conservation Breeding Specialist Group (SSC/IUCN)
Nowell K (1996) Namibian Cheetah Conservation Strategy. Windhoek, Namibia, pp1
–41O’Brien SJ, Roelke ME, Marker LL, Newman A, Winkler CA, Meltzer D,
Colly L, Evermann JF, Bush M, Wildt, DE (1985). Genetic basis for species
vulnerability in the cheetah. Science 227: 1428–34O’Brien SJ, Wildt DE, Bush M, Caro TM, FitzGibbon C, Aggundey I, Leakey RE (1987) East African
cheetahs: evidence for two population bottlenecks? PNAS 84: 508–11
Osmers B, Petersen B, Hartl GB, Grobler JP, Kotze A, Aswegen E Van, Zachos FE
(2012) Genetic analysis of southern African gemsbok (Oryx gazella) reveals
high variability, distinct lineages and strong divergence from the East African
Oryx beisa. Mamm Biol 77: 60–66
Palstra FP, Fraser DJ (2012) Effective/census population size ratio estimation: a
compendium and appraisal. Ecology and Evolution 2: 2357–65 doi:10.1002/ece3.329
Palstra FP, Ruzzante DE (2008) Genetic estimates of contemporary effective
population size : what can they tell us about the importance of genetic
stochasticity for wild population persistence? Mol Ecol 17: 3428–3447
Pearse DE, Anderson EC (2009) Multiple paternity increases effective population
Phillips CD, Hoffman JI, George JC, Suydam RS, Huebinger RM, Patton JC,
Bickham JW (2012) Molecular insights into the historic demography of bowhead
whales: understanding the evolutionary basis of contemporary management
practices. Ecology and Evolution 3: 18–37 Pimm SL, Gittleman JL, McCracken GF, Gilpin M (1989) Plausible alternatives to bottlenecks to explain reduced
genetic diversity. TREE 4: 176 – 178
Ray JC, Hunter L, Zigouris J (2005) Setting conservation and research priorities for
larger African carnivores setting conservation for larger African. WCS Working
Paper No. 24. Wildlife Conservation Society, New York, pp 1 - 201
Reed KE (1997) Early hominid evolution and ecological. J Hum Evol 32: 289 – 322
Reynolds SC (2007) Mammalian body size changes and Plio-Pleistocene
environmental shifts: implications for understanding hominin evolution in eastern
and southern Africa. J Hum Evol 53, 528–48
Rohland N, Pollack JL, Nagel D, Beauval C, Airvaux J, Pääbo S, Hofreiter M (2005)
The population history of extant and extinct hyenas. Mol Biol Evol 22: 2435–43
Royle JA, Karanth KU, Gopalaswamy AM, Kumar NS (2009) Bayesian inference in
camera trapping studies for a class of spatial capture-recapture models. Ecology
90: 3233–44
Saether BE, Engen S, Solberg EJ (2009) Effective size of harvested ungulate
populations. Anim Conserv 12: 488–495
Ségalen L, Lee-Thorp JA, Cerling T (2007) Timing of C4 grass expansion across
Stokes S, Thomas DSG, Washington R (1997) Multiple episodes of aridity in
southern Africa since the last interglacial period. Nature 388: 2–6
Storz JF, Ramakrishnan U Alberts SC (2001) Determinants of Effective Population
Size for Loci with Different Modes of Inheritance. J Hered 92: 497–502.
Storz JF, Beaumont MA, Alberts SC (2002) Genetic evidence for long-term
population decline in a savannah-dwelling primate: inferences from a
hierarchical bayesian model. Mol Biol Evol 19: 1981–90
Tallmon DA, Koyuk A, Luikart G, Beaumont MA (2008) ONeSAMP : a program to
estimate effective population size using approximate Bayesian computation. Mol
Ecol Resour 8: 299–301
Teske P, Heyden S von der, McQuaid CD, Barker NP (2011) A review of marine
phylogeography in southern Africa Coastal phylogeography. S Afr J Sci 107: 1–
11
Thomas D, Brook G, Shaw P, Bateman M, Haberyan K, Appleton C, Nash D,
McLaren S, Davies F (2003) Late Pleistocene wetting and drying in the NW
Kalahari: an integrated study from the Tsodilo Hills, Botswana. Quatern Int 104:
53 – 67
Tomas WM, Miranda GHB (2003) Uso de armadilhas fotográficas em levantamentos
populacionais. In: Cullen L Jr; Rudran R, Valladares-Padua C (eds) Métodos de
estudo em biologia da conservação e manejo da vida silvestre. Curitiba, Editora
Turchetto-Zolet AC,, Pinheiro F, Salgueiro F, Palma-Silva C (2012)
Phylogeographical patterns shed light on evolutionary process in South
America. Mol Ecol doi:10.1111/mec.12164
Vasemägi A, Palstra FP, Ruzzante DE (2010) A temporal perspective on population
structure and gene flow in Atlantic salmon (Salmo salar) in Newfoundland,
Canada. Can J Fish Aquat Sci 67: 225–242
Vrba ES (1995) The fossil record of African antelopes (Mammalia, Bovidae) in
relation to human evolution and paleoclimate. In Vrba ES, Denton GH,
Partridge TC, Burckle LH (eds) Paleoclimate and evolution, with emphasis on
human origins. Yale University Press, New Haven, CT, pp 385–424
Vucetich JA Waite TA (1998) Number Estimation of Censuses of Required for
Demographic Effective Population Size. Conserv Biol 12: 1023–1030
Waples RS (2006) A bias correction for estimates of effective population size based
on linkage disequilibrium at unlinked gene loci. Conserv Gen 7: 167–184
Waples RS Do C (2010) Linkage disequilibrium estimates of contemporary Ne using
highly variable genetic markers: a largely untapped resource for applied
conservation and evolution. Evolutionary Applications 3: 244–262
Weir JT Schluter D (2007) The latitudinal gradient in recent speciation and extinction
rates of birds and mammals. Science 315: 1574–6
Weldeab S, Stuut JW, Schneider RR, Siebel W (2012) Holocene climate variability in
Inferring the historical demography of the Namibian cheetah population using Bayesian analysis of microsatellite data
Authors:
Mr. Ezequiel Chimbioputo Fabiano, a, b
Dr. Sandro Luis Bonatto, PhD, a
Dr. Anne Schmidt-Küntzel, PhD, DMV, b, c
Dr. Laurie L. Marker, PhD, b
Prof. Eduardo Eizirik, PhD, a
Email addresses:
ezequiel.fabiano@pucrs.br, fabianoezekiel@gmail.com
slbonatt@pucrs.br
genetics@cheetah.org
cheetah@iway.na
eduardo.eizirik@pucrs.br
Affiliations:
a. Laboratório de Biologia Genômica e Molecular, Faculdade de Biociências,
Pontifícia Universidade Católica do Rio Grande do Sul, Porto Alegre, RS 90619-900,
b. Cheetah Conservation Fund, PO Box 1755, Otjiwarongo, Namibia.
c. Life Technologies Conservation Genetics Laboratory, Cheetah Conservation
Fund, PO Box 1755, Otjiwarongo, Namibia.
Corresponding author:
Mr. Ezequiel Chimbioputo Fabiano, Laboratório de Biologia Genômica e Molecular,
Faculdade de Biociências, Pontifícia Universidade Católica do Rio Grande do Sul,
Porto Alegre, RS 90619-900, Brazil; Cheetah Conservation Fund, Otjiwarongo,
Namibia.
Email: ezequiel.fabiano@pucrs.br
Prof. Eduardo Eizirik, Laboratório de Biologia Genômica e Molecular, Faculdade de
Biociências, Pontifícia Universidade Católica do Rio Grande do Sul, Porto Alegre,
RS 90619-900, Brazil
Abstract
The contemporary genetic diversity of the cheetah (Acinonyx jubatus) has been the
focus of several studies over the last 25 years, most of which have revealed low
levels of variation at genomic and mitochondrial markers. Such low variation has
been suggested to derive from two historical genetic bottlenecks, a severe one at the
end of the Last Glacial Maximum (LGM) and a more recent one in the past
millennium, with a possible expansion during the mid-Holocene (~ 5000 years ago
[ya]). Here, we used approximate Bayesian computation (ABC) methods with
temporal stratification to explore the historical demography of the largest
free-ranging cheetah population for the past 60,000 years. Results indicate that the
population has been declining gradually, interrupted by periods of stability. The
timing of the declines coincides with climatic events including over the last 3,500 -
300 ya, throughout the Holocene (~8,000 – 3,500 ya) and the late end of the LGM and early half of the Holocene (~14,400 to 8,000 ya). Prior to 21,000 ya the
population appears to have been stable. These results demonstrate the impact of
slow contractions likely induced by the direct and indirect effects of climatic
oscillations in this population genetic diversity. This phenomenon is also relevant to
Introduction
Throughout the Quaternary period (which began 2.5 million years ago [Mya]), the
climate was highly heterogeneous in Africa, with western and eastern Africa’s
climate being more unstable than that of southern Africa [1, 2]. Despite southern
Africa’s relative climatic stability over the past 3.5 million years [3], notable
oscillations have been reported [4]. The climate in this region oscillated between wet
and dry periods [5], accompanied by changes on species-specific habitat suitability
[1, 2, 6-8]. This heterogeneity in climate has affected the contemporary genetic
diversity of many species, with comparative phylogeography across taxa indicating
southern Africa as a refugium from which populations recolonized more northerly
regions [9-11]. Since responses can be species- or population-specific [12],
reconstructing comparative historical patterns requires in-depth studies of many
taxa.
One species that seems to have a particularly interesting demographic history
is the cheetah (Acinonyx jubatus), for which several population genetic studies have
revealed remarkably low levels of genetic diversity [13,14]. Namibia has the largest
cheetah population, estimated at 2500 adult individuals [15] or a total census
population size of 3100 to 5800 individuals [16]. Botswana and South Africa in
southern Africa and Kenya and Tanzania in East Africa population sizes range
between 500 to 1500 individuals [15]. The remaining 18 population estimates are
bbelow 500 individuals [17] and are considered non-viable [18]. Records indicate
that the Namibian population has declined over the last century due to various
factors, including droughts, reduction in prey availability, habitat loss and
degradation, as well as trophy hunting and human-wildlife conflict [19-21]. However,
While it is widely recognized that the origin of the cheetah’s relatively low
extant genetic diversity is the result of events pre-dating modern civilization, possibly
in combination with human-related factors, the exact mechanism that led to this
observed pattern is unknown. Three hypotheses corresponding to different patterns
of reduction in population size have so far been proposed to account for the species’
low level of genetic variation. Early population genetic studies using a variety of
genetic markers (allozymes, MHC variation, mtDNA restriction fragment length
polymorphisms and microsatellites) and samples from the southern and eastern
African subspecies, A. j. jubatus and A.j. raineyi, respectively, revealed high levels of
homogeneity [13, 14, 22 -24]. These studies proposed that the low diversity was
likely a consequence of a severe bottleneck at the end of the Pleistocene (12,000 -
10,000 years ago [ya]), followed by an expansion ca. 5,000 ya and another decline
within the past century. Two alternative hypotheses were subsequently proposed for
the genetic uniformity. First, that the species persisted at low effective population
size (Ne) induced by the high reproductive variance observed in species with a
polygynous mating system [25]. Second, that populations were subjected to a
continuous cycle of extinction of subpopulations followed by re-colonization of the
areas,following metapopulation dynamics [25-27]. While additional investigation is
required to resolve the debate, all three hypotheses are to some extent
non-exclusive, and imply an environmentally driven model [28], which postulates
environmental factors as drivers of evolution. This model has been supported in a
number of species worldwide [4,6], as well as more specifically in Africa and
southern Africa [29–31].
Since the publication of the classical studies on cheetah genetics, and in
computational methods for exploring the historical demography of any organism
using empirically collected molecular data. Of particular interest is the application of
Approximate Bayesian Computation (ABC) approaches to population genetics
[32,33]. These methods have now been widely used to investigate the demographic
history of many different species, allowing the statistical comparison of contrasting
models of past population changes[e.g. 34–37].
Here we explored the demographic history of the Namibian cheetah
population using ABC methods, based on a previously published microsatellite data
set [37]. This population was considered appropriate for the study due to the
availability of a suitable genetic data set, the population having a large census size
[17] and being panmictic [37]. The latter is crucial, as it reduces the risk of false
signals of bottleneck caused by sub-structuring [38,39] while large sizes reduce the
likelihood of the population having experienced high genetic drift in the recent past
[40]. We specifically assessed whether the population has remained stable, declined
(gradually or severely) or expanded over different historical periods encompassing
subspecies divergence times and major climatic events (< 60,000 ya). This study is
timely, as a better understanding of this population’s demographic history is vital for
the development of effective conservation measures on its behalf.
Material and Methods
Data collection
To investigate the demographic history of Namibian cheetahs, we used a previously
microsatellite loci [37]. This particular subset of the original data was composed only
of unrelated cheetahs, determined based on behavioural data, parentage analyses
and confirmed with estimates of genetic relatedness. For a full description of data
collection, see [37].
Past demographic analysis
We used the coalescence-based approach implemented in the program
DIYABC-FDA (hereafter DIYABC) [43-45]. This approach is based on the Wright-Fisher
model, and hence assumes that the study population approximates this model
[95,96].
DIYABC allows for the simulation, comparison and confidence assessment of
model choices considering more complex evolutionary scenarios [44]. It implements
a linear discriminant analysis (LDA) on summary statistics (Ss) prior to computing
posterior probabilities or evaluating confidence in scenario choice, as a means of
reducing computation time [44,45]. Ultimately, this gain in computation time allows
for additional simulations, thus partially overcoming a drawback concerning model
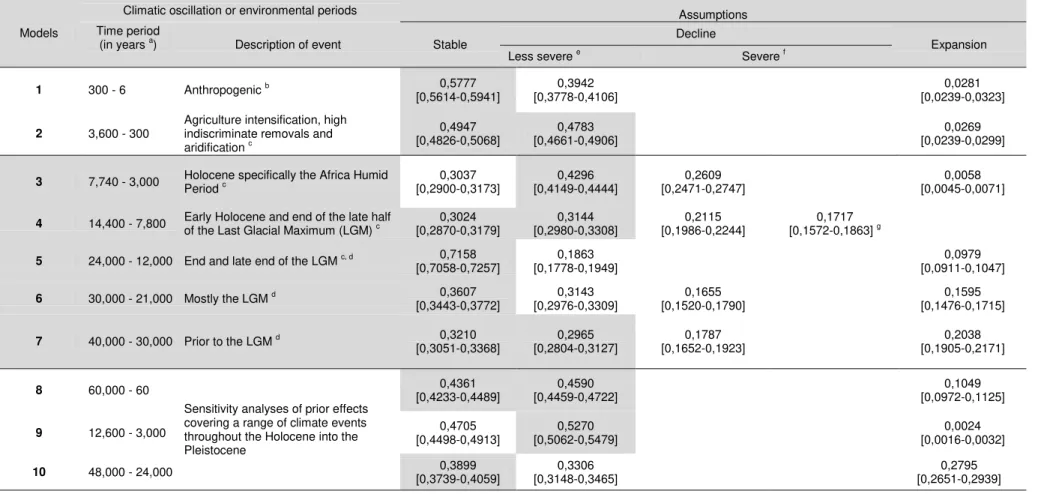
discrimination [50]. We assessed whether the population was stable, declined
(gradually or severely) or expanded over different timeframes that ranged from very
recent (120 to 6 ya) to ancestral (60,000 ya) times (Fig. 1, Table 1). The timeframes
were set so as to include subspecies divergence time estimates, climatic oscillations
and anthropogenic factors (Table S1). We grouped models into three main
categories, with each category corresponding to a discrete period (Table 1).
Category one encompassed recent (< 1,000 ya) and category 2 ancestral (> 1,000
ya) timeframes, while category 3 encompassed both, recent and ancestral
1,000 ya as linked to climatic oscillations, while more recent changes were attributed
to anthropogenic influences with (1,000 ya to 300 ya) or without (300 ya to present)
climatic factors. This temporal stratification allowed for an assessment at a finer
temporal resolution than DIYABC assuming Ne to be constant between time periods
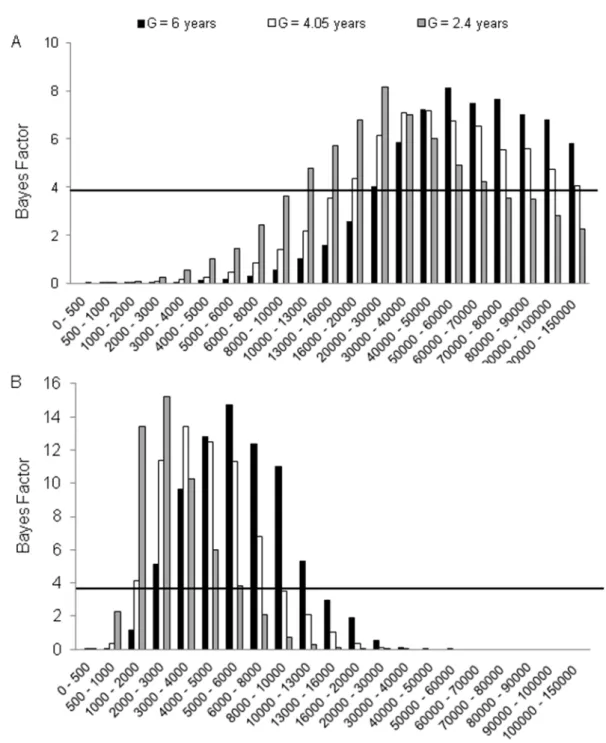
[44]. As part of category three we assessed robustness of model inference by
performing three additional runs whose times of decline encompassed most of the
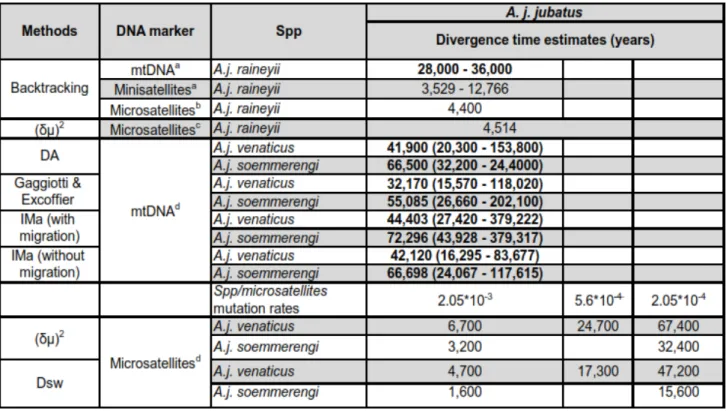
multiple fine-scale periods (i.e. models 8 - 10, Table 1). In order to convert time of change into years (T) and due to uncertainty in the cheetah’s mean generation time, we considered estimates of 2.4 years [46,47], 4.05 years (Fabiano et al. unpublished data [Chapter 3]) and 6 years [48]. The first value is based on long-term monitoring
data for females, the second derives from VORTEX simulations that incorporate life
history parameters and the third from data of captive animals at zoological
institutions.
Priors for ancestral effective population size (Nanc) were vague due to a lack of
records prior to the 1970's [19]. For the recent Ne (Nrec), we used "uninformative"
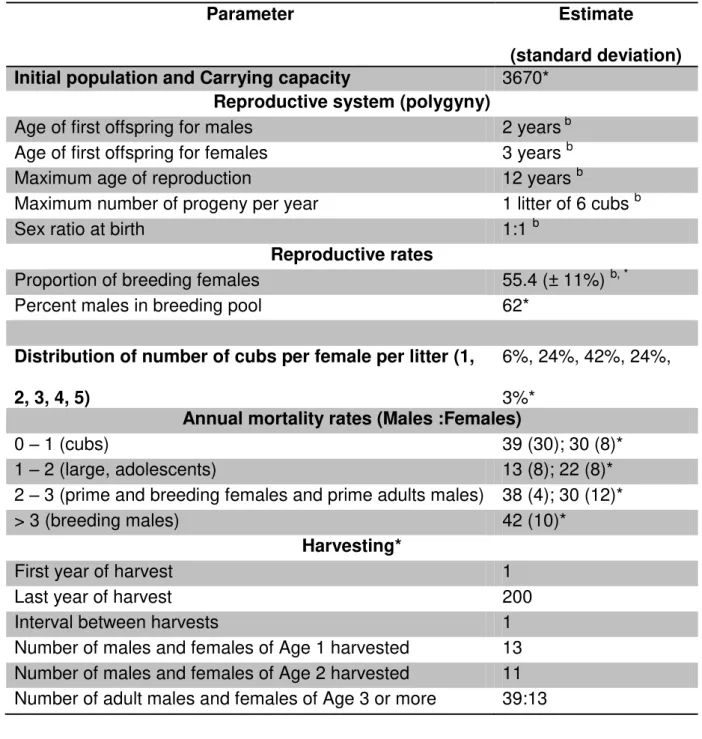
priors based on our parallel work (Chapter 3), and population size estimates of 2,500
adult individuals [17] or a total population size of 3,138 to 5,775 [37]. Hence, priors
for Nrec overlapped across scenarios (Table S2). As we were also interested in the
magnitude of the decline(s), we confined the upper and lower bound of the Nrec and
Nanc to differ by less than 5% (less severe) and at least by 50% (severe), respectively, for five scenarios (Table 1, S2). Demographic parameters were
sampled from a uniform distribution (U). Microsatellite loci were assumed to follow
the generalized stepwise mutation model, with mutational parameters kept at the
10-4, 2.05 X 10⁻⁴) [51]. We also assessed the impact of using a broader prior for the geometric distribution (P) U ~ [0.1 - 0.3] to U ~ [0.1 - 0.7] [52] with longer timeframe
periods (240,000 ya) on model selection (Table S3). This accounted for the
uncertainties in mutation rates of dinucleotide microsatellites in the context of model
selection [52,53].
Confidence on model choice: For each model, we performed 5 X 10⁵ simulations of which 1% were selected based on the closest Euclidean distance between their
Ss and the Ss derived from the actual data for model checking, comparison and
parameter estimation [43]. We used as Ss the mean number of alleles, genic
diversity, variance in allele size in base pairs and Garza-Williamson's MWG [44,45].
The posterior probabilities of different scenarios were then computed using a
polychotomous logistic regression based on (K- 1) discriminant variables determined
by applying a linear discriminating analysis on the Ss of the closest simulated data
sets [45]. As the K-1 discriminant variables maximize differences among scenarios,
they provided an assessment of model discrimination. In addition, following Cornuet
et al. (2008) [44], we computed type I and II errors based on 500 simulated data
sets, as a means of discriminating among scenarios. Specifically, we estimated type
I error as the number of instances a scenario used to generate the data did not
exhibit the highest posterior probability (HPP) among the competing scenarios, and
type II error (β) as the proportion of times when a scenario had the HPP when the data had actually been simulated under a competing scenario (i.e. statistical power =
1 - β). Additionally, we assessed the predictive power of different scenarios by conducting a principal component analysis (PCA) on Ss derived from 1000 records
data set fell within the simulated data set with initial priors [45]. The lack of low tail
probabilities was also used as evidence of model fit [44].
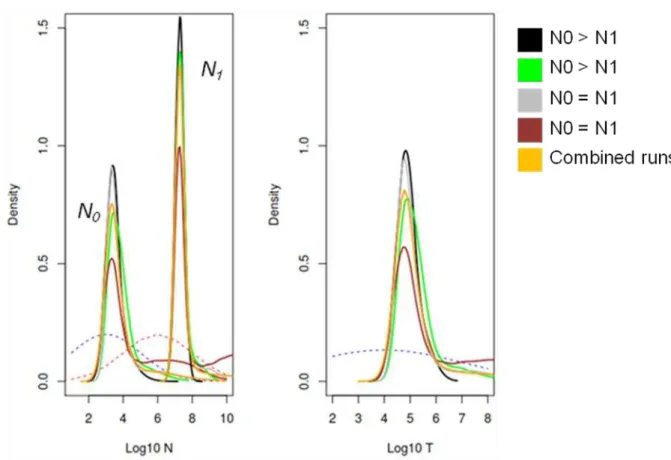
Parameter estimation: The closest data sets (1% of simulated data sets), were then used to calculate posterior probabilities of each scenario, upon which point estimates
with 95% HPD were determined using a logistic regression [44]. Point estimates
were present along the 95% HPD, with the relative mean square error (RRMSE),
bias and factor 2 used as measures of precision. Additionally, we report the posterior
distribution 50% and 95% coverage, and the mean integrated squared error
(RRMISE). The RRMISE was used as the optimizer criteria for parameter estimates
[54].
RESULTS
Single demographic changes
To assess whether and how the population size has changed over time, we
evaluated seven time periods for three to four scenarios each, assuming a single
demographic change (stable, gradual or severe declining, or expanding population)
(Table 1). The stable scenario unequivocally had the highest posterior probability
(HPP) in three timeframes, in three timeframes the stable and declining scenarios
were equally probable (their 95% HPP overlapped) and in one timeframe the
declining scenario had the HPP. In no instance did a scenario assuming an
expansion have a relative HPP, nor was it equally probable to another scenario
(Table 1). These findings suggest that, except, for a decline between 14,400 and 300
ya, and possibly between 40,000 and 30,000 ya, the population was more likely to
have been stable over most of the timeframes assessed. It is noteworthy that severe
(models 3, 4, 6, 7 in Table 1). Confidence in scenario choices was high, as statistical
power among the competing best scenarios was on average 80% (S2 Table 4).
Furthermore, none of the test statistics used to assess model misfit had a low tail
probability, suggesting that models did fit the data (i.e. probabilities were within 0,05
- 0,95 interval, S2 Table 5).
A congruent interpretation of the population history was also recovered based
on simulations characterized by broader priors for the time of change (models 8 - 10,
Table 1) (S2 Table 3, 4, 6). Under the broadest prior distribution that encompassed
all temporal periods (60,000 to 10 ya), the stable and decline scenarios were equally
probable (95% HPP range 0.4233 - 0.4722). A signal of decline was recovered with
model nine (T set to 12,000 to 3,000 ya) keeping largely in agreement with
conclusion of model three and a partly with models two and four (Table 1). Lastly,
under model 10, the stable scenario had the HPP in accord with models 7 and 8.
Scenarios with broader priors for P also supported possible declines around 3,000 to
300 ya and stability from 300 ya to the present (S2 Table 6). Hence, model inference
and result interpretations were largely robust to assumptions on the prior distribution
of time and P.
DISCUSSION
The study shows that the Namibian cheetah population appears to have had a
complex demographic history, as evidenced by support for periods of stability
intercepted by periods of decline. Based on results from a temporally stratified
approach encompassing the past 60,000 years, we failed to recover a signal of
expansion was detected prior to this period (> 180,000 ya) (data not shown),
Additionally, the study shows that declines appear to have been gradual rather than
drastic. Hence, the population’s low neutral genetic diversity seems to result from gradual and continuous decline over evolutionary timescales. The equal probability
of certain scenarios such as for declines around the period between 21,000 and
3,000 ya (Table 1) may indicate insufficient power in the data. Nevertheless,
simulations using different sampling strategies favouring population expansion and
stability using MSVAR1.3 indicated no impact of prior on posterior distributions (S1,
S2 Table 7). Furthermore, results based on broader priors for time of change and
mutation rate parameters, yielded congruent findings. Overall, based on this study
design our results appear to be robust, in support of a gradual decline rather than a
severe bottleneck and highlights the importance of temporal stratification for better
appreciation of demographic evolution.
The study’s primary aim was to contrast evolutionary scenarios that span different periods of environmental change, so as to assess the evolutionary trajectory
of the population. Our findings support the hypothesis that the population’s
contemporary genetic diversity, and possibly that for all of southern Africa (given
ongoing gene flow in the region [15]), is the result of multiple gradual reductions
interrupted by periods of stability. This conclusion is supported by a number of
reasons, including signals for declines that were retrieved for several timeframes,
including during the past 3,600 to 300 ya and parts of the late end of the LGM,
throughout the Holocene (14,400 - 3,600 ya). Likewise, we recovered signals for
periods of stability during the past 300 years and between 30,000 and 21,000 ya