Adaptation, and Induces Age-Related Alterations
Karim Chekroud1, Laurent Guillou1, Stephane Gre´goire2, Gilles Ducharme3, Emilie Brun1,
Chantal Cazevieille4, Lionel Bretillon2, Christian P. Hamel1, Philippe Brabet1*., Marie O. Pequignot1 *. 1Inserm U1051, Institute for Neurosciences of Montpellier, CHU St Eloi, Montpellier, France,2INRA, Eye and Nutrition Research Group, Dijon, France,3CNRS UMR5149, Institut de Mathe´matiques et de Mode´lisation de Montpellier, France,4CRIC/IURC 641, Montpellier, France
Abstract
FATP1 is involved in lipid transport into cells and in intracellular lipid metabolism. We showed previously that this protein interacts with and inhibits the limiting-step isomerase of the visual cycle RPE65. Here, we aimed to analyze the effect of
Fatp1-deficiencyin vivoon the visual cycle, structure and function, and on retinal aging. Among theFatpfamily members, we observed that onlyFatp1and 4are expressed in the control retina, in both the neuroretina and the retinal pigment epithelium. In the neuroretina,Fatp1is mostly expressed in photoreceptors. In young adultFatp12/2mice,Fatp4expression was unchanged in retinal pigment epithelium and reduced two-fold in the neuroretina as compared toFatp1+/+mice. The
Fatp12/2 mice had a preserved retinal structure but a decreased electroretinogram response to light. These mice also displayed a delayed recovery of the b-wave amplitude after bleaching, however, visual cycle speed was unchanged, and both retinal pigment epithelium and photoreceptors presented the same fatty acid pattern compared to controls. In 2 year-old Fatp12/2 mice, transmission electron microscopy studies showed specific abnormalities in the retinas comprising choroid vascularization anomalies and thickening of the Bruch membrane with material deposits, and sometimes local disorganization of the photoreceptor outer segments. These anomalies lead us to speculate that the absence ofFATP1
accelerates the aging process.
Citation:Chekroud K, Guillou L, Gre´goire S, Ducharme G, Brun E, et al. (2012) Fatp1 Deficiency Affects Retinal Light Response and Dark Adaptation, and Induces Age-Related Alterations. PLoS ONE 7(11): e50231. doi:10.1371/journal.pone.0050231
Editor:Jing Chen, Children’s Hospital Boston, United States of America
ReceivedMarch 15, 2012;AcceptedOctober 19, 2012;PublishedNovember 16, 2012
Copyright:ß2012 Chekroud et al. This is an open-access article distributed under the terms of the Creative Commons Attribution License, which permits unrestricted use, distribution, and reproduction in any medium, provided the original author and source are credited.
Funding:This work was supported by private foundations (Fe´de´ration des Aveugles et Handicape´s Visuels de France, IRRP, UNADEV, SOS Re´tinite), University of Montpellier (UM1 and UM2), the Re´gion Languedoc Roussillon, the French Ministry for National Education and Inserm. The funders had no role in study design, data collection and analysis, decision to publish, or preparation of the manuscript.
Competing Interests:The authors have declared that no competing interests exist.
* E-mail: [email protected] (MOP); [email protected] (PB)
.These authors contributed equally to this work.
Introduction
In mammals, the cone and rod photoreceptors (PRs) are responsible for the transformation of light into an electrical signal that is transmitted to the brain. Adjacent to the PRs is the retinal pigment epithelium (RPE), which is essential for nutrition and detoxification of the PR among many other functions [1]. These two tissues are interdependent for their survival and the degeneration of one causes the degeneration of the other, leading to various forms of pigmentary retinopathies and often blindness [1,2,3]. PRs comprise a cellular extension called an outer segment containing the visual pigment in membranous disks. These disks are renewed in a cyclical way from the base while the RPE phagocytes the oldest apical disks. If the phagocytosis process is blocked, membranous debris accumulate and PRs degenerate [4]. Due to the permanent renewal of their disks, PRs need a high supply in fatty acids, in particular in docosahexaenoic acid (DHA, 22:6n-3), and are mainly dependent on the RPE for this supply [5]. In the rod PRs, the visual pigment rhodopsin is comprised of a protein, opsin, attached to a chromophore, 11-cisretinal. When rhodopsin is activated by photon absorption, the retinal molecule is isomerized into all-transretinal and secondarily detached from the protein. The retinoid is then exported toward the RPE. There,
a lecithin-retinol-acyl transferase (LRAT) esterifies the retinoid into all-trans retinyl ester by addition of a long chain fatty acid (often a palmitate). The resulting retinyl ester is the substrate of RPE65, the RPE isomerase that frees the fatty acid and transforms the retinoid back into 11-cisretinol. After oxidation, the formed 11-cis retinal is transported back to the PRs to form fresh rhodopsin. This metabolism is called the visual cycle, and many actors participate in this process of which the rate-limiting step is the isomerization catalyzed by RPE65 [1,6,7]. Mutations in many of the genes encoding visual cycle proteins alter the visual process, leading to various forms of retinal degenerations or stationary disorders [8,9,10]. In addition, the visual cycle generates retinoid by-products such asN-retinylidene-N-retinylethanolamine (A2E), which interfere with the normal function, in particular lysosomal function, of the RPE. With age, this can lead to the accumulation of lipofuscin, composed of residues generated by incomplete lysosomal digestion in the RPE, which leads to retinal degener-ation.
chain fatty acids. Systemically, FATP1 is expressed in white adipose tissue, skeletal muscle, heart, brain and skin [11]. FATP1 prevents fatty acid efflux from the cell and as a consequence promotes further transport into the cell. In the retina, the protein is expressed in both RPE and neuroretina (NR) [12]. Our previous studies showed that,in vitro, the interaction between FATP1 and RPE65 and LRAT inhibits 11-cis retinol. In vivo, this inhibitory mechanism could be exploited to regulate the visual cycle, with an increase in FATP1 activity being used to slow the cycle down. This property may decrease the A2E visual cycle byproduct that abnormally accumulates in certain retinal diseases.
In this study, we usedFatp1-deficient mice to test the role of the protein in the visual cycle and on visual function. We found that PR of youngFatp12/2 mice had a weaker response to light and that recovery of the visual sensitivity after bleaching was slightly delayed. A thorough analysis of the Fatp12/2 mouse phenotype also showed that old mice had PR outer segment disorganization, irregular Bruch membrane (BM) and abnormal choroid vascular-ization. These observations suggest that Fatp1 deficiency could induce an accelerated aging of the retina.
Materials and Methods
Mice
All animals were handled in strict accordance with the ARVO Statement for the Use of Animals in Ophthalmic Research and with EU directives. Approval from an Ethical Committee is not obligatory in France until 2013. The animal house and the project head must have a permit from the "Direction De´partementale des Services Ve´te´rinaires" and all persons handling the mice must be specifically trained. In this work, all protocols were performed under the personal permit number 34–331 (MOP) and the animal house permit number B34–17236. Moreover, all efforts have been
made to avoid suffering. Fatp1+/2 mice, generated on a mixed C57BL/6J x 129SvEv genetic background, were kindly provided by Andreas Stahl (Berkeley, California, USA). These mice carried a leucine residue at aa position 450 in Rpe65. They were bred (heterozygous x heterozygous) in the INM animal house in clear plastic cages, subjected to standard light cycles (12 h to 90 lux light, 12 h dark) and were fedad libitum with a standard rodent diet. The genotyping was conducted as previously described [13].
Quantitative PCR (qPCR) assay
Five mo-old Fatp1+/+and Fatp12/2 mice were euthanised by
cervical dislocation, the eyes were enucleated and dissected between 9 and 11 a.m. The NR was separated from the RPE-choroid, and then the RPE-choroid was scraped off from the sclera. We chose to scrape off both tissues rather than to enzymatically separate the RPE alone, to minimize the time and the manipulation between the death of the mice and the removal of the tissue. To obtain sufficient quantities of RNA, the tissues from all mice were pooled for each tissue type and total RNA was isolated by the RNeasy mini kit (Qiagen) according to the manufacturer’s protocol. Equivalent amounts of total RNA were used for first strand cDNA synthesis using the Verso(TM) cDNA Kit (ThermoScientific). qPCR was performed using Light Cycler FastStart DNA MasterPLUS SYBR Green I kit (Roche). Amplifications from NR were normalized to actin levels, and those from RPE-choroid were normalized to the RPE-specific geneMertk, in order to avoid an incorrect estimation due to the presence of choroid RNA. Primers used for amplification are summarized in Table 1.
Histology
All animals were sacrificed by vertebral dislocation. Eyes were rapidly enucleated and fixed in 4% PFA, 24 h at 4uC. Eye cups were i) embedded in paraffin and cut into 5mm sagittal sections, ii) embedded in 5% agarose and cut into 50mm sagittal sections, or
iii) soaked in 40% sucrose, embedded in freezing medium (OCT) and cut into 10mm sagittal sections. For HES coloration, sections were deparaffined, labeled with hematoxilin/eosin/safran, rinsed and mounted in Moeviol. For betagalactosidase staining, agarose sections were transferred into the freshly prepared staining solution (200 mM MgCl2, 500 mM K4Fe(CN)6, 500 mM K3Fe(CN)6, 4% X-gal, 2% NP-40, in 1X PBS), kept in the dark and incubated at 30uC for 1 hour. Staining was stopped by several washing in PBS. Oil red O coloration was performed as previously described [14]. Eye sections with demonstrated lipid accumulation were used as positive controls and kindly provided by Alexandra Provost (CERTO, Paris, France) [14].
Transmission electron microscopy (TEM)
Eyes were rapidly enucleated and the corneas were removed prior to immersion in a solution of 3.5% glutaraldehyde in Sorensen’s buffer (0.1 M, pH 7.4) overnight at 4uC. The tissues were then rinsed in Sorensen’s buffer and post-fixed in a 1% osmic acid for 2 h in the dark at room temperature. After two rinses, the tissues were dehydrated in a graded series of ethanol solutions (30– 100%) and embedded in EmBed 812 using an Automated Microwave Tissue Processor for Electronic Microscopy, Leica EM AMW. All samples were processed the same way: a part of the eye was cut in a triangle with its summit at the optic nerve and the base at the periphery. Cutting was always initiated from the summit. The sections observed were thus all near the optic nerve. Sections (60 nm thickness; Leica-Reichert Ultracut E) were counterstained with uranyl acetate and observed using a Hitachi 7100 TEM (Centre de Ressources en Imagerie Cellulaire de
Table 1.Sequences of the qPCR primers.
Gene Primer sequence
Fatp1 F
R
59-AGGTCAATGAGGACACGATGGAG-39
59-CTGGTACATTGAGTTAGGGTCCAAC-39
Fatp2 F
R
59-GCCAAGTCTCTGCTGCACTGC-39
59-CTTCAGACCTCCACGACTCCG-39
Fatp3 F
R
59-CCAGAACATAGAGTGGGTCAGACA-39
59-CTTCACTTCCACGATCGTACTGG-39
Fatp4 F
R
59-CTGAAGCTGCCCTGGACCCA-39
59-AGGGCATCCCGCCTAAGGTTG-39
Fatp5 F
R
59-CAAGTTGGGCTGCCCTGTGGC-39
59-GCCCTATCGTATGGTACAGAGG-39
Fatp6 F
R
59-CCAACCTTCGCTTCGATTCCCT-39
59-CATCAGAGGCGAGACTCAGCTT-39
Rpe65 F
R
59-GTGCCACTGCTCATCCACATATTG-39
59-TGCAGGGGAACTGCACAACAACT-39
Rhodopsin F
R
59-CGCTTCGGGGAGAATCA-39
59-GTAGGGAAGCCAGCAGAT-39
Lrat F
R
59-GAGCAGCAGTTGGGACTGACT-39
59-TCCCAAGACAGCCGAAGCAAGA-39
Rdh5 F
R
59-TCACCAGTGTCTTGGGCCGCA-39
59-AGGTTGGTCACAGGGGTTCGAA-39
Mertk F
R
59-CAGTTTTATCCTGATGAGGAAGG-39
59-GAAGGCTGTGTTTCTGGTGAC-39
Actin F
R
59-CTGGGC CTC GTC ACC CAC ATA-39
59-GACCCAGATCATGTTTGAGACCTT-39
Montpellier, France). This study was not quantitative as we observed few sections from one part of each eye. However, we evaluated the thickness of the Bruch’s membrane by measuring both the thickest and the thinnest parts in 6 fields throughout the retinal section. We then calculated the median value for each eye.
Electrophysiology
All electrophysiological examinations were conducted using the Visiosystem (SIEM, France). Animals were prepared and
electro-retinograms (ERGs) were performed with cotton electrodes as previously described [15]. For adaptation-ERG, the mice were subjected to seven repetitions of a 1.59 cd.s21.m22blue flash, the seven b-wave amplitudes were averaged and considered as dark-adapted control. The mice were then bleached 2 min at 300 lux, placed again in the dark and subjected to the same series of flashes to verify the abolition of the b-wave. This series of flashes was repeated every 4 min from 0 to 32 min, to observe the recovery of the b-wave.
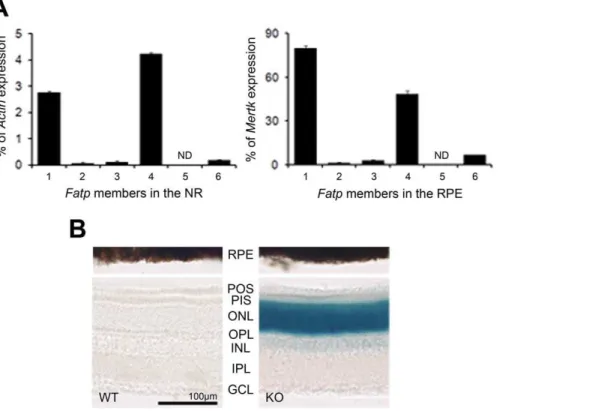
Figure 1. Expression of the Fatp family in the retina.A. Expression of theFatpfamily inFatp1+/+
neuroretina (NR) and retinal pigment epithelium (RPE). OnlyFatp1andFatp4were expressed in both tissues.Fatp4predominated in the NR andFatp1in the RPE. ND: not detected. Results are expressed as a percentage ofActinmRNA expression for NR and as a percentage ofMertkmRNA expression for RPE. mRNA was extracted from tissue pools of 12 mice aged 5 months. Bars represent the mean of triplicates6SEM. B.Fatp1expression pattern using the LacZ cassette of the
Fatp12/2mouse. beta-galactosidase staining of the retinas ofFatp1+/+
(WT; without LacZ cassette) andFatp12/2(KO; containing the LacZ cassette) mice. In neuroretina,Fatp1is strongly expressed in photoreceptors, and slightly expressed in the inner cells. POS: PR outer segments. PIS: PR inner segments. ONL: outer nuclear layer. OPL: outer plexiform layer. INL: inner nuclear layer. IPL: inner plexiform layer. GCL: ganglion cell layer. doi:10.1371/journal.pone.0050231.g001
Figure 2. Expression of Fatp1 and Fatp4 in the retinas ofFatp1+/+andFatp12/2mice.Expression ofFatp1(A) andFatp4(B) in the NR and RPE ofFatp1+/+
andFatp12/2 mice as determined by qPCR. Results are expressed as a percentage ofActinmRNA expression for NR and as a percentage ofMertkmRNA expression for RPE. mRNA was extracted from tissue pools of 12Fatp1+/+and 10Fatp12/2mice aged 5 months old. Bars represent the mean of triplicates6SEM. *p,0.05.Fatp4expression is decreased in theFatp12/2NR as compared to wt and expression levels are unchanged in the RPE. There is no compensatory up-regulation ofFatp4in theFatp12/2retinas.
Rhodopsin quantification
All manipulations were performed under dim red light. Immediately after cervical dislocation of the mice, eyes were enucleated, and homogenized in 1 ml of PBS, pH 7.2 and centrifuged at 140,000 g, 4uC for 20 min. The pellet was re-suspended in 1 ml of PBS pH 7.2 with 1% Triton X-100 and then incubated at 4uC for 1 h. The homogenate was centrifuged at 140,000 g, 4uC for 20 min. Tenml of hydroxylamine was added to the supernatant to achieve a final concentration of 20 mM, and absorption spectra of the samples were obtained before and after complete bleaching with a 60-W incandescent bulb. The concentration of rhodopsin was determined by the decrease in absorption at 500 nm and the molar extinction of rhodopsin (e = 42,000 liter/mol/cm).
Retinoid quantification
Pupillary dilatation was obtained with one instillation of 0.5% tropicamide (Mydriaticum, The´a, France) in each eye. Animals were sacrificed by cervical dislocation before bleaching (5000 lux, 20 min) or at different times thereafter (0, 5, 15, 30, 60 and 120 min). The eyes were rapidly enucleated, frozen in liquid nitrogen and conserved at280uC until use. The extraction was performed as described [16] with a few modifications: the eyes were homogenized in 800ml of 3 M formaldehyde; after
incubation, 1.5 ml of dichloromethane was added; the volume of hexane added was 3 ml; the extracts were dissolved at the end in 20ml of ethanol for HPLC. The analyses were performed with a
Varian HPLC system equipped with a C18 Isis column (4.66250 mm) (Macherey-Nagel) and a Prostar 330 diode array detector. The retinoids were quantified from the peak areas using calibration curves determined with established standards.
Figure 3. Visual phenotype of theFatp12/2mouse.A. Histology of the retina. Ch: choroid. RPE: retinal pigment epithelium. POS: PR outer segments. PIS: PR inner segments. ONL: outer nuclear layer. OPL: outer plexiform layer. INL: inner nuclear layer. IPL: inner plexiform layer. GCL: ganglion cell layer. WT:Fatp1+/+
. KO:Fatp12/2. B. TEM of WT and KO retinas. BM: Bruch membrane. C. Electroretinography ofFatp1+/+
(n= 29) and
Fatp12/2(n= 23) mice. *p,0.05; **p,0.01; ***p,0.001. The statistical analyses were performed initially for the whole curve (line above the graph) and subsequently for each point. D. b-wave on a-wave ratio of the ERG experiments. Error bars represent SEM. E. Quantification of the retinal coupled-rhodopsin (n= 4Fatp1+/+
andn= 4Fatp12/2) in mice aged 5 to 8 months. Error bars represent SEM. The retinal histology is unchanged in theFatp12/2mice.Fatp12/2PRs present a lower response to light flashes and this decrease is not due to a decrease in the level of retinal coupled-rhodopsin in these animals.
doi:10.1371/journal.pone.0050231.g003
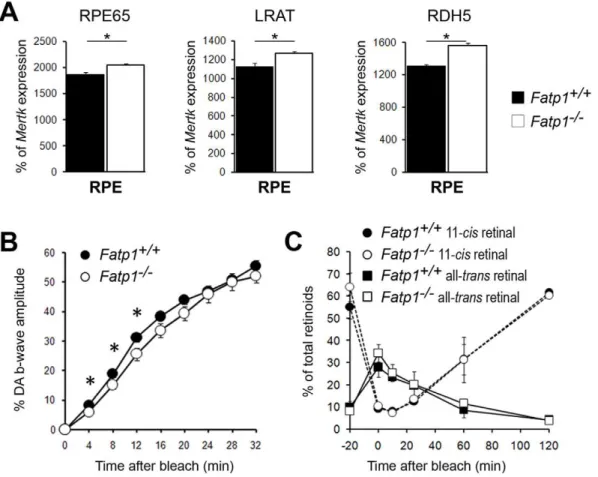
Figure 4. The visual cycle in 5 to 8 mo-oldFatp12/2mice.A. Expression levels of the main visual cycle genes, Rpe65, Lrat and Rdh5. Bars represent the mean of triplicates6SEM. *p,0.05. The genes were slightly deregulated with a 9.6% increase observed forRpe65, a 12.5% increase for
Lratand a 19.5% increase forRdh5. B. Recovery of the b-wave amplitude after bleaching in 5 to 8 mo-old mice (n= 29Fatp1+/+
andn= 21Fatp12/2). Error bars represent SEM. *p,0.05. C. Quantification of the 11-cisretinal and all-transretinal levels in the whole eye. Error bars represent SEM. The recovery of the electroretinogram is delayed inFatp12/2mice but this difference is not linked to a visual cycle kinetic defect.
Fatty acid profile analysis of the retina
At the age of 4 and 8 months, the mice were euthanised, the eyes enucleated, and the NR removed. RPE-choroid was scraped and collected in 1X PBS, then centrifuged to remove the PBS. Tissues were stored dry at280uC. Lipids were extracted [17] and fatty acids were transmethylated [18]. Fatty acid methyl esters were analyzed by gas chromatograph (5890 series II; Hewlett-Packard, Palo Alto, CA) equipped with a split/splitless injector, a flame-ionization detector, and a CPSil88-silica capillary column (100 m60.25 mm ID, film thickness 0.20mm; Varian). The
injector and the detector were maintained at 250uC and 280uC, respectively. Hydrogen was used as a carrier gas (inlet pressure, 210 kPa). The oven temperature was fixed at 60uC for 1 minute, increased to 85uC at a rate of 3uC/min and then to 190uC at a rate of 20uC/min and left at this temperature for 65 minutes.
Fatty acid methyl esters were identified by comparison with commercial standards.
Autofluorescence measurements
For each mouse, one eye was homogenized two times 10 minutes in 1X PBS buffer without MgCl2 using bead-filled
tubes (MagNA Lyser, Roche). Tubes were centrifuged 10 minutes at 100 g to separate the scleral debris. The fluorescence in the supernatant was measured using a Safire II micro plate reader with an excitation of 405 nm and an emission of 520 to 640 nm. The values are expressed in arbitrary fluorescent units from the machine. For each mouse, the result is obtained by summing up all values between 520 and 640 nm taken every 10 nm.
Figure 5. Fatty acid composition in the NR and RPE in 8 mo-oldFatp1+/+andFatp12/2mice.Fatp1+/+(n = 5) andFatp12/2(n = 7). 16:0: palmitate. 22:6n-3: DHA. The functional visual difference betweenFatp12/2andFatp1+/+
mice is not due to a different fatty acid composition. doi:10.1371/journal.pone.0050231.g005
Table 2.Abnormalities observed in aged mice by TEM.
Fatp1+/+(n= 9) Fatp12/2(n= 15)
Abnormal choroidal vessels 0/9 6/15 with only large vessels 2/15 with no vessels 4/15 with continuous vascular layer
Abnormal Bruch membrane 0/9 10/15
Disorganized PR outer segments 0/9 6/15
Statistics
All data, except ERGs, were analyzed using the non parametric Mann & Whitney test due to the sample size, with a significant threshold level set at#5%. For ERGs, due to the complexity of the data, a Hotelling T-square test was performed to assess the overall difference between each pair of mean vectors from the longitudinal data. In those cases where significance was#5%, a Welch 2 sample T-test, corrected for multiple comparisons by the Bonferroni method, was performed at each time point to assess the difference between the two means. All computations where performed using the R package (http://www.r-project/org) [19].
Results
Fatp expression in the retina
We first examined the expression of allFatp members in the RPE and NR ofFatp1+/+
mice by qPCR. OnlyFatp1 andFatp4
were expressed in both tissues, with high levels detected in the RPE relative to Mertk, and in the NR, relative to Actin mRNA.
Fatp4predominated in the NR andFatp1in the RPE (Figure 1A).
To precisely determine the cells expressing Fatp1 among the neuroretinal cells, we took advantage of the fact that Fatp12/2 mice were generated by replacing the first coding exon ofFatp1, which encodes amino acids 1 to 56, with a targeting cassette containing an nlsLacZ sequence [13]. We thus studied Fatp1
expression with a beta-galactosidase staining. Due to pigmenta-tion, it was not possible to observe the labeling in RPE. In NR, the strongest labeling was observed in the PR cells (Figure 1B). The inner nuclear layer (INL) and ganglion cell layer (GCL) nuclei were also slightly labeled.
In Fatp12/2mice, Kimet al. [13] previously verified that there was no compensatory up-regulation of other members of theFatp
family (Fatp2 to 5, as Fatp6 was not yet discovered) in skeletal muscle and white adipose tissue, the two major sites of Fatp1
expression known at this time. We analyzed the expression of the 6
Fatpfamily members in theFatp12/2 retina. Accordingly, Fatp1
expression was effectively at background levels inFatp12/2 eyes (Figure 2A) andFatp4 was the only member expressed consistent with our results in wt retina. However, Fatp4 expression was decreased in theFatp12/2NR (2-fold) as compared to wt whereas
Figure 6. Aging of theFatp12/2retina.A. Electroretinography ofFatp1+/+
(n= 5) andFatp12/2(n= 11) mice, *p= 0.021 for the whole curve. B. Quantification of autofluorescence in young (n= 3Fatp1+/+andn= 4Fatp12/2) and old (n= 6Fatp1+/+andn= 5Fatp12/2) mice. The values are expressed in arbitrary fluorescent units from the machine. For each mouse, the result is obtained by summing up all values between 520 and 640 nm taken every 10 nm. Error bars represent SEM.Fatp12/2PRs remains less responsive to light with age. Fatp12/2mice do not accumulate more autofluorescence, thus presumably more lipofuscin, thanFatp1+/+
with age. C. Upper panel: neutral lipid labeling ofFatp1+/+
(WT) andFatp12/2(KO) retinas. Ch: choroid. RPE: retinal pigment epithelium. POS: PR outer segments. PIS: PR inner segments. ONL: outer nuclear layer. OPL: outer plexiform layer. INL: inner nuclear layer. IPL: inner plexiform layer. GCL: ganglion cell layer. Arrows indicate the BM. Lower panel: positive control at the same magnification (see Material and methods). Arrows indicate the BM as in the upper panel. The asterisk indicates positive ORO labeling.Fatp12/2or
Fatp1+/+
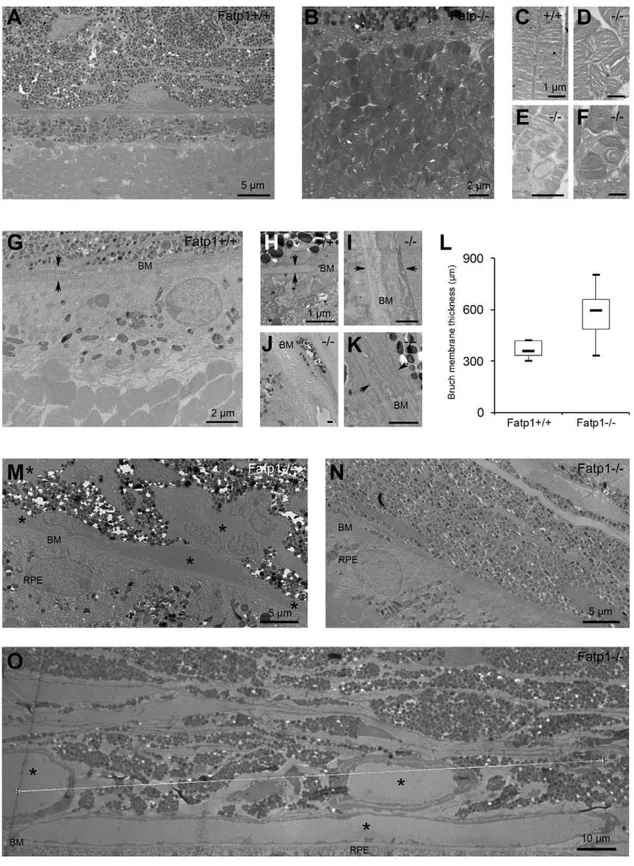
Figure 7. Ultrastructural aging of theFatp12/2retina.A: TEM at low magnification of aFatp1+/+
retina. PR outer segments inFatp12/2at low magnification (B), inFatp1+/+
at high magnification (C), inFatp12/2mice at high magnification (D–F). CertainFatp12/2mice had PR outer segment disorganization. G:Fatp12/2 retina at low magnification showing a thick BM. H:Fatp1+/+BM at high magnification. I-K:Fatp12/2retina at high magnification showing a thicker BM than age-matched control. L: Box plot graph showing the thickness of the BM betweenFatp1+/+
andFatp12/2 retinas (solid line indicates the median;p,0.05). M-O:Fatp12/2retinas at low magnification showing numerous vessels along the BM (M), no vessels (N) and large vessels (O). Arrows indicate the thickness of the BM. Asterisks indicate vessels. The majority ofFatp12/2mice exhibited an irregular or laminar thicker BM. Most of theFatp12/2mice showed strikingly modified choroidal vessels, ranging from presence of only large vessels to absence of vessels.
expression levels were unchanged in the RPE (Figure 2B).Fatp4is the closest member of the family to Fatp1 but does not seem to compensate the absence ofFatp1at the mRNA level.
Visual phenotype of youngFatp12/2 mice
We studied the visual phenotype of young 5 to 8 mo-old adult mice. The retinal histology ofFatp12/2 was similar to that of wt mice (Figure 3A) and we observed no differences with TEM (Figure 3B). PRs appeared similar in morphology and were present in the same number in both genotypes. We then assessed the functionality of the wt andFatp12/2retinas by ERG recordings. The light stimulus increased gradually from an only-rod stimula-tion to a mixed rod-cone stimulastimula-tion. Latencies were similar in wt and Fatp12/2 mice. In contrast, the amplitudes of the ERG responses were weaker in Fatp12/2 mice than in wt, with the amplitude differences Fatp12/2 vs Fatp1+/+ being more pro-nounced for the highest light intensities (maximum b-wave amplitude = 88.9% of the wt; Figure 3C). This difference appears to be due to a dysfunction of the PRs (a-wave) and not of the interneurons (b-wave) as the ratio of b-wave over a-wave was not decreased inFatp12/2 mice (Figure 3D). It was not related to a decrease in photon catch byFatp12/2 PRs as active rhodopsin levels were the same in both genotypes (Figure 3E).
To examine whether the decrease in ERG responses could be related to a dysfunction of the visual cycle, we first verified whether the absence of Fatp1 deregulated the expression of three of the main genes involved in the visual cycle, i.e.Rpe65,LratandRdh5
(Figure 4A). In the absence ofFatp1, the expression of the 3 genes was only slightly (but significantly) increased by 9.6%, 12.5% and 19.5% respectively. We then studied the effect of the absence of Fatp1 on the recovery of the b-wave after bleaching. In the
Fatp12/2 mice, we observed a delay in the first minutes of recovery followed by normalization at 16 min (Figure 4B). This could be explained by a delay in the regeneration of the chromophore 11-cisretinal in the RPE. Therefore, we measured this regeneration directly by measuring the level of each retinoid before and after bleaching during re-adaptation in the dark and observed no differences between Fatp1+/+
and Fatp12/2 retinal extracts at any timepoint (Figure 4C). These results suggested that the lack ofFatp1does not have a strong impact on chromophore regeneration. Thus, the difference in b-wave recovery observedin vivobetween wt andFatp12/2mice did not seem to be due to a major deregulation of the visual cycle.
Fatty acid composition in the retina ofFatp12/2mice
We observed an approximately 10% decrease in the ERG amplitudes and a delayed ERG b-wave amplitude recovery after saturating flash in Fatp12/2 mice as compared to wt. These abnormalities were reminiscent of observations made on n-3 fatty acid-deficient animals. The fatty acid docosahexaenoic acid (DHA, 22:6n-3) is highly enriched in membrane phospholipids of the brain and retina, and in particular PR outer segments. Reduced ERG amplitudes have been reported in animals raised in DHA precursor-deficient diets, and a delayed recovery of ERG b-wave amplitude after a b-b-wave saturating flash has been observed [20,21,22]. This could be explained by reduced rhodopsin efficiency due to lower protein diffusion in the membrane of the discs. As Fatp1 is absent andFatp4 less expressed in the NR of
Fatp12/2mice, it was possible that the lipid composition of the PR outer segments was abnormal, leading to photoreceptor dysfunc-tion. We therefore analyzed the fatty acid composition of the
Fatp12/2andFatp1+/+
NR and RPE for 32 fatty acids at the age of 4 and 8 months. No changes of the fatty acid composition were
seen in the neural retina, which include PRs, nor in the RPE (Figure 5).
Histological anomalies in the retina of oldFatp12/2mice
We analyzed the retinal structure and function of 22 to 26 mo-old wt andFatp12/2mice. Both genotypes mice had lower ERG responses compared to young animals (Figure 3C). However, responses of olderFatp12/2mice remained lower than that of age-matched controls (maximum b-wave amplitude = 89.8% of wt; Figure 6A). We found no evidence of abnormal dark adaptation of theFatp12/2mice after bleaching, but this was possibly due to the small number of old animals available for this protocol (3Fatp1+/+
and 4Fatp12/2). We assayed for the presence of lipofuscin, an autofluorescent byproduct of the visual cycle that accumulates with age and is often observed in age-related macular degener-ation (AMD) retina. However, there was no difference in the amount of autofluorescence between wt and Fatp12/2 animals (Figure 6B). As age-dependent lipid accumulation has been previously described in Bruch membrane (BM) [14,23], we searched for lipid droplet deposition in aged mice. However,
Fatp12/2 or wt mice showed no Oil red O labeling in the BM (Figure 6C). We also studied the retinal structure by TEM. In both
Fatp1+/+ (Figure 7A) and Fatp12/2 mice, we observed classical hallmarks of retinal aging including a decrease in the number of rows of PR nuclei (varying from 5 to 10 rows, mean of 7.7 in
Fatp1+/+and 8 inFatp12/2), thickening of the BM, RPE thinning, enlarged or absent RPE basal infoldings and accumulation of lipofuscin granules. Furthermore, in addition to these common signs of aging, someFatp12/2mice (6/15) had PR outer segment disorganization (Figure 7B–F). In the sections analyzed, there were also greater variations in BM thickness inFatp12/2compared to
Fatp1+/+mice (p,0.05; Figure 7L). Two thirds of theFatp12/2
mice (10/15) exhibited an irregular BM or a BM containing laminar deposits (Figures 7A and 7G-K). Most of the Fatp12/2
mice (12/15) showed strikingly modified choroidal vessels. In some cases (6/15), only large vessels were observed suggesting that small vessels had disappeared and in two mice (2/15), there were even no detectable vessels in the sections analyzed (Figure 7M–O). Yet, in other mice (4/15), choroidal vessels had a normal size but were more numerous, forming a continuous layer under the BM. All
Fatp12/2mice examined by TEM exhibited at least one of these particular additional abnormalities (Table 2).
Discussion
We previously demonstrated that FATP1 interactsin vitrowith RPE65 and inhibits the isomerase activity [12]. As a follow up to this work, we analyzed the expression of every member of theFatp
gene family in the retina, and we studiedFatp12/2mice of various ages to test the effect of Fatp1 deficiency on the visual phenotype and the visual cyclein vivo.
consistent with the fact that the RPE is in contact with the choroidal blood supply and thus with highly changing concentra-tions of fatty acids. In contrast, PRs receive their fatty acids from the RPE, probably in more regulated basal levels, thus explaining the higher levels ofFatp4as compared toFatp1in the NR.
In Fatp1-deficient mice,Fatp4expression is not increased in the retina as compared to controls. This is also the case for muscle and adipose tissues [13] indicating that Fatp4 expression does not compensate for the lack of Fatp1 expression. Moreover, Fatp4
expression was, surprisingly lower in theFatp12/2NR compared to controls. A previous study on a pair of twins (1 obese, 1 lean) reported that Fatp4 expression is up-regulated by environmental factors such as, in this case, acquired obesity [26]. Therefore,Fatp4
could be less expressed in theFatp12/2NR, because the supply in fatty acid is reduced from the RPE, due to the absence of Fatp1, so that less Fatp4 is needed to facilitate the fatty acid entrance into the PR. However, we showed that this reduction had no significant effect on the lipid composition of the NR at 4 and 8 months of age. Although FATP1 has been previously described as an actor of the visual cyclein vitro[12], in the present study, we showed that the Fatp1-deficient mice do not display a decreased formation of 11-cis retinal after bleaching. This could be explained by compensation between Fatp1 and Fatp4 proteins, which are 60% homologous. Phylogenetic analyses reveals that Fatp1 and
Fatp4 are both the orthologs of a single Drosophila fatp gene, suggesting a close function for Fatp1 and Fatp4 [27]. Interestingly, fatp deficiency causes the loss of photoreceptors by a caspase-dependent death, suggesting an important role for fatp in PR survival [28]. Transcomplementation analysis to rescue PR degeneration inDrosophila fatpmutants by expressing mouse Fatp1 or Fatp4 genes would be necessary to address the functional relationship of Fatp1 and/or Fatp4 with fatp.
We observed a decrease in the ERG amplitudes and a slower recovery of the b-wave amplitude after bleach in the Fatp12/2
mice. We hypothesized that these ERG anomalies were due to disequilibrium in the fatty acid composition. However, fatty acids were not differentially distributed in NR and RPE ofFatp12/2and
Fatp1+/+, suggesting that in the absence of Fatp1, the fatty acid supply remains sufficient. In addition, as Fatp12/2 mice fed a normal diet do not exhibit anomalies in intramuscular fatty acid metabolites, insulin sensitivity, body composition (lean and fat mass) or plasma parameters (glucose, insulin, fatty acids, triacylglycerol) [13], it is likely that these differences were due to a specific effect on the eye. One possibility is that the absence of Fatp1 could modify the mitochondrial metabolism. It was previously shown that a part of the cell’s Fatp1 content localizes to the outer mitochondrial membrane and that its overexpression in muscle increases the glucose uptake and the PDH activity [29,30]. Moreover, Fatp1 directs fatty acids towards oxidation, and not storage, in skeletal muscle, liver and adipose tissue [31,32,33], all tissues with a high lipid metabolism as in the retina. Fatp1 also directly increases the fatty acid transport in the mitochondria, where it interacts physically with the carnitine palmitoyltransferase 1 (CPT1) [30], the enzyme that passes the co-A fatty acids towards both membranes of the mitochondria. The absence of Fatp1 could therefore decrease the efficacy of the fatty acid oxidation by the mitochondria and thus the production of energy. As the retina is highly in demand of energy for
phototransduction, ionic transport and metabolism, a moderate decrease in its mitochondrial supply could result in functional modifications as observed in theFatp12/2mice.
Aging retinas of Fatp1-deficient mice showed strikingly abnormal features, with some individual variations that could be explained by the mixed C57BL/6J6129SvEv genetic background. There were abnormal depositions of membranous materials into the BM, with a rather diffuse accumulation within and along the BM. This is reminiscent of basal laminar deposits observed in human age-related macular degeneration (AMD) [34]. Similar deposits are also observed in mouse models of AMD fed with high fat diet such as
ApoE2/2, CD362/2, SR-BI2/2, LDLR2/2 mice [14,35, 36,37,38,39]. In LDLR2/2 and SR-BI2/2 mouse models, lipid droplets were found in BM that are labeled with oil Red O [14,23]. We did not observe such droplets (nor oil Red O labeling) but more diffuse accumulation within and along the BM, the composition of which remains to be elucidated.
In addition to BM deposits,Fatp12/2mice had disorganization of PR and abnormal choroidal vessels. In humans, it is believed that extracellular deposits in BM lead to reduced nutriment transport and to secondary injury of the RPE, choroid and PR. Indeed, the majority of the Fatp1-deficient mice (12/15) presented an abnormal choroidal vascularization. Many of them had only large vessels or no vessels at all. In both cases, the capillaries of the choroid had disappeared, an observation that was also reported in theCD362/2model of AMD [36]. Conversely, a smaller number of mice featured an almost continuous layer of capillaris under the BM. This could represent a first step towards breaking of the BM and neovascularization into the subretinal space, as occurs in wet AMD. In contrast to previously described AMD mouse models involving lipid metabolism such asApoE2/2,CD362/2,SR-BI2/2,
LDLR2/2mice [14,35,36,37,38,39], Fatp1-deficient mice did not show drusen and oil red O labeling or abnormal lipofuscin accumulation. However, it should be stressed that these mouse models require high fat diet (often used to mimic the human alimentation in industrialized countries) for several months in order to display these anomalies [14,37,38]. Additional investiga-tions with Fatp1-deficient mice subjected to high fat diet would be necessary to examine whether or not they develop these abnormalities.
In conclusion, we showed that Fatp1-deficient mice exhibit accelerated aging of the outer retina, and that these features were not linked to abnormal visual cycle kinetics or to lipid composition of photoreceptor and RPE.
Acknowledgments
The authors are grateful to Ce´cile Sanchez, Isabelle Sassetti, Marie-Line Loyalle, Chantal Jacquet and David Cia for their technical assistance, to Drs Alexandra Provost and Karine Bigot for material providing. The authors are very grateful to Dr Vasiliki Kalatzis for her repeated critical reading of the manuscript.
Author Contributions
Conceived and designed the experiments: KC LB PB MOP. Performed the experiments: KC LG SG EB MOP. Analyzed the data: KC GD CC LB CPH PB MOP. Wrote the paper: CPH PB MOP.
References
1. Simo R, Villarroel M, Corraliza L, Hernandez C, Garcia-Ramirez M (2010) The retinal pigment epithelium: something more than a constituent of the blood-retinal barrier–implications for the pathogenesis of diabetic retinopathy. J Biomed Biotechnol 2010: 190724.
2. Martinez-Morales JR, Rodrigo I, Bovolenta P (2004) Eye development: a view from the retina pigmented epithelium. Bioessays 26: 766–777.
4. Kevany BM, Palczewski K (2010) Phagocytosis of retinal rod and cone photoreceptors. Physiology (Bethesda) 25: 8–15.
5. Bazan NG (2006) Cell survival matters: docosahexaenoic acid signaling, neuroprotection and photoreceptors. Trends Neurosci 29: 263–271. 6. Jin M, Li S, Moghrabi WN, Sun H, Travis GH (2005) Rpe65 is the retinoid
isomerase in bovine retinal pigment epithelium. Cell 122: 449–459. 7. Moiseyev G, Chen Y, Takahashi Y, Wu BX, Ma JX (2005) RPE65 is the
isomerohydrolase in the retinoid visual cycle. Proc Natl Acad Sci U S A 102: 12413–12418.
8. Thompson DA, Gal A (2003) Vitamin A metabolism in the retinal pigment epithelium: genes, mutations, and diseases. Prog Retin Eye Res 22: 683–703. 9. Sparrow JR, Hicks D, Hamel CP (2010) The retinal pigment epithelium in
health and disease. Curr Mol Med 10: 802–823.
10. Wu L, Nagasaki T, Sparrow JR (2010) Photoreceptor cell degeneration in Abcr (2/2) mice. Adv Exp Med Biol 664: 533–539.
11. Doege H, Stahl A (2006) Protein-mediated fatty acid uptake: novel insights from in vivo models. Physiology (Bethesda) 21: 259–268.
12. Guignard TJ, Jin M, Pequignot MO, Li S, Chassigneux Y, et al. (2010) FATP1 inhibits 11-cis retinol formation via interaction with the visual cycle retinoid isomerase RPE65 and lecithin:retinol acyltransferase. J Biol Chem 285: 18759– 18768.
13. Kim JK, Gimeno RE, Higashimori T, Kim HJ, Choi H, et al. (2004) Inactivation of fatty acid transport protein 1 prevents fat-induced insulin resistance in skeletal muscle. J Clin Invest 113: 756–763.
14. Provost AC, Vede L, Bigot K, Keller N, Tailleux A, et al. (2009) Morphologic and electroretinographic phenotype of SR-BI knockout mice after a long-term atherogenic diet. Invest Ophthalmol Vis Sci 50: 3931–3942.
15. Chekroud K, Arndt C, Basset D, Hamel CP, Brabet P, et al. (2011) Simple and efficient: validation of a cotton wick electrode for animal electroretinography. Ophthalmic Research 45: 174–179.
16. Suzuki T, Fujita Y, Noda Y, Miyata S (1986) A simple procedure for the extraction of the native chromophore of visual pigments: the formaldehyde method. Vision Res 26: 425–429.
17. Folch J, Lees M, Sloane Stanley GH (1957) A simple method for the isolation and purification of total lipides from animal tissues. J Biol Chem 226: 497–509. 18. Morrison WR, Smith LM (1964) Preparation of Fatty Acid Methyl Esters and Dimethylacetals from Lipids with Boron Fluoride–Methanol. J Lipid Res 5: 600– 608.
19. Johnson RA, WIchern DW (2001) Applied Multivariate Statistical Analysis. 5th edition ed: Prentice Hall.
20. Bush RA, Malnoe A, Reme CE, Williams TP (1994) Dietary deficiency of N-3 fatty acids alters rhodopsin content and function in the rat retina. Invest Ophthalmol Vis Sci 35: 91–100.
21. Neuringer M, Connor WE, Lin DS, Barstad L, Luck S (1986) Biochemical and functional effects of prenatal and postnatal omega 3 fatty acid deficiency on retina and brain in rhesus monkeys. Proc Natl Acad Sci U S A 83: 4021–4025. 22. Pawlosky RJ, Denkins Y, Ward G, Salem N Jr (1997) Retinal and brain accretion of long-chain polyunsaturated fatty acids in developing felines: the effects of corn oil-based maternal diets. Am J Clin Nutr 65: 465–472. 23. Schmidt-Erfurth U, Rudolf M, Funk M, Hofmann-Rummelt C, Franz-Haas NS,
et al. (2008) Ultrastructural changes in a murine model of graded Bruch
membrane lipoidal degeneration and corresponding VEGF164 detection. Invest Ophthalmol Vis Sci 49: 390–398.
24. Chabowski A, Coort SL, Calles-Escandon J, Tandon NN, Glatz JF, et al. (2005) The subcellular compartmentation of fatty acid transporters is regulated differently by insulin and by AICAR. FEBS Lett 579: 2428–2432.
25. Gimeno RE (2007) Fatty acid transport proteins. Curr Opin Lipidol 18: 271– 276.
26. Gertow K, Pietilainen KH, Yki-Jarvinen H, Kaprio J, Rissanen A, et al. (2004) Expression of fatty-acid-handling proteins in human adipose tissue in relation to obesity and insulin resistance. Diabetologia 47: 1118–1125.
27. Hirsch D, Stahl A, Lodish HF (1998) A family of fatty acid transporters conserved from mycobacterium to man. Proc Natl Acad Sci U S A 95: 8625– 8629.
28. Gambis A, Dourlen P, Steller H, Mollereau B (2011) Two-color in vivo imaging of photoreceptor apoptosis and development in Drosophila. Dev Biol 351: 128– 134.
29. Guitart M, Andreu AL, Garcia-Arumi E, Briones P, Quintana E, et al. (2009) FATP1 localizes to mitochondria and enhances pyruvate dehydrogenase activity in skeletal myotubes. Mitochondrion 9: 266–272.
30. Sebastian D, Guitart M, Garcia-Martinez C, Mauvezin C, Orellana-Gavalda JM, et al. (2009) Novel role of FATP1 in mitochondrial fatty acid oxidation in skeletal muscle cells. J Lipid Res 50: 1789–1799.
31. Ellis JM, Li LO, Wu PC, Koves TR, Ilkayeva O, et al. (2010) Adipose acyl-CoA synthetase-1 directs fatty acids toward beta-oxidation and is required for cold thermogenesis. Cell Metab 12: 53–64.
32. Holloway GP, Chou CJ, Lally J, Stellingwerff T, Maher AC, et al. (2011) Increasing skeletal muscle fatty acid transport protein 1 (FATP1) targets fatty acids to oxidation and does not predispose mice to diet-induced insulin resistance. Diabetologia 54: 1457–1467.
33. Li LO, Ellis JM, Paich HA, Wang S, Gong N, et al. (2009) Liver-specific loss of long chain acyl-CoA synthetase-1 decreases triacylglycerol synthesis and beta-oxidation and alters phospholipid fatty acid composition. J Biol Chem 284: 27816–27826.
34. Sarks S, Cherepanoff S, Killingsworth M, Sarks J (2007) Relationship of Basal laminar deposit and membranous debris to the clinical presentation of early age-related macular degeneration. Invest Ophthalmol Vis Sci 48: 968–977. 35. Dithmar S, Curcio CA, Le NA, Brown S, Grossniklaus HE (2000)
Ultrastructural changes in Bruch’s membrane of apolipoprotein E-deficient mice. Invest Ophthalmol Vis Sci 41: 2035–2042.
36. Houssier M, Raoul W, Lavalette S, Keller N, Guillonneau X, et al. (2008) CD36 deficiency leads to choroidal involution via COX2 down-regulation in rodents. PLoS Med 5: e39.
37. Picard E, Houssier M, Bujold K, Sapieha P, Lubell W, et al. (2010) CD36 plays an important role in the clearance of oxLDL and associated age-dependent sub-retinal deposits. Aging (Albany NY) 2: 981–989.
38. Rudolf M, Winkler B, Aherrahou Z, Doehring LC, Kaczmarek P, et al. (2005) Increased expression of vascular endothelial growth factor associated with accumulation of lipids in Bruch’s membrane of LDL receptor knockout mice. Br J Ophthalmol 89: 1627–1630.