www.hydrol-earth-syst-sci.net/18/1073/2014/ doi:10.5194/hess-18-1073-2014
© Author(s) 2014. CC Attribution 3.0 License.
Hydrology and
Earth System
Sciences
Dynamics of auto- and heterotrophic picoplankton and associated
viruses in Lake Geneva
A. Parvathi1,2, X. Zhong2, A. S. Pradeep Ram3, and S. Jacquet2
1National Institute of Oceanography, Dr Salim Ali Road, P.O. Box 1913, 682018 Kochi, India 2INRA – UMR042 CARRTEL, 75 Avenue de Corzent, 74203 Thonon-les-Bains cx, France
3Laboratoire Microorganismes, Génome et Environnment, CNRS – UMR6023, Clermont Université, Université Blaise Pascal, BP 80026, 63171 Aubière Cedex, France
Correspondence to:Stéphan Jacquet (stephan.jacquet@thonon.inra.fr)
Received: 12 June 2013 – Published in Hydrol. Earth Syst. Sci. Discuss.: 4 July 2013 Revised: 4 February 2014 – Accepted: 10 February 2014 – Published: 19 March 2014
Abstract.Microbial dynamics have rarely been investigated in Lake Geneva, known as the largest lake in western Eu-rope. From a 5-month survey, we report dynamic patterns of free-living virus, bacteria and small phytoplankton abun-dances in response to a variety of environmental parameters. For the first time, we fractionated the primary production to separate the contribution of different size-related biological compartments and measured both bacterial and viral pro-duction in addition to experiments conducted to quantify the virus-induced bacterial mortality. We observed marked sea-sonal and vertical variations in picocyanobacteria, bacteria and virus abundances and production. The contribution of picoplankton and nanoplankton production to the total mary production was high (reaching up to 76 % of total pri-mary production) in November and the spring–summer tran-sition period, respectively. The impact of viral lysis on both bacteria and picocyanobacteria was significantly higher than grazing activities. Virus-induced picocyanobacterial mortal-ity reached up to 66 % of cell removal compared to virus induced (heterotrophic) bacterial mortality, which reached a maximum of 34 % in July. Statistical analyzes revealed that temperature and top-down control by viruses are among im-portant factors regulating the picocyanobacterial dynamics in this lake. More generally speaking, our results add to the growing evidence and accepted view nowadays that viruses are an important actor of freshwater microbial dynamics and more globally of the functioning of the microbial food webs.
1 Introduction
As is true for any ecosystem, Lake Geneva is changing con-tinuously, posing challenges to ecologists (Anneville et al., 2013). Over the past few decades, water quality monitoring surveys have been performed under the authority of the In-ternational Commission for the Protection of Lake Geneva (see reports at http://www.cipel.org/sp/), in order to study the water quality, functioning and evolution of this ecosys-tem, which is connected to an important catchment area. The detailed analysis of the viral and microbial communities in Lake Geneva during periods of the year such as the spring-to-summer and the summer-to-fall transitions have not been provided yet. The interactions between these microorganisms and their environment within the food webs are, however, a key issue to study for a better understanding of Lake Geneva ecology.
(Worden et al., 2004). Compared to autotrophic picoplank-ton, heterotrophic bacteria contribute a larger percentage to total plankton biomass and play a central role in the transfor-mation and mineralization of organic matter in the biosphere. These heterotrophs contribute largely to the cycling of car-bon and nutrients in aquatic systems (Sarmiento and Gruber, 2006) and also form an important nutrient resource for higher trophic levels (i.e., the heterotrophic nanoflagellates, ciliates, metazooplankton).
Autochthonous and allochthonous factors can impact both auto- and heterotrophic organisms, affecting their distribu-tion, structure, diversity as well as interactions among the organisms. The dynamics of picoplankton in aquatic ecosys-tems are not only controlled by abiotic factors (temperature, light, and nutrients), but also by biotic factors such as natural death, viral lysis, predation and parasitism. In recent years, top-down control of picoplankton populations has evoked much interests among microbial ecologists with the finding of large numbers of viruses (108–1011L−1) in aquatic sys-tems. Studies have now revealed that viral lysis can be a significant source of mortality, as important as bacterivory by protists (Fuhrman and Noble, 1995; Pradeep Ram et al., 2005; Personnic et al., 2009b). Through their lysis activity, viruses also play an important role in regulating carbon and nutrient fluxes, food web dynamics and microbial diversity in aquatic systems (Suttle, 2005; Jacquet et al., 2010; Breitbart, 2012).
The factors that influence viral abundance and dynamics in aquatic environments are complex and are found to vary with aquatic ecosystems (Clasen et al., 2008). Although a large majority of these studies have been focused on marine en-vironments (Weinbauer and Suttle, 1997; Weinbauer, 2004), fewer investigations have been carried out in freshwater sys-tems to study the influence of environmental factors on the dynamics of viral communities associated with autotrophic and heterotrophic picoplankton (Maranger and Bird, 1995; Clasen et al., 2008; Jacquet et al., 2010). Studies have shown that the viral abundance is influenced more by the bacte-rial abundance in marine environments and by chlorophyll a concentration in nutrient-rich lakes (Pradeep Ram et al., 2010). A few studies in the lacustrine environments have in-cluded the influence of grazers on the picoplankton and bac-terial abundances in studying viral dynamics (Personnic et al., 2009b; Berdjeb et al., 2011).
Lake Geneva is a mesotrophic peri-alpine lake where past studies have suggested thatSynechococcusis the most predominant species in the autotrophic picoplankton (APP) (Duhamel et al., 2006; Personnic et al., 2009a). Lake Geneva has been poorly investigated in terms of microbial dynamics and diversity, and information on virus-bacteria, flagellates-bacteria and picocyanoflagellates-bacteria-ciliates interactions is still lacking for this lake (Duhamel et al., 2005; Personnic et al., 2009a, b). Our aim was to bring out an understand-ing about how various environmental and water quality pa-rameters vary over a period of 5 months and how these
changes may determine the abundance of autotrophic and heterotrophic plankton and associated viruses and to eluci-date the type and extent of relationships of various physical, chemical and biological factors in determining the abundance of various autotrophic and heterotrophic planktonic groups in Lake Geneva. Recently by using a PCR-based molecular ap-proach, we showed that Lake Geneva displays clear seasonal variations in the diversity of viruses (Parvathi et al., 2012). However, information regarding both the phytoplankton (in particular the picophytoplankton) dynamics and production and the dynamics and role of associated viruses is still lack-ing from this lake. Further, the influence of various chemical and physical parameters on viruses and different groups of plankton has not yet been well documented. Therefore, in the present study we proposed to highlight the seasonal and vertical variations in environmental and water quality param-eters and resultant changes in picoplankton abundance, pro-duction and different viral parameters in relation to both bi-otic and abibi-otic factors in Lake Geneva over a 5-month period including summer and fall.
2 Materials and methods
2.1 Study site and sampling strategy
Lake Geneva, which lies at an altitude of 372 m, is the largest lake in western Europe and forms the border between France and Switzerland at the north of the French Alps. The lake is 72 km long and 13 km wide with an area of 580 km2. Its catchment area is about 7419 km2, reaching a maximal alti-tude of 4634 m (the average altialti-tude is 1670 m), and at least 60 different tributaries aliment the lake (among which the Rhone River as the main one, with on average 180 m3s−1). In terms of hydrology, annual rainfall has been about 1000 mm for the period 1981–2010. The water circulation of the lake has been clearly less studied (Lemmin et al., 1999; Ishiguro and Balvay, 2003). It is a meromictic lake, never covered by ice, with temperature ranging between 4 and 22◦C. It
holds an approximate volume of 89×109m3for a maximum
depth of 309 m (average depth is 152 m), and this lake was re-ported as eutrophic during the 1970s. Later during the 1990s, following restoration programs, including measures to re-duce phosphorus inputs, the lake changed to a mesotrophic state. In 2011, the lake had a total phosphorus content of 27 µgP L−1(Lazzarotto and Klein, 2012). In our study, sam-ples were collected at the reference station (lat 46◦27′N,
long 6◦32′E), corresponding to the deepest part of the lake at
from light and heat, and brought to the laboratory within 3 h of collection.
2.2 Environmental parameters and plankton analysis
A multiparameter probe (CTD 90M, Sea and Sun Tech-nology) was used to collect different parameters: tempera-ture, light, conductivity, chlorophylla and oxygen profiles. Samples collected at discrete depths (2.5, 5, 7.5, 10, 15, 20, 30, and 50 m) were analyzed for nutrients, namely ni-trate (N-NO3), nitrite (N-NO2), total nitrogen (Ntot), phos-phate (PO4), total phosphorous (Ptot) and silicate (SiO2) us-ing standard methods (Anneville et al., 2005). Raw water samples for the phytoplankton analysis were taken with a patented integrating instrument developed by Pelletier and Orand (1978) integrating the 0–18 m upper water layer and fixed with a few drops of Lugol’s solution for phytoplank-ton and zooplankphytoplank-ton analysis. For each sample, 25 mL was poured into an Utermöhl room (cylinder surmounting a blade with sediment chamber; Utermöhl, 1931) and left to form a deposit for at least 12 h away from light and heat. The quali-tative and quantiquali-tative examination of the phytoplankton was carried out using inverted microscopy (Zeiss). For the zoo-plankton, vertical sampling from a depth of 50 m to the sur-face was carried out using a net of 212 µm mesh size. The samples were fixed with formol (5 % v/v). The enumeration of microcrustaceae presented here was achieved by means of a standard microscope (Olympus BX40) following Anneville et al. (2007).
2.3 Flow cytometry analysis
Virus-like particles (VLPs) from discrete depths were counted using a FACSCalibur flow cytometer (FCM) (Bec-ton Dickinson) equipped with an air-cooled laser providing 15 mW at 488 nm. Samples were fixed with glutaraldehyde (0.5 % final concentration, grade I, Merck) for 30 min, then diluted in 0.02 µm filtered Tris-EDTA buffer (referred to as TE, 0.1 mM Tris-HCL and 1 mM EDTA, pH 8), and incu-bated with SYBR Green I (at a final 10−4 dilution of the commercial stock solution; Molecular Probes), for 5 min at ambient temperature in the dark. At last, the sample was incubated for 10 min at 75◦C, and for another 5 min at
room temperature prior to FCM analysis (Personnic et al., 2009a). FCM discriminated at least 3 subgroups of viruses, designated as VLP1, VLP2 and VLP3 (virus-like particles, group 1, 2 and 3) (Jacquet et al., 2010), but only VLP1 and VLP2 could be observed throughout the period of analy-sis and were shown thereafter. The analyanaly-sis for determining heterotrophic bacterial abundance from different depths was performed as for the viruses but without heating at 75◦C and
by using<0.02 µm filtered lake water instead of TE (details can be found in Jacquet et al., 2013). The picocyanobacteria and other smaller phytoplankters were analyzed without fix-ing or stainfix-ing, but by usfix-ing their natural autofluorescence.
During previous experiments or surveys in peri-alpine lakes (e.g., Annecy, Bourget and Geneva), some picocyanobacte-ria were sorted with flow cytometry and cultured, and both genetic affiliation and size were analyzed in order to confirm their identity. All cultured strains isolated so far with typical phycoerythrin-rich (PE) picocyanobacteria FCM signatures belong toSynechococcus-like populations and these PE-rich picocyanobacteria for the French sub-Alpine lakes vary in size between 1.5 and 2.5 µm (Jacquet, unpublished). Anal-ysis was made on samples to which a suspension of 1 µm beads had been added (Molecular Probes).
2.4 Fractionated primary production
Size-fractionated primary production at five discrete depths (2.5, 7.5, 10, 15 and 20 m) was determined by in situ incu-bations with the isotope14C.<200 µm water samples from each depth were filled into three 250 mL glass bottles (two “light” and one “dark” bottle). These bottles were inocu-lated with 1 ml of radiolabeled NaH14CO3(5 µCi mL−1) and subsequently incubated for 5 h at respective depths where the water was sampled. At the end of the incubation, sam-ples were sequentially filtered through 20 µm nylon mesh and 3.0 and 0.2 µm polycarbonate filters. The phytoplank-ton cells concentrated in the 20 µm mesh were washed with filtered lake water and again concentrated on 0.7 µm GF/F fil-ters. This corresponded to the microphytoplankton fraction, whereas the 3.0 and 0.2 µm represented the nano- and pico-phytoplankton fractions, respectively. The filters were used for subsequent analysis after removing excess dissolved in-organic carbon (DI14C) by exposing it to concentrated hy-drochloric acid fumes for one minute. The filters were then placed in scintillation vials and a 5 mL scintillation cocktail was added. Radioactivity was measured using a liquid scin-tillation counter (Beckman Coulter, USA). Production rate was calculated based on the photoperiod of each day and expressed as µg C L−1d−1. Other details can be found else-where (Anneville et al., 2002; Tadonléké, 2010).
2.5 Bacterial and viral production
the filter. A 5 mL scintillation cocktail was added and the ra-dioactivity was measured using liquid scintillation counter (LS 6500 Scintillation Counter, Beckman Coulter, USA). The disintegration values per minute (dpm) after correcting for blank were converted to moles TdR of bacterial cells (2×10¹⁸cells mol−1) and bacterial carbon (20 fg C cell−1).
Viral production was estimated by the virus reduction method (Wilhelm et al., 2002), similar to a previous study conducted at a peri-Alpine lake by Thomas et al. (2011). Briefly, a 100 mL water sample was diluted with 3 volumes of ultrafiltered sample (<0.02 µm, free of viruses) to reduce the number of free viruses in the sample significantly. This was divided into three replicates and samples were incubated in the dark for 24 h. Subsamples were drawn at 2-hourly in-tervals to monitor the abundance of bacteria and viruses. The bacterial and viral abundances were determined using flow cytometry as described above.
2.6 Transmission electronic microscopy (TEM) analysis
Viral lytic infections were inferred from the percentage of visibly infected 8 cells (FVIC) according to Sime-Ngando et al. (1996). Bacterial cells contained in milliliters of glutaraldehyde-fixed samples (1 % final concentration), which were stored at 4◦C, were harvested by
ultracentrifu-gation onto 400 mesh NI electron microscope grids with carbon-coated Formvar film, by using a Beckman Coulter SW40 Ti swing-out rotor run at 70 000×g for 20 min at 4◦C. Each grid was stained at room temperature (ca. 20◦C)
for 30 s with uranyl acetate (2 % wt/wt), rinsed twice with 0.02 µm filtered distilled water and dried on a filter pa-per. Grids were then examined using a JEOL 1200E×TEM
operated at 80 kV at a magnification of ×100 000. At
least 600–800 prokaryotic cells per sample were exam-ined to determine the frequency of visibly infected cells (FVIC). Cells were scored as infected if they contained five or more intracellular viruses. For each sample, the mean burst size (viruses bacteria−1) was estimated from the number of viruses in visibly infected cells. Because ma-ture phages are visible only late in the infection cycle, FVIC counts were converted to the frequency of infected cells (FIC) using the equation FIC = 9.524×FVIC−3.256
(Weinbauer et al., 2002). The FIC was then converted to viral-induced bacterial mortality (VIBM, as a percentage per generation) according to Binder (1999) using the equation VIBM = (FIC+0.6×FIC2)/(1−1.2×FIC).
2.7 Dilution experiments and viral parameters
The modified dilution approach was used to determine the grazing and viral-induced mortality on picoplankton and bac-teria (Evans et al., 2003) as previously done by Personnic et al. (2009b) and Thomas et al. (2011). In this method, parallel dilution series (70, 40 and 20 %) of natural lake water was performed with 0.2 µm filtered sample to obtain the grazing
rate and with 30 kDa filtered sample to obtain grazing and viral lysis rates. Percentages of grazing and viral mortality were determined from the difference between the two dilu-tion series, provided that the regression slopes were signif-icant (Kimmance et al., 2007). Viral mortality rates (d−1) were also calculated as the ratio of viral production and burst size. The lytic mortality rate was calculated from viral lysis rate and bacterial abundance.
2.8 Statistical analysis
The statistical analysis was carried out for the monthly data for the abundance of heterotrophic bacteria, picocyanobacte-ria, other phytoplankton, VLP1, VLP2, total VLP and other physicochemical parameters. The dependent variables were the abundance of bacteria, picocyanobacteria, other phyto-plankton, VLP1, VLP2 and VLP. The independent variables influencing dependent variables have been considered as ex-planatory variables (i.e., temperature, pH, turbidity, PO4, Ptot, Ppart, Mg, COT, Na, Ca, NH4, Cl, SO4, Chla, dissolved oxygen, Ntot, NO3-N, NO2-N, SiO2-Si). The presence of au-tocorrelation was checked using the PAST software (PAST version 2.14), which revealed correlations which were not significant. Also, explanatory variables were found to be highly correlated, indicating the presence of multicollinear-ity. Hence, an alternative method of estimation, the princi-pal component regression, was used to examine the factors that influence the abundances of picoplankton, bacteria and viruses. The principle components were obtained by eigen-value decomposition of the covariance or correlation matrix of the explanatory variables. For the analysis of variations in VLPs, biological factors such as the bacterial, picocyanobac-terial and the other phytoplankton abundances were included as independent variables in factor analysis.
3 Results
3.1 Environmental factors
The mean along with standard deviation values of all the en-vironmental parameters are provided in Table 1, while the dynamics and/or distribution of some of them can be appre-ciated in Fig. 1. Briefly, the average water temperature during the study period was 14.0±5.2◦C, with minimum and
max-imum values of 6.2◦C (November) and 21.5◦C (August),
respectively. Vertical profiles showed water temperature to decrease rapidly from surface (19.6◦C) to 30 m (6.9◦C). The
vertical stratification was well marked in summer. In the air, the temperature was relatively high during summer, reach-ing 25◦C with fluctuations between 15 and 25◦C. After
Au-gust, the air temperature decreased significantly month af-ter month down to 5◦C in November, but the decrease was
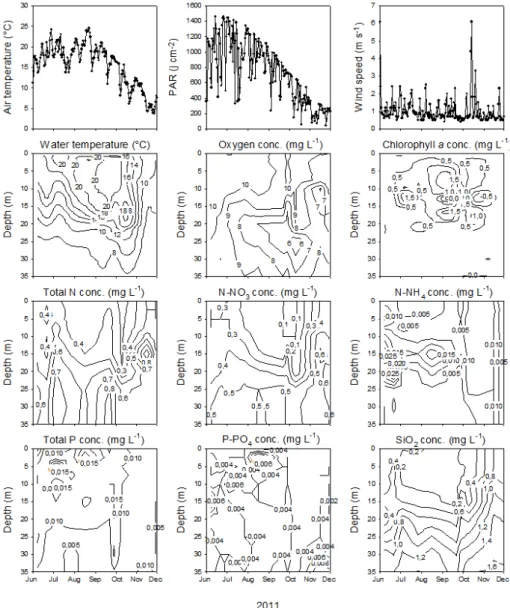
Fig. 1.Time series obtained for the main environmental parameters from June to December 2011. The interpolation between the data was generated automatically by SigmaPlot 12.0.
oxygen concentration varied between 5.2 and 10.9 mg L−1. The highest values were recorded in the 0–10 m surface layer, and values decreased only slightly from summer to fall. Dur-ing the study period, the concentrations of TP and TN var-ied by a factor of 15 and 8, respectively. Both nitrogen and phosphorus values varied significantly (p <0.05) with re-spect to months and depths. Such variations were mainly due to NO3 for TN. Chlorophyll a concentrations ranged from 0.8 to 6.8 µg L−1with the highest and lowest values in July at 7.5 and 30 m depths, respectively. This parameter clearly revealed that the phytoplankton was not distributed homo-geneously through the water column and that it was mainly concentrated at 0–20 m. As a matter of proof, water trans-parency varied between 4.5 m (at the end of July) and 11 m (mid-November) and the estimated euphotic zone thus varied between 11 and 28 m.
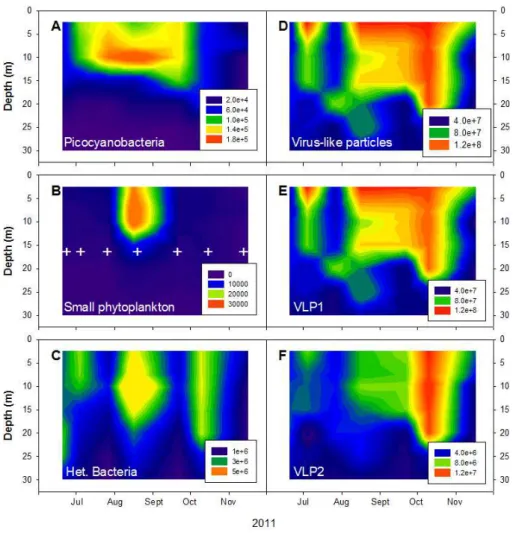
3.2 Abundances of heterotrophic bacteria, picocyanobacteria and other phytoplankton
The heterotrophic bacterial population showed strong month-to-month and vertical variability, with maximum abundance (5.76×10⁶cells mL−1) observed in August
at 10 m (Table 1). Bacterial abundance varied up to 5-and 11-fold with month 5-and depth, respectively. Simi-larly, the picocyanobacterial abundance was the highest at 10 m, with an average of 1.1±0.7×10⁵cells mL−1,
and the lowest at 30 m (2.2±1.4×10³cells mL−1). The
picocyanobacterial abundance maximum was recorded in August (1.9×10⁵cells mL−1) and minimum in
Novem-ber (2.1×10²cells mL−1). Like bacterial and
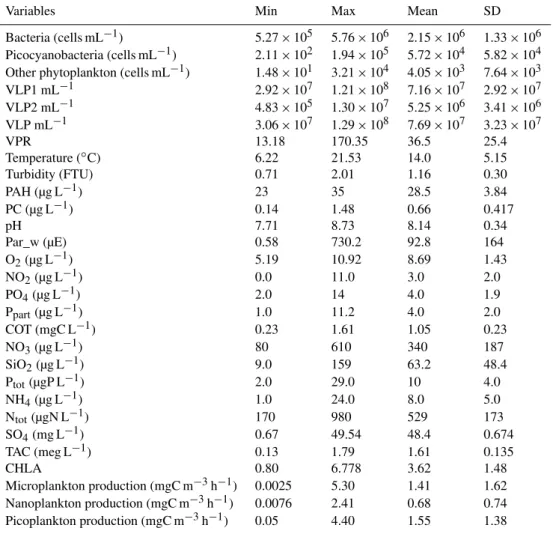
Table 1.Minimum, maximum, mean and standard deviation values for all the variables measured in Lake Geneva in this study from July to November 2011. Abbreviations are mentioned in the text.
Variables Min Max Mean SD
Bacteria (cells mL−1) 5.27×10⁵ 5.76×10⁶ 2.15×10⁶ 1.33×10⁶
Picocyanobacteria (cells mL−1) 2.11×10² 1.94×10⁵ 5.72×10⁴ 5.82×10⁴
Other phytoplankton (cells mL−1) 1.48×101 3.21×10⁴ 4.05×10³ 7.64×10³
VLP1 mL−1 2.92×10⁷ 1.21×10⁸ 7.16×10⁷ 2.92×10⁷
VLP2 mL−1 4.83×10⁵ 1.30×10⁷ 5.25×10⁶ 3.41×10⁶
VLP mL−1 3.06×10⁷ 1.29×10⁸ 7.69×10⁷ 3.23×10⁷
VPR 13.18 170.35 36.5 25.4
Temperature (◦C) 6.22 21.53 14.0 5.15
Turbidity (FTU) 0.71 2.01 1.16 0.30 PAH (µg L−1) 23 35 28.5 3.84
PC (µg L−1) 0.14 1.48 0.66 0.417
pH 7.71 8.73 8.14 0.34
Par_w (µE) 0.58 730.2 92.8 164 O2(µg L−1) 5.19 10.92 8.69 1.43
NO2(µg L−1) 0.0 11.0 3.0 2.0
PO4(µg L−1) 2.0 14 4.0 1.9
Ppart(µg L−1) 1.0 11.2 4.0 2.0
COT (mgC L−1) 0.23 1.61 1.05 0.23
NO3(µg L−1) 80 610 340 187
SiO2(µg L−1) 9.0 159 63.2 48.4
Ptot(µgP L−1) 2.0 29.0 10 4.0
NH4(µg L−1) 1.0 24.0 8.0 5.0
Ntot(µgN L−1) 170 980 529 173
SO4(mg L−1) 0.67 49.54 48.4 0.674
TAC (meg L−1) 0.13 1.79 1.61 0.135
CHLA 0.80 6.778 3.62 1.48
Microplankton production (mgC m−3h−1) 0.0025 5.30 1.41 1.62
Nanoplankton production (mgC m−3h−1) 0.0076 2.41 0.68 0.74
Picoplankton production (mgC m−3h−1) 0.05 4.40 1.55 1.38
variations, with the highest concentrations observed at 7.5 m (8.0±1.45×10³cells mL−1) in August and the lowest at
30 m (3.6±2.1×10²cells mL−1) in November (Fig. 2).
3.3 Virus-like particle abundances and lytic infection rates
Maximum abundances of the virus-like particles (VLPs) were observed at 2.5 m (11.0±3.1×10⁷particles mL−1)
and the minimum at 30 m (4.4±0.74×10⁷particles mL−1).
Highest and lowest VLP abundances were observed in September (1.3×10⁸particles mL−1) and November
(3.1×10⁷particles mL−1), respectively (Fig. 2). VLPs
could be discriminated into two major groups, re-ferred to as VLP1 and VLP2. Average VLP1 and VLP2 abundances were 7.2±2.9×10⁷particles mL−1 and
0.53±0.34×10⁷particles mL−1, respectively. The
high-est and lowhigh-est VLP1 and VLP2 abundances were 1.2×10⁸ and 2.9×10⁷particles mL−1 and 1.3×10⁷ and
4.8×10⁵particles mL−1, respectively, and they were both
measured at 2.5 and 30 m depth. The virus-to-bacteria ra-tio was highest at 20 m depth (56.6±5.6) and lowest at
10 m (27.6±12.2). The highest (170) and lowest (13.8)
ra-tios were observed in July at different depths.
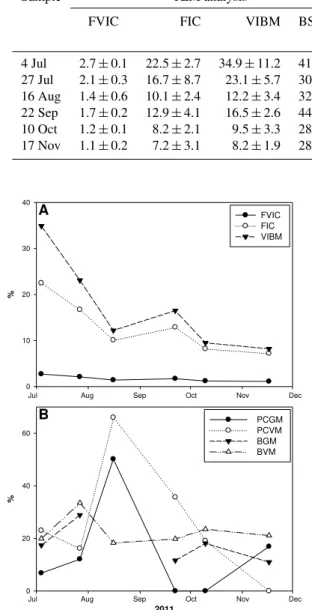
TEM analysis revealed that phages were mainly associated with oval and short rod morphotypes with an occurrence of 28 %, followed by thin rods (25 %) and cocci (19 %). The burst size of these morphotypes was on average 46 for oval morphotypes and less than 15 for the short rods. The burst size ranged from 15 to 132 in July, whereas the range was 21 to 35 in November. The average burst size ranged from 28 to 44 (mean = 32.6, Table 2). The frequency of virus-infected cells ranged from 1.1 % in November to 2.7 % in July. Sim-ilarly the FIC was relatively low in November (7.2 %) and high in July (22.5 %). The virus-induced bacterial mortal-ity was calculated to vary between 8.2 % (November) and 34.9 % (July), and there was a clear trend of decreased mor-tality from early summer to the end of fall (Fig. 3a).
Fig. 2.Vertical distribution of picocyanobacteria(A), small phytoplankton populations(B), heterotrophic bacteria(C), total virus-like parti-cles(D), VLP1(E)and VLP2(F)from July to November 2011 using flow cytometry. The white crosses in(B)refer to sampling dates. The interpolation between the data was generated automatically by SigmaPlot 12.0.
relatively high in summer (reaching 66 % in August), while it could be insignificant at other periods, i.e., in November (Ta-ble 2). Comparatively, the virus-mediated bacterial mortality ranged from 18.3 % (August) to 33.5 % (July), and no trend was recorded as for TEM-estimated values (Fig. 3b). The grazing impact varied also a lot during the period of study (from 0 to 50 %), and it was globally lower than the viral impact for both the picocyanobacteria and the heterotrophic bacteria.
3.4 Bacterial and viral production
Bacterial production (BP) ranged from 9.1 to 36.9 µgC L−1d−1. The lowest BP was measured in September and the highest in July. The BP values slowly recovered during October–November, reaching a value of 15.5 µgC L−1d−1 (Fig. 4). The lowest viral produc-tion rate was found to be 1.24×10⁷particles mL−1d−1
in July. Thereafter it increased from August to Octo-ber, reaching up to 6.28×10⁸particles mL−1d−1 in
October. Viral production decreased to approximately 5.1×10⁸particles mL−1d−1in November (Fig. 4).
3.5 Size-fractionated primary production
Table 2.Mean values for the frequency of virus-infected cells (FVIC), frequency of infected cells (FIC), virus-induced bacterial mortality (VIBM) and average burst size (BS) as estimated using transmission electron microscopy. PCGM refers to picocyanobacterial mortality due to grazing, while PCVM refers to the virus-mediated mortality of this community. BGM and BVM are as above but for the heterotrophic bacteria.
Sample TEM analysis Dilution experiments
FVIC FIC VIBM BS PCGM PCVM BGM BVM (%) (%) (%) (%) 4 Jul 2.7±0.1 22.5±2.7 34.9±11.2 41±4 6.8±5.6 23±8.2 17.4±6.8 19.9±8.1
27 Jul 2.1±0.3 16.7±8.7 23.1±5.7 30±11 12.1±10.2 16.2±12.4 28.9±13.7 33.5±15.4 16 Aug 1.4±0.6 10.1±2.4 12.2±3.4 32±7 50.2±23.8 66±31.7 NS 18.3±9.3
22 Sep 1.7±0.2 12.9±4.1 16.5±2.6 44±14 NS 35.7±11.6 11.6±3.7 19.8±8.5 10 Oct 1.2±0.1 8.2±2.1 9.5±3.3 28±8 NS 19.1±6.9 18.1±5.9 23.5±13.9 17 Nov 1.1±0.2 7.2±3.1 8.2±1.9 28±6 16.9±9.5 NS 11±4.6 21.1±10.8
%
0 10 20 30 40
FVIC FIC VIBM
2011
%
0 20 40 60
PCGM PCVM BGM BVM
Jul Aug Sep Oct Nov Dec Jul Aug Sep Oct Nov Dec
A
B
Fig. 3.Patterns of the frequency of virus-infected bacterial cells (FVIC), the frequency of infected bacterial cells (FIC) as estimated using transmission electron microscopy and the virus-induced bac-terial mortality (VIBM)(A). Grazing mortality and viral lysis on picocyanobacteria (PCGM and PCVM, respectively) and on het-erotrophic bacteria (BGM and BVM) estimated using the modified dilution technique(B).
3.6 Statistical analysis
The various environmental and biological factors showed significant seasonal variations. Summer months behaved differently with complex interactions between biological variables and physicochemical parameters. The bacterial
2e+08 4e+08 6e+08 8e+08
10 20 30 40
0 0
Fig. 4.Bacterial production (BP) and viral production (VP)
mea-sured from July to November 2011.
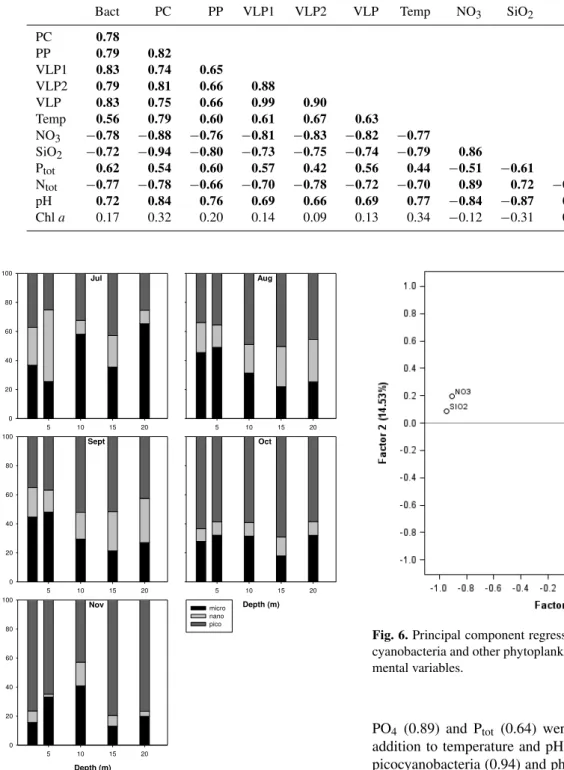
abundance was significantly correlated with picocyanobacte-ria, while picocyanobacteria were positively correlated with temperature, pH and O2, and negatively with NO3, SiO2and total phosphorus. In summer, VLP1 did not show any corre-lation with any of the biological factors including the bacte-rial abundance, but had significant correlations with physic-ochemical factors like pH and total phosphorus and negative correlation with NO3, SiO2, total phosphorus and total nitro-gen. VLP2 on the other hand displayed a significant positive correlation with picocyanobacteria and other phytoplankton. At first sight, temperature seems to be the most determining factor for planktonic abundance when compared to phospho-rus. But over the months, the relationships were more com-plex with significant correlations between important mea-sured biotic and abiotic factors, except for Chla(Table 3).
Table 3.Results of Pearson’s correlation analysis to test for empirical correspondence among estimated variables. Abbreviations are ex-plained in the main text. Significant correlations are in bold atP <0.01 atn= 42.
Bact PC PP VLP1 VLP2 VLP Temp NO3 SiO2 Ptot Ntot pH
PC 0.78
PP 0.79 0.82
VLP1 0.83 0.74 0.65
VLP2 0.79 0.81 0.66 0.88
VLP 0.83 0.75 0.66 0.99 0.90
Temp 0.56 0.79 0.60 0.61 0.67 0.63
NO3 −0.78 −0.88 −0.76 −0.81 −0.83 −0.82 −0.77
SiO2 −0.72 −0.94 −0.80 −0.73 −0.75 −0.74 −0.79 0.86
Ptot 0.62 0.54 0.60 0.57 0.42 0.56 0.44 −0.51 −0.61
Ntot −0.77 −0.78 −0.66 −0.70 −0.78 −0.72 −0.70 0.89 0.72 −0.44
pH 0.72 0.84 0.76 0.69 0.66 0.69 0.77 −0.84 −0.87 0.59 −0.74
Chla 0.17 0.32 0.20 0.14 0.09 0.13 0.34 −0.12 −0.31 0.32 −0.20 0.27
Jul
5 10 15 20
P
ri
mary
producti
on
(%
)
0 20 40 60 80 100
Aug
5 10 15 20
Sept
5 10 15 20
P
ri
mary
producti
on
(%
)
0 20 40 60 80 100
Oct
Depth (m)
5 10 15 20
Nov
Depth (m)
5 10 15 20
P
ri
mary
producti
on
(%
)
0 20 40 60 80 100
micro nano pico
Fig. 5.Fractionated primary production representing the
contribu-tion of the various size fraccontribu-tions of the phytoplankton (i.e., the pico-, nano- and microphytoplankton) at the different periods sampled.
Fig. 6.Principal component regression analysis for bacteria, pico-cyanobacteria and other phytoplankton with the rest of the environ-mental variables.
Early July Late July - September October - November
Proposed Conceptual Scheme
Abundances
Picophytoplankton
Heterotrophic bacteria
Virus
Production
Bacteria
Virus
Microphytoplankton
Nanophytoplankton
Picophytoplankton
Grazing on bacteria
Grazing on picocyano.
Viral lysis on bacteria
Viral lysis on picocyano.
Pico Grazers
Bacteria
Virus
Highest
Lowest
Highest
High
Moderate
Lowest
Moderate
High
Moderate
High
Low
Highest in October
Lowest
Low
Highest in October and November
Lowest
Low
High, 33% in July
Low
High
Highest
Moderate
Highest in August
Low
Lowest
Low
Lowest Moderate
Moderate
Moderate
Highest at 10 m in August
Highest in August
Highest in September at 2.5 m
Lowest in November
Lowest at 30 m in November
Lowest in November at 30 m Pico
Grazers
Bacteria
Virus
Pico Grazers
Bacteria
Virus
Regulation pressure Top down control: TD Bottom up control: BU
Grazing is low on het. bacteria and picophytoplankton: BU Bacterial loss due to viral lysis is high: partly TD
High grazing and viral lysis on bacteria and picophytoplankton : TD
Lowest grazing pressure and viral lysis: BU
–
Fig. 7.Conceptual scenario for the seasonal succession of two major constituents of the microbial food web (the heterotrophic bacteria and
the picophytoplankton) in upper layers (0–20 m) of Lake Geneva between July and November 2011.
regression analysis revealed that temperature, pH, NO3, Ptot, SiO2and Chlatogether with host abundances (bacteria, pic-ocyanobacteria and other phytoplankton) contributed 77 % variability in VLP1, 72 % in VLP2 and 78 % in total VLP abundances (not shown).
4 Discussion
The main aim of the present study was to shed light on eco-logical changes occurring in Lake Geneva from early sum-mer to the end of fall. How environmental changes and spe-cific biotic interactions could influence different microbial components (both in terms of abundance and activity) helped us to highlight the importance of some key parameters and viral or grazing pressure in the functioning of the microbial food web of Lake Geneva. In particular, a conceptual model could be proposed for the seasonal succession of key com-ponents of the microbial food web structure in the upper lit layer (0–20 m) of Lake Geneva between July and Novem-ber 2011 (Fig. 7).
We observed clear variations in the environmental factors such as air and water temperature, light conditions and nutri-ent concnutri-entrations. These variations impacted the abundance
Table 4.Results of the two-way ANOVA to test significant differ-ences in the abundance of bacteria, picocyanobacteria, other phy-toplankton and VLPs. Degrees of freedom are indicated as df. S = significant; NS = not significant;P <0.01.
Parameter Difference df Fvalue Significance
Bacteria months 5, 30 31.2 S
depth 6, 30 12.3 S
Picocyanobacteria months 5, 30 4.5 S
depth 6, 30 14.3 S
Other phytoplankton months 5, 30 7.1 S
depth 6, 30 2.3 NS
VLP1 months 5, 30 8.7 S
depth 6, 30 8.7 S
VLP2 months 5, 30 13.7 S
depth 6, 30 9.4 S
VLP months 5, 30 9.2 S
depth 6, 30 9.0 S
reflected in the distribution and activity of various planktonic fractions. The relationship between phosphorus concentra-tion and chlorophyll (Dillon and Rigler, 1974) suggests that phosphorus, and at times nitrogen and silicon, are limiting re-sources. Previous studies in Lake Geneva suggested that Ptot is a critical component determining dynamics of planktonic components in this lacustrine ecosystem (Anneville et al., 2002). The abundance of picocyanobacteria was high dur-ing summer months (August–September) when the nutrient concentrations were higher (Ptot being 11.0±4.9 µgP L−1
in summer) compared to autumn (8.2±1.9 µgP L−1). The
abundance of planktonic communities positively correlated with Ptot and negatively correlated with NO3. P is known as an important component in the dynamics of planktonic communities in lakes (Wetzel, 2000), but the significance of N in regulating the plankton dynamics especially in Lake Geneva has only been recently reported (Tadonléké et al., 2009). In this regard, the capacity of picocyanobacteria to use N sources like NH4/NO3 or switch over from P or N subject to the nutrient availability could be considered as an important factor in determining the plankton dynamics in this lake. It is reported that NO3 is taken up by pico-cyanobacteria in culture when NH4 is depleted (Bird and Wyman, 2003). Even though the abundance was higher in summer, picoplankton production (constituted mainly by pic-ocyanobacteria in Lake Geneva) contributed to a high per-centage (76 %) of the total primary production during au-tumn (i.e., October and November), suggesting a significant functional role of the “smalls” in Lake Geneva. This could be explained by lower nutrient concentration of total nitro-gen (280 µg L−1) and total phosphorus (10 µg L−1) during the fall period. It is reported that, when nutrients become a limiting factor, autotrophic picoplankton cells strongly com-pete with the bigger phototrophic organisms (Raven, 1988;
Callieri, 2008). Previous studies reported picocyanobacteria to be the major contributors to total primary production, with their contribution increasing with depth (Platt et al., 1983) due to greater efficiency of their auxiliary pigments (typi-cally phycoerythrin) to utilize the blue-green light (Glover et al., 1985). Long-term changes in phytoplankton compo-sition due to P loading in Lake Geneva have been found in the past (Anneville et al., 2002). However, to interpret these long-term changes, it is important to gather information on a monthly or seasonal timescale. This study reveals significant seasonal variations in the plankton dynamics which could largely be contributed to temperature, nutrient availability and the wind-induced waves as has previously been reported for peri-Alpine lakes (Vincon-Leite et al., 1989). The results obtained in the present investigation clearly suggest that pic-ocyanobacteria play a crucial role in the trophic status and ecosystem productivity of Lake Geneva as suggested in the past studies for this lake (Duhamel et al., 2006; Personnic et al., 2009a) and elsewhere (Callieri, 2010).
Among the abiotic factors, temperature and pH were the most influential factors in determining the abundance of bacteria, picocyanobacterial and other phytoplankton which contributed to their monthly variability. Both these parame-ters were positively correlated and hence play an important role in the structuring of planktonic communities in the lake. Phytoplankton reproduction rates are closely linked to tem-perature. The maximum rate of cell division doubles for each 10◦C increase in temperature. The upper limit of growth is
thus clearly demonstrates that the temperature is a key fac-tor in determining the higher abundance and distribution of phytoplankton in the euphotic layer, which in turn could in-fluence pH.
VLP abundances are linked to the physical and chem-ical characteristics through their dependence on their het-erotrophic and autotrophic hosts. VLP abundances were sig-nificantly higher in the top 20 m (euphotic) layer, and the abundances correlated with bacterial and picocyanobacterial abundances. High VBR in autumn (October and Novem-ber) and its increase with depth suggested important phage– host interactions. This may also indicate that the impact of viruses on bacteria is more significant in deeper waters than at the surface, as previously observed in this lake and other ecosystems (Weinbauer and Hofle, 1998; Colombet et al., 2006; Personnic et al., 2009a). Such relationships between these groups were clearly confirmed with the measurements of high virus induced mortality on both heterotrophic bac-teria and picocyanobacbac-teria. Previous studies have shown a tight coupling of VLP1 and VLP2 with bacterial and pic-ocyanobacterial abundance, respectively (Duhamel et al., 2006; Personnic et al., 2009b). Higher VLP abundance in the upper 20 m depth could be due to bacterial growth which was stimulated by high temperatures, pH, organic and inorganic nutrients as reported elsewhere (Weinbauer, 2004). The re-lationship of the viruses with bacteria and picocyanobacte-ria varied with respect to sampled months, suggesting shifts in the succession of hosts and viruses (Parvathi et al., 2012; Zhong et al., 2013). It is also possible that there were larger initial virioplankton and bacterioplankton populations in the summer months and at the beginning of autumn (Personnic et al., 2009a). A quite similar seasonal pattern was observed for the virioplankton in other temperate lakes, where high-est viral abundance occurred in autumn (Bettarel al., 2005; Padeep-Ram et al., 2010). Chladid not have significant cor-relation with viruses, suggesting that phytoplankton viruses did not contribute significantly to the total virus pool, and that the positive effect of an increase in chlorophylla with heterotrophic bacteria is not directly beneficial to viral pro-duction. However, we are aware that Chlarepresents only a crude approximation of the algal biomass and thus is prob-ably not the best parameter to use while attempting to iden-tify virus–host relationships (Gasol and Duarte, 2000). It is also possible that picocyanobacteria were the most domi-nant phytoplanktonic group, thus making them more avail-able for viral attachment (Jacquet et al., 2002). The dynam-ics of larger phytoplankton and their contribution to pri-mary production showed seasonal variations induced by the environmental factors. High viral production rates (up to 2.6×10⁷particles mL−1h−1) corroborated this strong viral
impact and high viral production coincided indeed with high virus induced bacterial (23 %) and picocyanobacterial (19 %) mortality. Thus, it was not surprising that for both bacteria and picocyanobacteria the loss percentage due to grazing was always lower than viral lysis (as estimated by the dilution
method when applicable). These mortality rates were com-parable with earlier reports of grazing mortality and viral lysis reported for Lake Geneva and other lakes (Weinbauer and Hofle, 1998; Bettarel et al., 2004; Duhamel et al., 2006; Personnic et al., 2009b). All in all, it was found that viral ac-tivity was particularly high in autumn, and covaried with the picoplankton production during the same time period, a re-sult already suggested for these peri-Alpine lakes (Personnic et al., 2009a, b).
All together, results obtained in the context of this study made possible the construction of a conceptual scenario for the seasonal succession of viral and plankton abundance and production as well as the importance of the abiotic and biotic parameters in the upper layers (0–20 m) of Lake Geneva be-tween July and November 2011 (Fig. 7). The validity of such a model remains to be tested for other years.
5 Conclusions
The present study highlighted complex relationships among the microbial components of Lake Geneva where physical, chemical and biotic interactions intervene in the dynamics and activity of the picoplankton size community. The results clearly suggest that the picophytoplanktonic size fraction can be responsible for a significant part of the production of this lake and also show how viral action can be a driving force in the dynamics of the picoplankton (through virus-induced pic-ocyanobacterial and heterotrophic bacterial mortality). Lake Geneva can be considered as a model ecosystem for large and deep temperate lakes, and our analysis, even though limited to only a few months during a single year, strongly highlights the importance of considering the viral component in fresh-water plankton ecology.
Acknowledgements. A. Parvathi is grateful to the Director of NIO, Goa, and Scientist-in-charge, NIO, RC, Kochi for their moral support. For A. Parvathi this is NIO contribution number 5536. A. Parvathi was supported by a fellowship provided by INRA. X. Zhong was supported by a fellowship from Région Rhône-Alpes. We are thankful to Pascal Perney, Pascal Chifflet and Jean-Christophe Hustache for sampling onboard and technical assistance. We also thank Dr. Pomati, Dr. Hipsey and another anonymous reviewer for the constructive comments they provided to improve this manuscript. Environmental data were obtained from INRA CARRTEL observatory databasis referred to as IS SOERE GLACPE.
References
Anneville, O., Souissi, S., Ibanez, F., Ginot, V., Druart, J. C., and Angeli, N.: Temporal mapping of phytoplankton assemblages in Lake Geneva: Annual and interannual changes in their patterns of succession, Limnol. Oceanogr., 47, 1355–1366, 2002. Anneville, O., Gammeter, S., and Straile, D.: Phosphorus decrease
and climate variability: mediator of synchrony in phytoplankton changes among European peri-alpine lakes, Freshwater Biol., 50, 1731–1746, 2005.
Anneville, O., Molinero, J. C., Souissi, S., Balvay, G., and Gerdeaux D.: Long-term changes in the copepod community of Lake Geneva, J. Plankton Res., 29, 49–59, 2007.
Anneville, A., Beniston, M., Gallina, N., Gillet, C., Jacquet, S., and Perroud, M.: L’empreinte du changement climatique dans le Lé-man, Arch. Sci., 66, 157–172, 2013.
Auguet, J. C., Barberan, A., and Casamayor, E. O.: Global ecologi-cal patterns in uncultured archaea, ISME J., 4, 182–190, 2010. Azam, F., Fenchel, T., Field, J. G., Gray, J. S., Meyer-Reil, L. A.,
and Thingstad, F.: The ecological role of watercolumn microbes in the sea, Mar. Ecol.-Prog. Ser., 10, 257–263, 1983.
Berdjeb, L., Pollet, T., Domaizon, I., and Jacquet, S.: Effects of grazers and viruses on bacterial community structure and pro-duction in two contrasting trophic lakes, BMC Microb., 11, 1–18, 2011.
Bettarel, Y., Sime-Ngando, T., Amblard, C., and Dolan, J. R.: Vi-ral activity in two contrasting lake ecosystems, Appl. Environ. Microbiol., 70, 2941–2951, 2004.
Bettarel, Y., Sime-Ngando, T., Bouvy, M., Arfi, R., and Amblard, C.: Low consumption of virus-sized particles by heterotrophic nanoflagellates in two lakes of the French Massif Central, Aquat. Microb. Ecol., 39, 205–209, 2005.
Binder, B. J.: Reconsidering the relationship between virally-induced bacterial mortality and frequency of infected cells, Aquat. Microb. Ecol., 18, 207–215, 1999.
Bird, C. and Wyman, M.: Nitrate/nitrite assimilation system of the marine cyanobacteriumSynechococcussp. strain WH8103: Ef-fect of nitrogen source and availability on gene expression, Appl. Environ. Microbiol., 69, 7009–7018, 2003.
Breitbart, M.: Marine viruses: truth or dare, Ann. Rev. Mar. Sci., 4, 425–448, 2012.
Callieri, C.: Picophytoplankton in freshwater ecosystems: the im-portance of small-sized phototrophs, Freshwater Rev., 1, 1–28, 2008.
Callieri, C.: Single cells and microcolonies of freshwater pico-cyanobacteria: a common ecology, J. Limnol., 69, 257–277, 2010.
Callieri, C. and Stockner, J. G.: Freshwater autotrophic picoplank-ton: a review, J. Limnol., 61, 1–14, 2002.
Chen, C. Y. and Durbin, E. G.: Effects of pH on the growth and carbon uptake of marine phytoplankton, Mar. Ecol.-Prog. Ser., 109, 83–94, 1994.
Clasen, J. L., Brigden, S. M., Payet, J. P., and Suttle, C. A.: Evidence that viral abundance across oceans and lakes is driven by differ-ent biological factors, Freshwater Biol., 53, 1090–1100, 2008. Colombet, J., Sime-Ngando, T., Cauchie, H. M., Fonty, G.,
Hoff-mann, L., and Demeure, G.: Depth-related gradients of viral ac-tivity in Lake Pavin, Appl. Environ. Microbiol., 72 , 4440–4445, 2006.
Dilon, P. J. and Rigler, F. H.: The phosphorus-chlorophyll relation-ship in lakes, Limnol. Oceanogr. 19, 767–773, 1974.
Duhamel, S. and Jacquet, S.: Flow cytometric analysis of bacteria-and virus-like particles in lake sediments, J. Microbiol. Meth., 64, 316–322, 2006.
Duhamel, S., Zeman, F., and Thierry, M.: A dual-labeling method for the simultaneous measurement of dissolved inorganic car-bon and phosphate uptake by marine planktonic species, Limnol. Oceanogr. Meth., 4, 416–425, 2005.
Duhamel, S., Domaizon, I., Personnic, S., and Jacquet, S.: Assess-ing the microbial community dynamics and the role of viruses as bacterial mortality agents in Lake Geneva, J. Water Sci., 19, 115–126, 2006.
Evans, C., Archer, S. D., Jacquet, S., and Wilson, W. H.: Direct estimates of the contribution of viral lysis and microzooplankton grazing to the decline of aMicromonasspp. population, Aquat. Microb. Ecol., 30, 207–219, 2003.
Fuhrman, J. A. and Noble, R. T.: Viruses and protists cause similar bacterial mortality in coastal seawater, Limnol. Oceanogr., 40, 1236–1242, 1995.
Gasol, J. M. and Duarte, C. M.: Comparative analyses in aquatic microbial ecology: how far do they go?, FEMS Microbiol. Ecol., 31, 99–106, 2000.
Glover, H. E., Phinney, D. A., and Yentsch, C. S.: Photosynthetic characteristics of picoplankton compared with those of higher phytoplankton populations in various water masses in the Gulf of Maine, Biol. Oceanogr., 3, 223–248, 1985.
Goldman, J. C.: Temperature effects on phytoplankton growth in continuous culture, Limnol. Ocean., 22, 932–935, 1977. Harris, G. P.: Phytoplankton ecology: Structure, function, and
fluc-tuationm Chapman and Hall, London, UK, 1986.
Hutchinson, G. E.: A treatise on limnology, Vol. 2, Wiley, New York, 1967.
Ishiguro, N. and Balvay, G.: L’écoulement des eaux du Rhône dans le lac Léman, Archs Sci. Genève, 56, 117–126, 2003.
Jacquet, S., Havskum, H., Thingstad, F. T., and Vaulot, D.: Effect of inorganic and organic nutrient addition on a coastal microbial community (Isefjord, Denmark), Mar. Ecol.-Prog. Ser., 228, 3– 14, 2002.
Jacquet, S., Miki, T., Noble, R., Peduzzi, P., and Wilhelm, S.: Viruses in aquatic ecosystems: important advancements of the last 20 years and prospects for the future in microbial oceanog-raphy and limnology, Adv. Oceanogr. Limnol., 1, 71–101, 2010. Jacquet, S., Barbet, D., Cachera, S., Caudron, A., Colon, M., Girel, C., Guillard, J., Hébert, A., Kerrien, F., Laine, L., Lazzarotto, J., Moille, J.-P., Paolini, G., Perga, M.-E., Perney, P., and Rimet, F.: Suivi environnemental des eaux du lac du Bourget pour l’année 2011, Rapport INRA-CISALB-CALB, p. 220, 2012.
Jacquet, S., Dorigo, U., and Personnic, S.: A few tests prior to flow cytometry and epifluorescence analyses of freshwater bacterio-and virioplankton communities, in: Flow Cytometry: Principles, Methodology and Applications, Chapter 1, Related Nova publi-cation, Nova Publishers Inc., New York, 1–30, 2013.
Kimmance, S. A., Wilson, W. H., and Archer, S. D.: Modified dilu-tion technique to estimate viral versus grazing mortality of phy-toplankton: limitations associated with method sensitivity in nat-ural waters, Aquat. Microb. Ecol., 49, 207–222, 2007.
Lazzarotto, J. and Klein, A.: Evolution physico-chimique des eaux du Léman, rapport CIPEL pour l’année 2011, 26–50, 2012. Lemmin, U., Fer, I., and Perrinjaquet, C.: Courantologie lémanique:
le refroidissement hivernal, in: Découvrir le Léman 100 ans après François-Alphonse Forel, Actes du colloque pluridisciplinaire, Editions Slatkine, Nyon-Genève, 53–67, 1999.
Li, W. K. W., Subba-Rao, D. V., Harrison, W. G., Smith, J. C., Cullen, J. J., Irwin, B., and Platt, T.: Autotrophic picoplankton in the tropical ocean, Science, 219, 292–295, 1983.
Maranger, R. and Bird, D. F.: Viral abundance in aquatic systems: a comparison between marine and fresh waters, Mar. Ecol.-Prog. Ser., 121, 217–226, 1995.
Olson, R. J., Chisholm, S. W., Zettler, E. R., Altabet, M., and Dusen-berry, J.: Spatial and temporal distributions of prochlorophyte picoplankton in the North Atlantic ocean, Deep-Sea Res., 37, 1033–1051, 1990.
Parvathi, A., Zhong, X., and Jacquet, S.: Dynamics of various vi-ral groups infecting autotrophic plankton in Lake Geneva, Adv. Ocean. Limnol., 3, 171–191, 2012.
Pelletier, J. P. and Orand, A.: Appareil de prelevement d’un echan-tillon dans un fluide, INRA Patent number 1978 76.08579, 1978. Personnic, S., Domaizon, I., Dorigo, U., Berdjeb, L., and Jacquet, S.: Seasonal and spatial variability of virio-, bacterio, and pico-phytoplanktonic abundances in three peri-alpine lakes, Hydrobi-ologia, 627, 99–116, 2009a.
Personnic, S., Domaizon, I., Sime-Ngando, T., and Jacquet, S.: Seasonal variations of microbial abundances and of virus-vs. flagellate- induced mortality of picophytoplankton in some peri-alpine lakes, J. Plankton Res., 31, 1161–1177, 2009b. Platt, T., Subba-Rao, D. V., and Irwin, B.: Photosynthesis of
pi-coplankton in the oligotrophic ocean, Nature, 300, 701–704, 1983.
Pradeep Ram, A. S., Boucher, D., Sime-Ngando, T., Debroas, D., and Romagoux, J. C.: Phage bacteriolysis, protistan bacterivory, and bacterial production in a freshwater reservoir: coupling with temperature, Microb. Ecol., 50, 64–72, 2005.
Pradeep Ram, A. S., Arnous, B., Danger, M., Carrias, J. F., Lacroix, G., and Sime-Ngando, T.: High and differential viral infection rates within bacterial ’morphopopulations’ in a shallow sand pit lake (Lac de Creteil, France), FEMS Microbiol. Ecol., 74, 83–92, 2010.
Raven, J. A.: The twelfth Tansley Lecture: Small is beautiful: The picophytoplankton, Funct. Ecol., 12, 503–513, 1998.
Rushansky, N. M., Berman, T., Berner T., Yacobi, Y. Z., and Dubin-sky, A. Z.: Physiological characteristics of picophytoplankton, isolated from Lake Kinneret: responses to light and temperature, J. Plankton Res., 24, 1173–1183, 2002.
Sarmiento, J. L. and Gruber, N.: Ocean Biogeochemical Dynamics, Princeton University Press, Princeton, New Jersey, USA, 2006. Shapiro, J: Current beliefs regarding dominance by blue-greens: the
case for the importance of CO2and pH, Verhand. Int. Ver. Theor. Angew. Limnol., 24, 38–54, 1990.
Sime-Ngando, T., Mignot, J. P., Amblard, C., Bourdier, G., Desvilettes, C., and Quiblier-Lloberas, C.: Charactérisation des particules virales planctoniques dans un lac du Massif Central Français: Aspects méthodologiques et premiers résultats, An-nales de Limnology – International Journal of Limnology, 32, 259–263, 1996.
Stockner, J. G. and Porter, K. G.: Microbial food webs in fresh water planktonic ecosystems, in: Complex interactions in lake commu-nities, edited by: Carpenter, S. R., Springer-Verlag, New York, 69–83, 1988.
Suttle, C. A.: Viruses in the sea, Nature, 437, 356–361, 2005. Tadonléké, D. R.: Evidence of warming effects on phytoplankton
productivity rates and their dependence on eutrophication status, Limnol. Oceanogr., 55, 973–982, 2010.
Tadonléké, D. R., Planas, D., and Lucotte, M.: Microbial food web in boreal humic lakes and reservoirs: ciliates as a major factor related to the dynamics of the most active bacteria, Microb. Ecol., 49, 325–341, 2005.
Tadonléké, D. R., Lazzarotto, J., Anneville, O., and Druart, J.-C.: Phytoplankton productivity increased in Lake Geneva despite phosphorus loading reduction, J. Plankton Res., 31, 1179–1194, 2009.
Thomas, R., Berdjeb, L., Sime Ngando, T., and Jacquet, S.: Viral abundance, production, decay rates and life strategies (lysogeny versus lysis) in Lake Bourget (France), Environ. Microbiol., 13, 616–630, 2011.
Utermöhl, H.: Neue Wege in der quantitativen Erfassung des Planktons (mit besonderer Berücksichtigung des Ultraplank-tons), Verh. Int. Ver. Theor. Angew. Limnol., 5, 567–596, 1931. Vincon-Leite, B., Mouchel, J. M., and Tassin, B.: Modelisation
de l’evolution thermique saisonniere du lac du Bourget (Savoie, France), Rev. Des. Sci., 2, 483–510, 1989.
Weinbauer, M. G.: Ecology of prokaryotic viruses, FEMS Micro-biol. Rev., 28, 127–181, 2004.
Weinbauer, M. G. and HÖfle, M. G.: Significance of viral lysis and flagellate grazing as factors controlling bacterioplankton produc-tion in a eutrophic lake, Appl. Environ. Microbiol., 64, 431–438, 1998.
Weinbauer, M. G. and Suttle, C. A.: Comparison of epi-fluorescence and transmission electron microscopy for counting viruses in nat-ural marine waters, Aquat. Microb. Ecol., 13, 225–232, 1997. Weinbauer, M. G., Winter, C., and Hofle, M.: Reconsidering
trans-mission electron microscopy based estimates of viral infection of bacterioplankton using conversion factors derived from natu-ral communities, Aquat. Microb. Ecol., 27, 103–110, 2002. Wetzel, R. G.: Limnology, lake and river ecosystems, Academic
Press, 3rd Edn., London, UK, p. 1006, 2000.
Whitman, W. B., Coleman, D. C., and Wiebe, W. J.: Prokaryotes: the unseen majority, P. Natl. Acad. Sci., 95, 6578–6583, 1998. Wilhelm, S. W., Brigden, S. M., and Suttle, C. A.: A dilution
tech-nique for the direct measurement of viral production: a compari-son in stratified and tidally mixed coastal waters, Microb. Ecol., 43, 168–173, 2002.
Worden, A. Z., Nolan, J. K., and Palenik, B.: Assessing the dynam-ics and ecology of marine picophytoplankton: the importance of the eukaryotic component, Limnol. Oceanogr., 49, 168–179, 2004.