www.atmos-chem-phys.net/11/12067/2011/ doi:10.5194/acp-11-12067-2011
© Author(s) 2011. CC Attribution 3.0 License.
Chemistry
and Physics
Fossil versus contemporary sources of fine elemental and organic
carbonaceous particulate matter during the DAURE campaign in
Northeast Spain
M. C. Minguill´on1,2, N. Perron1,*, X. Querol2, S. Szidat3,4, S. M. Fahrni1,3,4, A. Alastuey2, J. L. Jimenez5,6, C. Mohr1, A. M. Ortega6,7, D. A. Day5,6, V. A. Lanz1, L. Wacker8, C. Reche2, M. Cusack2, F. Amato2, G. Kiss9, A. Hoffer9, S. Decesari10, F. Moretti10, R. Hillamo11, K. Teinil¨a11, R. Seco12,**, J. Pe ˜nuelas12, A. Metzger13, S. Schallhart13, M. M ¨uller13, A. Hansel13, J. F. Burkhart14, U. Baltensperger1, and A. S. H. Pr´evˆot1
1Paul Scherrer Institut, Laboratory of Atmospheric Chemistry, 5232 Villigen PSI, Switzerland 2Institute of Environmental Assessment and Water Research (IDAEA), CSIC, 08034 Barcelona, Spain 3Dept. of Chemistry and Biochemistry, University of Bern, 3012 Berne, Switzerland
4Oeschger Centre for Climate Change Research, University of Bern, 3012 Berne, Switzerland 5Dept. of Chemistry and Biochemistry, University of Colorado, Boulder, CO, USA
6Cooperative Institute for Research in Environmental Sciences (CIRES), USA
7Dept. of Atmospheric and Oceanic Science, University of Colorado, Boulder, CO, USA 8Laboratory of Ion Beam Physics, ETH H¨onggerberg, 8093 Zurich, Switzerland
9Air Chemistry Group of the Hungarian Academy of Sciences, University of Pannonia, 8201 Veszpr´em, Hungary 10Institute for Atmospheric Sciences and Climate (ISAC), CNR, Bologna, Italy
11Finnish Meteorological Institute, Air Quality Research, 00101 Helsinki, Finland
12Unitat d’Ecologia Global CREAF-CEAB-CSIC, Centre de Recerca Ecol`ogica i Aplicacions Forestals (CREAF),
Universitat Aut`onoma de Barcelona, 08193 Bellaterra, Barcelona, Spain
13Institute of Ion Physics and Applied Physics, Innsbruck University, 6020 Innsbruck, Austria 14Norwegian Institute for Air Research (NILU), 2027 Kjeller, Norway
*now at: Dept. of Nuclear Physics, University of Lund, 221 00 Lund, Sweden
**now at: Atmospheric Chemistry Division, National Center for Atmospheric Research, Boulder, CO 80301, USA
Received: 26 July 2011 – Published in Atmos. Chem. Phys. Discuss.: 19 August 2011 Revised: 28 October 2011 – Accepted: 16 November 2011 – Published: 6 December 2011
Abstract. We present results from the international field campaign DAURE (Determination of the sources of atmo-spheric Aerosols in Urban and Rural Environments in the Western Mediterranean), with the objective of apportion-ing the sources of fine carbonaceous aerosols. Submicron fine particulate matter (PM1) samples were collected
dur-ing February–March 2009 and July 2009 at an urban back-ground site in Barcelona (BCN) and at a forested regional background site in Montseny (MSY). We present radiocar-bon (14C) analysis for elemental and organic carbon (EC and OC) and source apportionment for these data. We combine the results with those from component analysis of aerosol mass spectrometer (AMS) measurements, and
Correspondence to:M. C. Minguill´on
(mariacruz.minguillon@idaea.csic.es)
compare to levoglucosan-based estimates of biomass burn-ing OC, source apportionment of filter data with inorganic composition + EC + OC, submicron bulk potassium (K) con-centrations, and gaseous acetonitrile concentrations.
biogenic secondary OC at MSY only increased by ∼40 % compared to the order-of-magnitude increase observed for biogenic volatile organic compounds (VOCs) between win-ter and summer, which highlights the uncertainties in the estimation of that component. Biomass burning contribu-tions estimated using the 14C technique ranged from simi-lar to slightly higher than when estimated using other tech-niques, and the different estimations were highly or moder-ately correlated. Differences can be explained by the contri-bution of secondary organic matter (not included in the pri-mary biomass burning source estimates), and/or by an over-estimation of the biomass burning OC contribution by the
14C technique if the estimated biomass burning EC/OC ratio
used for the calculations is too high for this region. Acetoni-trile concentrations correlate well with the biomass burning EC determined by14C. K is a noisy tracer for biomass burn-ing.
1 Introduction
Ambient aerosols have adverse effects on human health (e.g., Nel, 2005; Pope and Dockery, 2006; Krzyzanowski and Co-hen, 2008). They also affect climate through their direct (ab-sorption and scattering) and indirect (cloud interactions) ef-fects on the Earth’s radiative balance (Forster et al., 2007), ecosystems and crops through their deposition of acids, tox-ics, and nutrients (e.g., Matson et al. 2002; Grantz et al., 2003), and regional visibility (e.g., Watson, 2002).
Submicron particulate matter (PM1, particles with an
aero-dynamic diameter <1 µm) contains substantial fractions of carbonaceous aerosol (Murphy et al., 2006; Jimenez et al., 2009). Carbonaceous aerosol comprises a wide variety of or-ganic compounds, collectively referred to as oror-ganic matter (OM), elemental carbon (EC), and carbonate mineral dust, the latter typically being negligible in submicron aerosol since it is mainly present in the coarse fraction (Sillanp¨a¨a et al., 2005).
Carbonaceous aerosols are responsible for some of the adverse effects on human health produced by particles (Li et al., 2003; Mauderly and Chow, 2008). Some organic compounds are respiratory irritants (such as carbonyls and acids), carcinogens (such as polycyclic aromatic hydrocar-bons (PAHs)), and toxins (Mauderly and Chow, 2008). EC induces respiratory and cardiovascular problems (Highwood and Kinnersley, 2006; and references therein) and may ad-sorb toxic or carcinogenic organic species which may then be absorbed into lung tissue (Gerde et al., 2001).
An accurate knowledge of the sources of EC and OM is necessary to design strategies aimed at mitigating the ef-fects of aerosols. Known sources of carbonaceous aerosols are biomass, biofuel, and waste burning, residential heat-ing, cookheat-ing, fossil-fuel combustion (including road traf-fic emissions), and biogenic emissions (Hildemann et al.,
1994; Schauer et al., 1996). Biogenic emissions contribute to primary organic aerosol (POA) and secondary organic aerosol (SOA), which is formed from biogenic gases such as isoprene and monoterpenes. Biogenic POA is dominantly in the supermicron mode while biogenic SOA is concentrated in the submicron mode (P¨oschl et al., 2010).
Radiocarbon (14C) analysis is a powerful tool used to help apportion the sources of carbonaceous aerosols (Cur-rie, 2000; Szidat, 2009), due to its ability to differentiate be-tween aerosol carbon arising from contemporary and fossil sources. In contemporary carbonaceous sources14C is found
at levels similar to those in CO2 in the present-day
atmo-sphere, or higher for sources of “stored carbon” such as wood burning. In contrast, in fossil sources, whose age greatly ex-ceeds the half-life of14C (5730 years),14C has completely decayed. The radiocarbon content of a carbonaceous sample is expressed as the “fraction of modern carbon” (fM), and is referenced to the ratio14C/12C in atmospheric CO2in the
year 1950 (Stuiver and Polach, 1977): fM = (
14C/12C) sample
(14C/12C)AD1950
(1) Values of fM range from zero for fossil sources to more than one for contemporary sources. The fM for contemporary sources exceeds unity due to the atmospheric nuclear weapon tests in the 1950s and 1960s that significantly increased the radiocarbon content of the atmosphere (Levin et al., 2010). Here we will use the term “modern carbon” only to refer to measurements relative to the 1950 standard, and the terms “contemporary” or “non-fossil,” and “fossil” carbon to refer to quantities after correction of the excess bomb radiocarbon. Since EC and OC may have different sources, source appor-tionment of EC and OC separately (as opposed to only total carbon, TC) provides additional valuable information.
Several previous studies have reported contemporary and fossil fractions of carbonaceous aerosols in urban and rural European areas in PM1, PM2.5, PM10 and Total Suspended
with respect to Europe. Finally, in Mexico City the fossil contribution to OC was higher than that found in European or Asian areas (49–62 %), even during high-fire periods (Ta-ble 1).
The present study is part of the international field cam-paign DAURE (Determination of the sources of atmospheric Aerosols in Urban and Rural Environments in the Western Mediterranean) (Pandolfi et al., 2011b; Jorba et al., 2011; http://tinyurl.com/daure09). The objective of DAURE is to study the causes of regional scale aerosol pollution episodes during winter and summer in the Western Mediterranean Basin (WMB). The WMB presents unique atmospheric dy-namics regulated by complex climatic and orographic effects which control the concentration, composition and transport of PM (Mill´an et al., 1997). In general, in summertime, local circulation dominates the atmospheric dynamics over the WMB, enhancing the regional accumulation of pollu-tants and the stratification of polluted air masses (Mill´an et al., 1997). In winter, the inflow of clean Atlantic air masses into the WMB favors the reduction of pollution levels. How-ever, during some periods characterized by winter anticy-clonic conditions, pollution from the coast and valleys is accumulated due to thermal inversions persisting for a few days. After several days under anticyclonic conditions local upslope breezes can be driven by solar radiation pushing pol-luted air masses from the valley towards rural mountainous areas, thereby markedly increasing the PM levels in the ru-ral mountainous areas (P´erez et al., 2008a; Pey et al., 2009, 2010). Specific scenarios during the campaign are described later. Together with these transport scenarios, the large emis-sions from the densely populated and industrialized areas, sporadic forest fires, and large shipping emissions give rise to a complex phenomenology for aerosol formation and trans-formation.
In this context, the present work focuses on characterizing the sources of fine carbonaceous aerosols, by using the14C method and comparing it to results from other apportionment methods such as receptor modeling of filter PM measure-ments (inorganic composition, EC and OC concentrations) and Aerosol Mass Spectrometer (AMS) data, and biomass burning source estimates from levoglucosan measurements. This is the first time that these techniques have been applied simultaneously in the Mediterranean region.
2 Methodology
2.1 Sampling
Two sampling sites were selected: Barcelona (BCN), an ur-ban background site (41◦23′24′′N 02◦06′58′′E, 80 m a.s.l.), and Montseny (MSY), a forested regional background site 50 km away from Barcelona (41◦46′46′′N 02◦21′29′′E, 720 m a.s.l.), which is part of the European Supersite for Atmospheric Aerosol Research (EUSAAR) network (http:
//www.eusaar.net). Sampling was carried out during two dif-ferent seasons: February–March 2009, called the DAURE winter campaign (DAURE-W), and July 2009, called the DAURE summer campaign (DAURE-S).
Submicron fine particulate matter (PM1) samples were
collected on quartz fiber filters (Munktell in DAURE-W and Pallflex 2500QAT-UP in DAURE-S) using DIGITEL (DH-77 in DAURE-W and DHA-80 in DAURE-S) high volume (30 m3h−1) samplers with a PM
1impactor inlet. Sampling
periods were 48 h in winter and 24 h in summer. We at-tempted to minimize artefacts after sampling by keeping the samples at−20◦C after sampling and prior to analysis.
With the instrumentation deployed during this study it is not possible to estimate the possible sampling artefacts, which are both positive (capture of semivolatile gases in the filter) and negative (evaporation of semivolatile particle species). For quartz filters one might rather expect positive artefacts. Those are however not expected to be very large at high OC loadings. Here we assume that the possible sampling arte-facts (evaporated or condensed material) have the same fM as that of the original particle material, i.e. we assumed that the artefacts do not affect the fM results. From all samples col-lected, 7 samples from each site were selected from DAURE-W and 6 from DAURE-S. These 26 samples were used for
14C analysis. Selection of the samples was based upon
si-multaneous availability of samples at both sites, preliminary results (at the time of sample selection) from AMS measure-ments (only winter), and the EC and OC concentrations, to investigate different atmospheric scenarios. Two blank filters were processed and analyzed following the same methodol-ogy as the collected samples and concentrations were sub-tracted to those found for the samples in order to calculate the ambient concentrations. All the concentrations are re-ported under ambient temperature and pressure conditions.
NOx concentrations were measured at both sites by
con-ventional gas phase air pollution monitors (Thermo Scien-tific, Model 42i) by the Department of the Environment of the Generalitat de Catalunya.
2.2 Analyses of EC and OC and intercomparison
EC and OC concentrations were determined using the 26 samples collected for14C analysis plus the two blank filters by a thermo-optical method with a Sunset OC/EC Field An-alyzer (RT 3080, Sunset Laboratory Inc., USA), which was used off-line (Bae et al., 2004). The EUSAAR2 protocol (Cavalli et al., 2010) was used. These results will be referred to as Sunset1. Blank OC concentrations were 4–23 % (11 % on average) of the sample concentrations and blank EC con-centrations were below 0.1 % of the sample concon-centrations. These Sunset1 concentrations of EC and OC were compared to other measurements:
EUSAAR2 protocol. In DAURE-S, the analysis was carried out on the same filters used for Sunset1. In DAURE-W, it was carried out on PM112 h samples
col-lected on quartz fiber filters (Munktell) using high vol-ume (30 m3h−1) samplers (DIGITEL DHA-80). These results will be referred to as Sunset2.
– EC and OC concentrations measured by gauge pressure in a calibrated volume during the EC and OC separation and collection for subsequent14C analysis (Szidat et al., 2004b, see description in Sect. 2.3).
– OC concentrations calculated from OM concentrations measured by AMS (method details in Aiken et al., 2008) in DAURE-W. The calculations were done using OM:OC ratios determined by high-resolution analysis of the AMS mass spectra. On average, the OM:OC ratio was 1.6 at BCN and 2.0 at MSY. The specific OM:OC ratios for different OA components were very similar: 1.29 at MSY and 1.21 at BCN for hydrocarbon-like or-ganic aerosol (HOA); 1.52 at MSY and 1.53 at BCN for biomass burning organic aerosol (BBOA); 2.04 at MSY for oxygenated organic aerosol (OOA) and 1.61 (semi-volatile OOA, SV-OOA) and 2.14 (low-volatility OOA, LV-OOA) at BCN.
– EC concentrations measured by the Sunset instrument during the CO2collection for14C measurements
corre-sponding to the third stage of the thermal program, as explained in Sect. 2.3.
– Black carbon concentrations measured by a Multi An-gle Absorption Photometer (MAAP) with a PM10
in-let. Absorption coefficients used were 10.4 m2g−1and
9.2 m2g−1for MSY and BCN, respectively (Pandolfi et
al., 2011a; Reche et al., 2011)
The results are generally consistent within the uncertainties in the different measurements, especially in terms of trends, while some differences in the absolute magnitudes are ap-parent (Fig. S1). At BCN the bulk OC from the AMS was substantially higher than that measured by the rest of the in-struments (Fig. S1), which we attribute to higher than usual uncertainties in the calibration of that instrument due to cus-tom modifications of the ionization region. Therefore abso-lute concentrations of OC from different sources calculated based on these different measurements should be compared with caution, while fractional contributions should be more directly comparable. In the following, the EC and OC con-centrations used are those measured by the Sunset1 instru-ment (using the samples collected for14C analysis), unless otherwise specified. Associated error bars of EC and OC measured by Sunset1 lower than 20 % of the concentration were increased to 20 % to better reflect the uncertainty in the measurements, shown by the differences among differ-ent methods (Fig. S1) and based on round-robin tests within
the EUSAAR project (EUSAAR Deliverable NA2/D10 new report).
2.3 Separation of carbonaceous fractions and14C measurements
The method for the separation of carbonaceous particle frac-tions is based on the different chemical and thermal behavior of OC and EC in the presence of oxygen gas as shown by La-vanchy et al. (1999). This separation is complicated by the fact that there is not a clear boundary between OC and EC, since OC compounds are less volatile and more optically ab-sorptive with increasing molecular weight and functionality; and the least refractory part of EC may show similar chemi-cal and physichemi-cal behavior as high molecular weight OC. The separation method has been described in detail elsewhere (Szidat et al., 2004a). Briefly, OC is oxidized on a filter at 340◦C in a stream of pure oxygen for 10 min. Evolved CO2
is trapped cryogenically, quantified manometrically in a cali-brated volume, and sealed in ampoules for14C measurement. Using this method, part of the OC pyrolyses on the filter to form refractory material (an artifact known as “charring”) and is therefore not collected. This approach assumes iden-tical fM of the measured and the neglected fraction, which was shown to be correct for “Urban Dust” in NIST reference material SRM 1649a (Szidat et al., 2004b). The uncertainty due to this loss of OC can be estimated as 0.03 (absolute value) of fMOC. This is based on an estimation of∼20 %
of OC losses and fMECmeasurements with and without
wa-ter extraction prior to CO2collection (Szidat et al., 2004a).
Therefore, the uncertainties reported here take into account the14C measurement uncertainty (see explanation in the end of this section) and this charring uncertainty of 0.03.
Isolation of EC for accurate14C determination targets a complete removal of OC prior to EC collection with the best possible EC recovery. Since the modern fractions of EC and OC can differ significantly (e.g. Szidat et al., 2004a, 2009), incomplete OC removal could bias the result of the fM in the EC fraction (fMEC). For this study, a new method for EC
Table 1.Compilation of literature values of % fossil carbon in different fractions and sites and results from the present study.
Reference Fraction Location Comments EC method∗ EC or BC OC TC
Szidat et al., 2006 PM10 Zurich urban summer Theodore 94 31
winter 75 32
spring 88 28
Szidat et al., 2007 PM10 Alpine Valleys winter Theodore 29–96 9–28
Szidat et al., 2007 PM1 Alpine Valleys spring Theodore 27–82 9–58
Perron et al., 2010 PM10 Industrial Alpine Valley winter Theodore 53–82 16–45
Szidat et al., 2009 PM10 Sweden urban summer Theodore 84–97 31–47
winter 87–91 35–45
Szidat et al., 2009 PM2.5 Sweden rural winter Theodore 64–70 35–40
Zencak et al., 2007 TSP Sweden background winter BC, CTO375 12
Zencak et al., 2007 TSP Sweden urban winter BC, CTO375 30
Andersson et al., 2011 TSP Sweden background winter BC, CTO375 62
autumn 55
Andersson et al., 2011 TSP Sweden urban winter BC, CTO375 57
autumn 65
Gilardoni et al., 2011 PM2.5 Italy rural year None, 52 22
calculated indirectly
Gelencser et al., 2007 PM2.5 Aveiro, Portugal, rural winter None, 17 20
summer calculated indirectly 92 17
Gelencs´er et al., 2007 PM2.5 Puy de Dome, winter None, 94 26
France, elevated rural summer calculated indirectly 97 14
Gelencs´er et al., 2007 PM2.5 Schauinsland, winter None, 86 15
Germany, elevated rural summer calculated indirectly 95 17
Gelencs´er et al., 2007 PM2.5 Sonnblick (Austrian Alps), winter None, 80 29
free troposphere summer calculated indirectly 95 16
Gelencs´er et al., 2007 PM2.5 K-Puszta, Hungary, rural winter None, 59 25
summer calculated indirectly 90 10
Gustaffson et al., 2009 TSP Maldives rural winter BC, CTO375 31
Gustaffson et al., 2009 TSP West India mountain spring BC, CTO375 36
Handa et al., 2010 PM10 Okinawa Island, Japan Asian dust event BC, CTO375 59 38
(spring)
non Asian dust BC, CTO375 33 6
event (spring)
Aiken et al., 2010 PM1 Mexico City low fire – 62 72
(winter-spring)
high fire – 49 59
(winter-spring)
This study PM1 Barcelona urban summer Modified 91 48
winter 87 40
This study PM1 Montseny rural summer Modified 79 25
winter 66 31
∗Method for isolating the elemental carbon: Theodore method (Szidat et al., 2004a and b) has yields of 60–80 % of the total EC determined
program is set to minimize a possible negative artifact result-ing from removal of the least refractory part of EC in the first thermal steps prior to EC collection. This method al-lows us to collect more EC compared to the 60–80 % recov-ery obtained with the Szidat et al. (2004a) method and the fM obtained are thus more representative of the complete EC fraction. The EC recovery was on average 90 % and 86 % for DAURE-W and DAURE-S, respectively. A rough esti-mate of the uncertainty generated by the 10–14 % EC loss would be an underestimation of fMECby 0.02–0.04 (Perron,
2010), which results in<5 % (absolute percent) possible un-derestimation of the biomass burning EC contribution. This possible bias in the fMECshould be taken only as an
esti-mate and therefore it is discussed here but not included in the calculations.
The samples from the MSY summer campaign had very low EC concentrations. Therefore six individual combus-tions of each of the samples were carried out and the CO2
collected was combined for a single subsequent14C analy-sis.
After the separation and collection of OC and EC as CO2
samples,14C analyses were performed at ETH Zurich with the Accelerator Mass Spectrometer MICADAS using a gas ion source (Ruff et al., 2007, 2010). The fM for each sam-ple was then blank subtracted using an average of the fM of the two blank filters analyzed, and taking into account the amount of C analyzed in each sample and in the blank filters. fM measurement uncertainty was calculated based on the Ac-celerator Mass Spectrometer sample and blank uncertainties and the amounts of C analyzed. On average, fMOC
measure-ment uncertainty was 2.4 % and 4 % of the corresponding fMOCfor winter and summer, respectively; and fMEC
mea-surement uncertainty was 6 % and 28 % of the corresponding fMECfor winter and summer, respectively.
2.4 Source apportionment of EC and OC using14C data
Source apportionment of EC and OC is based on their con-centrations,14C isotopic ratios of these two components, and
the expected fM of the corresponding sources. The refer-ence values for the different sources used in the present study are fMf= 0 (for fossil sources); fMbb = 1.083 (for biomass
burning), corresponding to emissions from burning of 25-year-old trees harvested in 2007–2008 as determined with a tree-growth model (Mohn et al., 2008); and fMbio = 1.045
(for biogenic sources), corresponding to 2008–2009 from the long-term series of atmospheric14CO2measurements at
Jungfraujoch research station (Levin et al., 2010). In the case of EC, the fM of non-fossil sources (fMnf)equals fMbbgiven
that biomass burning is the only source of non-fossil EC. In the case of OC, fMnf is assumed to be the average of fMbb
and fMbio, given that the fractions from biomass burning
and from biogenic sources are not known a priori, and both sources are thought to play a role in this region. An iterative
procedure could be used to refine the initial estimates. It would consist of calculating fMnf based on the fractions of
biogenic and biomass burning contributions derived from the analysis, and using fMnf to the initial calculations,
recalcu-lating the fractions of biogenic and biomass burning contri-butions, and with those recalculate fMnf, and keep doing so
until the recalculated fMnf shows a very small change with
respect to the previous iteration. However the subsequent differences in the results are small, especially compared to the measurement and method uncertainties, and such a pro-cedure is not used here.
EC is apportioned into ECf and ECnf, the former
at-tributed to combustion of fossil fuel and the latter atat-tributed to biomass burning (ECbb). ECf can be mainly attributed
to road traffic according to previous studies that found that EC in Barcelona is mainly related to road traffic emissions (P´erez et al., 2010). Residential heating as a source of ECfis
not expected to be very high in the study area due to moder-ate average temperatures during DAURE-W (13.3±2.8◦C in Barcelona and 9.5±4.0◦C in Montseny; Pandolfi et al., 2011b), and due to the fact that only 9 % of the residen-tial heating in Barcelona uses solid or liquid fossil fuel, the rest uses natural gas (62 %), electricity (28 %), wood (0.4 %) and other minor systems (0.2 %) (INE, 2001). Other sources such as shipping may also make a contribution to ECf in
Barcelona, although their contribution to PM was found to be relatively low (approximately 20 % of the contribution of vehicular exhaust emissions; Amato et al., 2009).
OC is separated into OCfand OCnf. OCfis attributed to
POA and SOA from fossil fuel combustion. As per ECf, the
contribution of residential heating to OCf is expected to be
low. As discussed before, OCnf may have different origins,
such as biomass burning POA and SOA, as well as biogenic SOA. However, some other sources such as cooking, biofuel combustion, brake lining dust, natural rubber in tire dust, and others may account for a substantial fraction of the total con-temporary carbon, especially in urban areas (Hildemann et al., 1994). In particular several recent studies report a high fraction of cooking aerosol in urban areas (Zheng et al., 2007; Allan et al., 2010; Huang et al., 2010; Sun et al., 2011). We first present results as OCnf, without differentiating between
biomass burning OC (OCbb), biogenic OC (OCbio), and other
OCnfsources.
In a second step, which allows for comparison with re-sults from other methods, the contribution of biomass burn-ing to OC is estimated based on an assumed ratio for EC/OC in biomass burning emissions (EC/OC)bbe, together with the
ECbbdetermined by14C:
OCbb =
ECbb
(EC/OC)bbe (2)
Nevertheless, the wide range of (EC/OC)bberatios found in
literature (Table S1) leads to high uncertainties in the esti-mation of OCbb. The (EC/OC)bbe ratio depends on many
used. For calculations here, an average (EC/OC)bbe ratio
of 0.3 was used, based upon the reported values for mon biofuel species in the Mediterranean, with similar com-bustion methods to those used in Spain (Fine et al., 2004; Gonc¸alves et al., 2010), and agricultural fires (Chow et al., 2010). SOA formation from biomass burning emissions is quite variable, and a recent summary of seven field studies reports that the net addition of OA mass due to SOA for-mation averages to 25 % of the POA (Cubison et al., 2011). Therefore SOA formation from biomass burning emissions may lead to a∼20 % underestimation of the OCbb on
aver-age.
2.5 Other source apportionment methods and biomass burning tracers
Results from three other methods are used here for com-parison with the 14C-based method for DAURE-W. First, measurements of levoglucosan, an organic tracer of biomass burning (Simoneit et al., 1999) are used. Levoglucosan was determined using the same filters used for14C analyses (PM1
48 h samples) by two methods: gas chromatography-mass spectrometry (Agilent 6890N gas chromatograph coupled to a mass spectrometer Agilent 5973N) by the Hungarian Academy of Sciences (lev-HAS), and by proton nuclear mag-netic resonance (HNMR, Tagliavini et al., 2006) by the In-stitute of Atmospheric Sciences and Climate of the Italian National Research Council (lev-ISAC). There are two addi-tional data sets of levoglucosan concentrations (Supp. Mate-rial Sect. S5 and Fig. S5) measured by different laboratories, but in this work we used the average of the concentrations of lev-HAS and lev-ISAC as they are consistent with each other, and for maximum overlap with the14C dataset.
The contribution of primary OC from biomass burning can be estimated from levoglucosan concentrations together with the levoglucosan/OC ratio in biomass burning emissions (lev/OC)bbe:
OCbb =
lev
(lev/OC)bbe (3)
However, the variability of (lev/OC)bberatio in the literature
is large (Table S1), and the data available for Europe, com-pared to the US, is scarce (Szidat et al., 2009 and references therein), which results in substantial uncertainty for the re-sults from this method. It is also known that levoglucosan can be oxidized photochemically in the atmosphere (Hennigan et al., 2010; Cubison et al., 2011) and that it can evaporate due to its semi-volatile character (Oja and Suuberg, 1999). Thus estimates from this method using ratios measured for concentrated primary emissions should be considered lower limits. An average (lev/OC)bberatio of 0.12 was used (Fine
et al., 2004; Schmidl et al., 2008; Sullivan et al., 2008; Szi-dat et al., 2009; Gonc¸alves et al., 2010; Saarnio et al., 2010). Nevertheless, given the wide range of ratios reported in the
literature, uncertainties were calculated to cover the ratios ranging from 0.07 to 0.17.
A second method used here for the estimation of OM sources, including OMbb, is based on factor analysis of AMS
measurements. Two high-resolution AMSs were deployed at the BCN and MSY sites (Mohr et al., 2011; Pandolfi et al., 2011b). The AMS instruments, data processing, and analy-sis techniques have been described in detail elsewhere (De-Carlo et al., 2006; Canagaratna et al., 2007). Positive Matrix Factorization (PMF) of the organic mass spectral data ma-trix provides information on different sources/components of the OA (Lanz et al., 2007; Ulbrich et al., 2009), such as hydrocarbon-like organic aerosol (HOA), used as a sur-rogate for urban combustion POA, BBOA as a sursur-rogate for POA from biomass burning, and oxygenated OA (OOA) as a surrogate for total SOA. As discussed above, biomass burning emissions can give rise to SOA from organic gases and also from semi-volatile species from the evaporation of the POA (DeCarlo et al., 2010; Cubison et al., 2011). The SOA formed from biomass burning emissions produces sim-ilar mass spectra to SOA from other sources (Jimenez et al., 2009) and thus it is lumped together in the oxygenated OA (OOA) factor. The details of the PMF methods and results for BCN can be found in Mohr et al. (2011). For MSY, PMF was performed on the organicm/zvs. time matrix using the PMF2.exe program and analyzed with the PMF Evaluation Tool (PET, http://tinyurl.com/PMF-guide) according to the procedures described on Ulbrich et al. (2009). 771 resolv-able ions were fitted in the high-resolution analysis software, PIKA, form/z 10–206, and were used in the PMF analy-sis. An 8-factor solution (FPEAK=0) was used since this was the lowest number of factors at which the HOA and BBOA factors showed a clear separation from each other and from OOA. Six factors were recombined to make up the OOA fac-tor. The BBOA and HOA factors used here are those from the 8-factor solution. More details can be found in the Supp. Material (Sect. S6).
The third method used to estimate the biomass burning contribution is based on receptor modeling of offline filter PM1 data. The offline dataset is discussed in detail
else-where (Pandolfi et al., 2011b). Briefly, 12 h PM1 samples
were collected on quartz fiber filters (Munktell) using DIGI-TEL DHA-80 high volume (30 m3h−1) samplers. Major and
an estimate of the biomass burning contribution to bulk sub-micron OC. Nevertheless, the model was not able to identify the biomass burning source in BCN, as explained in Sect. 3.7. At MSY, the solution chosen had 6 factors (mineral, anthro-pogenic, sea salt, biomass burning, secondary sulfate, and secondary nitrate). The source profile of the biomass burn-ing source can be found in Fig. S6.
Finally, the correlations of the different biomass burning OA estimates and tracers with ECbb (which is the most
di-rect biomass burning tracer) were evaluated. PMF-AMS BBOA was used for DAURE-W. Levoglucosan concentra-tions (average of lev-HAS and lev-ISAC data sets) were used for DAURE-W. Acetonitrile concentrations measured by a High Sensitivity Proton Transfer Reaction Quadrupole Mass Spectrometer (PTR-MS; Lindinger et al., 1998) at BCN in DAURE-W and DAURE-S, and by a Proton Transfer Reac-tion Time of Flight (PTR-TOF, Graus et al., 2010; M¨uller et al., 2010) at MSY in DAURE-W were used. Submi-cron potassium (K) concentrations were used for DAURE-W and DAURE-S. K concentrations were part of the PMF-OF dataset discussed above (Pandolfi et al., 2011b). Soluble K concentrations were determined in water extractions of the same samples and they were very similar to total K concen-trations. Hence, total K concentrations were used. Although some biomass burning estimates reported in literature are based on K, several recent studies have concluded that fine K can in some instances be dominated by other sources and can be a poor tracer for biomass burning (Zhang et al., 2010; Aiken et al., 2010).
3 Results and discussion
3.1 EC and OC concentrations
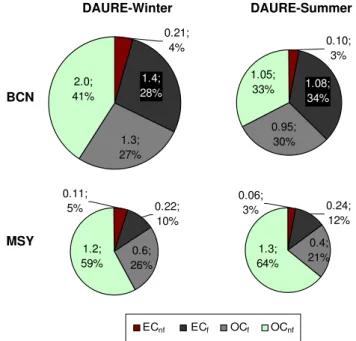
The carbonaceous aerosol at BCN and MSY during the DAURE campaigns showed differences in concentration, fractional composition, and source influences (Figs. 1 and 2). At BCN, the contribution of EC to total carbon was substan-tially higher than at MSY both in DAURE-W and DAURE-S, representing, on average, 32–37 % at BCN and 15–16 % at MSY. Conversely, the OC fractional contribution was higher at MSY than at BCN (Fig. 1), although the absolute concen-trations of OC were higher at BCN (Fig. 2) during DAURE-W, and similar to those at MSY in DAURE-S. OC/EC aver-age ratios (1.7–2.1 at BCN and 5.3–5.8 at MSY) were similar and lower, respectively, than those reported by previous stud-ies at the same sampling sites (2.5 for PM1at BCN and 11
for PM2.5at MSY; P´erez et al., 2008b; Pey et al., 2009).
3.2 EC sources
During the winter period, ECfaccounted for 87±1 %
(aver-age±propagated measurement uncertainty of only14C mea-surements) of EC at BCN, whereas at MSY this percentage was 66±3 %. In summertime, these values were 91±1 % and 79±4 % at BCN and MSY, respectively. As explained
DAURE-Winter DAURE-Summer
BCN
1.4; 28%
1.3; 27% 2.0; 41%
0.21;
4% 0.10;
3%
1.05; 33%
0.95; 30%
1.08; 34%
MSY
0.22; 10%
0.6; 26% 1.2; 59% 0.11;
5% 0.24;
12%
0.4; 21% 1.3; 64% 0.06;
3%
ECnf ECf OCf OCnf
ECnf ECf OCf OCnf
Fig. 1.Fossil (f) and non-fossil (nf) fractions of total carbon;
con-centrations in µg m−3and % of total carbon.
0.0 0.5 1.0 1.5 2.0 2.5
winter winter summer summer
BCN MSY BCN MSY
µ
g
m
-3
ECnf ECf OCf OCnf
ECnf ECf OCf OCnf
Fig. 2. Average absolute concentrations of the fossil (f) and
non-fossil (nf) fractions of EC and OC (µg m−3).
above, ECf is attributed to fossil fuel combustion, mostly
road traffic, and ECnfto biomass burning.
The high contribution of fossil fuel combustion to EC con-centrations in BCN is in agreement with P´erez et al. (2010) and Reche et al. (2011), who found that black carbon concentrations varied mainly according to road traffic con-ditions. In both seasons, the ECf contribution to EC at the
urban site is higher than at the rural site, as expected. In ab-solute values, the difference is larger. ECf at BCN was 6.3
summer (Fig. 2). This is consistent with the BCN/MSY ra-tios found for NOxconcentrations, 9 and 6 for winter and
summer, respectively, although the instruments do not mea-sure purely NOxand also include some of the more oxidized
nitrogen species (NOz, Steinbacher et al., 2007; Dunlea et
al., 2007). Assuming that a substantial fraction of the NOxat
MSY comes from the coastal polluted regions similar to the BCN urban area, these ratios can be considered estimates of the dilution of urban and regional pollution during transport to MSY. CO concentrations were not available for compar-ison. The fact that the ratios are higher for NOx than EC
is consistent with the fact that NOxis a reactive tracer with
a lifetime on the order of 1 day and some of the reaction products (HNO3)deposit very quickly to the surface and are
not sampled by NOxanalyzers, while EC is unreactive. The
higher contributions of ECnf in winter with respect to
sum-mer are likely due to higher emissions from residential heat-ing and open burnheat-ing of agricultural biomass (banned by law from 15 March to 15 October, Spanish Decreto 64/1995), as wild fires are expected to make a low contribution, with the exception of infrequent short impact periods (Fig. S7).
3.3 Fossil vs. contemporary OC
During the winter period, OCf(thought to be mainly due to
road traffic, as explained above) was 40±4 % of OC at BCN and 31±4 % at MSY. These values are similar to those ob-tained during winter at Zurich, Switzerland (32 % OCf/OC,
Szidat et al., 2006), and at G¨oteborg, Sweden (35–45 % at an urban site and 35–40 % at a rural site, Szidat et al., 2009). A priori, it could be expected that fossil sources may have a higher influence in Spain due to the lesser use of wood burning for residential heating (less than 1 % of the heating energy, INE, 2001). On the other hand, biogenic SOA may be higher under milder Spanish winter conditions compared to Switzerland or Sweden since the temperatures are higher, and biogenic volatile organic compounds (VOCs) emissions still occur in winter albeit at lower intensity than in summer (Seco et al., 2011). Therefore the differences in both sources may compensate each other, leading to similar OCffractions.
In summer OCfwas 48±4 % of OC at BCN and 25±5 %
at MSY; this again being comparable to contributions at G¨oteborg, Sweden, in summer (31–47 %, Szidat et al., 2009). Summer results for BCN (with the highest OCffraction from
the present study) are comparable to results from Mexico City (49–62 %, Aiken et al., 2010). Absolute OCf
concentra-tions in winter were higher than in summer (by 0.4 µg m−3) at BCN. This was likely due to stronger accumulation of pol-lutants during the cold season with lower atmospheric dis-persion, and perhaps to higher fossil combustion such as for residential heating.
At MSY, OC concentrations were similar for both sea-sons (Fig. 2). The ratio BCN/MSY for OCfconcentrations
was 2.1–2.4, which is lower than the corresponding ratio for ECfmentioned above (4.5–6.3). This is consistent with
formation of fossil SOA during transport from urban and re-gional sources to the MSY site, and also consistent with the higher NOxratios discussed above. Further evidence is
pro-vided by the comparison of the ratios of OCf/ECf for both
sites. The average ratio± standard deviation (variability) was 1.0±0.1 in winter and 0.9±0.2 in summer at BCN, and 2.6±0.7 in winter and 1.8±0.5 in summer at MSY. The er-ror for MSY in summer (0.5) is the propagated measurement uncertainty, since no variability is available because there was only one pooled sample for EC. The low variability of the ratios in BCN suggests that the OCfis mainly primary, or
that the secondary fraction changes little, e.g. if it is formed fast enough (Robinson et al., 2007; Chirico et al., 2010) so that it still correlates with the ECf. This is also supported
by the good correlation between OCf and ECf (R2=0.81,
Fig. S8). At MSY the larger ratios indicate that a substan-tial fraction of the OCfmay be due to fossil SOA formation
driven by photochemical reactions during the transport to the rural site. The larger variability of the OCf/ECfat MSY,
al-though partially due to the relatively high measurement un-certainty, indicates that the formation of fossil SOA may be more variable. The difference in the ratio in winter and sum-mer at MSY is not significant due to the high uncertainties.
OCnfat BCN was twice as high in winter than in summer.
This can be attributed to a higher contribution of biomass burning and reduced mixing in winter with respect to sum-mer in the Barcelona region, as indicated by the fact that ECnf
was also twice as high in winter. At MSY, OCnf was
simi-lar in summer and winter, despite the lower biomass burn-ing contribution in summer as evidenced by the lower ECnf.
This can likely be explained by a higher contribution of bio-genic SOA in summer, due to higher biobio-genic emissions and enhanced photochemistry. Seco et al. (2011) report sum-mer/winter ratios of∼10 for biogenic VOCs ambient con-centrations at the rural site.
3.4 Further source apportionment of the non-fossil OC
OCnfcan be apportioned to the different sources with some
additional assumptions. The estimations carried out in the present study include biomass burning (OCbb), biogenic
SOA (OCbio) and other non-fossil contributions called in
this study as urban non-fossil OC (OCurb−nf), such as
cook-ing and tire wear. Results are shown in Fig. 3. OCbb was
estimated with the method described in Sect. 2.4 (Eq. 2). OCbb is estimated to account for 30–35 % of the OCnf at
both sites and seasons (17–21 % of total OC), with the ex-ception of MSY in summer, where it only accounted for 16 % of the OCnf (12 % of total OC). The contribution
from OCurb−nf was calculated from the OCf contribution,
based on the assumption that OCurb−nf is ∼20 % of the
total urban OC contribution (OCf + OCurb−nf)(Hildemann
et al., 1994; Hodzic et al., 2010). OCurb−nf was estimated
as 0.2–0.3 µg m−3 at BCN, which is 16–23 % of the OCnf
(10–12 % of total OC). At MSY, the OCurb−nf was lower
DAURE-Winter DAURE-Summer
BCN
0.3; 16%
0.7; 35%
1.0; 49%
0.24; 23%
0.3; 33%
0.5; 44%
MSY
0.14; 11%
0.4; 30%
0.7; 59%
0.11; 8%
0.22; 16%
1.0; 76%
OCurb-nfOCurb-nf OCbioOCbio OCbbOCbb
Fig. 3. Source apportionment to non-fossil organic carbon
(µg m−3). OCurb−nf: urban nonfossil organic carbon; OCbio:
bio-genic organic carbon; OCbb: biomass burning organic carbon.
8–11 % of the OCnf, 6–8 % of total OC). As discussed above,
OCurb−nf may be underestimated if recent studies of a
cook-ing contribution similar to the traffic OC contribution are ap-plicable to this region. A sensitivity test was carried out to check the changes that would result from an assumption of OCurb−nf/(OCf+ OCurb−nf)of 10 % or 30 %, instead of the
aforementioned 20 %. The OCurb−nf contribution changes
by 56–71 %, although in absolute concentration the change is very low. The OCbio contribution was slightly higher in
summer (1.0 µg m−3) than in winter (0.7 µg m−3)at MSY, while OCbiowas lower in summer at BCN. The same
sen-sitivity test showed that OCbiocontribution changes by 6–
37 %, when changing the OCurb−nf/(OCf + OCurb−nf ratio
from 20 % to 10–30 %, with the main conclusions remaining the same. The absence of a strong increase in OCbio
concen-tration between winter and summer, compared to a factor of 10 increase in biogenic VOCs is very surprising. Although a larger fraction of the biogenic SOA species may remain in the gas-phase in the summer compared to the winter, this ef-fect is thought to be small (e.g. Martin et al., 2010). This disagreement remains unexplained with the tools available at the moment, and further research will be needed to find out the possible causes, but it highlights the uncertainties in the estimation methods.
3.5 Day-to-day variation
There was only moderate day-to-day variation in the frac-tional contributions to TC throughout the winter period.
The fossil fraction of TC (TCf) (48 h averages) varied
be-tween 42–68 % at BCN and bebe-tween 27–50 % at MSY (Fig. 4). The different meteorological scenarios during the campaign are described in detail by Pandolfi et al. (2011b). Briefly, there were three types of scenarios during winter: (A) characterized by recirculation of air masses and accu-mulation of pollutants with both MSY and BCN within the mixing layer; (B) when the mixing layer height was very low and hence MSY was above it; and (C) with Atlantic advec-tion which resulted in flushing pollutants from the region. There were some transition periods between different sce-narios indicated asT in Fig. 4. Note that due to the sampling periods (48 h in winter and 24 h in summer) more than one type of scenario may correspond to a single sample. In these cases the prevailing scenario is given in bold in Fig. 4.
Samples from 17/03 to 25/03 were collected during peri-ods with prevailing scenario A conditions. For those sam-ples TC concentrations at BCN were about twice those at MSY. The TCf, ECfand OCfcontributions at BCN and MSY
for these samples were highly correlated (R2=0.83−0.98; Fig. 5). When TCfwas more dominant at BCN (19/03-21/03,
68 % of TC), the contribution of TCfat MSY increased with
respect to the rest of the days (reaching 50 %). Conversely, when TCfshowed a lower contribution at BCN (21/03-23/03
and 23/03-25/03; 42 % and 45 %, respectively), TCfwas also
lower at MSY (32 %) (Fig. 4a and b), which reflects the stronger coupling of both sites due to the shared mixed layer. Under scenario B conditions, concentrations of TC at BCN were about 3 times those at MSY and the fractional contribu-tions were different, consistent with the meteorological char-acterization of a decoupling between the two sites. There was no correlation for the samples collected under scenario B (Fig. 5). At BCN, ECfcontributed substantially to TC (29–
30 %), whereas at MSY its contribution was lower as typical for this site (9–13 %) and OCnfaccounted for more than 50 %
of TC (Fig. 4a and b).
During the summer campaign, a time-resolved comparison of TCfbetween both sites is not possible due to the lack of
time-resolved data for the EC fractions at MSY, as explained above. TCfvaried between 47–75 % at BCN (Fig. 4c and d).
[B+A+T] [T] [B+T] [T+A] [A+T+A] [A+T] [T+A+T]
a) 0% 20% 40% 60% 80% 100%
BCN win
7.4 6.0 6.5 4.4 4.2 2.8 3.5
b)
0% 20% 40% 60% 80% 100%
27/02-01/03 01/03-03/03 13/03-15/03 17/03-19/03 19/03-21/03 21/03-23/03 23/03-25/03
MSY win
2.5 1.9 2.0 2.4 2.1 1.7 2.1
Figure 4
[D] [D] [F] [F] [F+D] [F]
c) 0%
20% 40% 60% 80% 100%
BCN sum
4.1 2.0 2.3 3.4 4.4 2.9
OCnf OCf ECf ECnf Total EC OCnf
OCf
ECf
ECnf
d)
0% 20% 40% 60% 80% 100%
09/07-10/07 11/07-12/07 16/07-17/07 22/07-23/07 23/07-24/07 28/07-29/07
MSY sum
1.3 1.8 2.0 2.1 2.1 3.2
09/07-29/07 2.1
Ave MSY sum
Fig. 4. Variation of the fossil (f) and non-fossil (nf) fractions of EC and OC during the study periods (date format: dd/mm). The atmospheric scenarios and the total carbon concentrations are listed
on top of each bar in µg m−3. Scenario A: air masses recirculation
and accumulation of pollutants (MSY and BCN within the mixing layer); B: mixing layer height below MSY; D: regional pollution; F: air masses from North Africa; T: transition between different scenarios. In bold the prevailing scenario when more than one
oc-curred during the same sampling period.(a)winter BCN;(b)winter
MSY;(c)summer BCN;(d)summer MSY. For summer MSY, no
distinction of ECfvs. ECnfis given for the individual days, because
samples were pooled for analyses (see text).
3.6 Combination of14C and PMF-AMS results
A comparison of the relative contributions to OC determined by the 14C and PMF-AMS techniques is shown in Fig. 6 (DAURE-W only). We compare fractional contributions as they should not be affected by concentration inaccuracies in either method. To compare the results from the14C method to AMS measurements, OC was calculated from PMF-AMS OM as explained in Sect. 2.2. These calculations result in hydrocarbon-like organic carbon (HOC), cooking organic carbon (COC), biomass burning organic carbon (BBOC), and oxygenated organic carbon (OOC) contributions. To facil-itate comparison to 14C results, the sources identified by
1.4
1.2
1.0
0.8
0.6
0.4
0.2
0.0
TC
f
, O
Cf
, EC
f
at M
SY (
µ
g
m
-3 )
5 4
3 2
1 0
TCf, OCf, ECf at BCN (µg m-3) ECf [A]
OCf [A] TCf [A] ECf [B] OCf [B]
TCf [B]
0.16x + 0.07, R2 = 0.83 0.48x + 0.11, R2 = 0.98 0.32x + 0.18, R2 = 0.98
Fig. 5. TCf, ECfand OCfcontributions at MSY vs. TCf, ECfand
OCfcontributions at BCN during scenario(A)and during scenario
(B). Lines and equations correspond to orthogonal distance
regres-sions.
PMF-AMS were divided into fossil and non-fossil. HOC from BCN was included in the fossil sources. For MSY, HOC was assumed to be 80 % of fossil origin (HOCf)and 20 %
from urban non-fossil sources (HOCnf)(based on Hildemann
et al., 1994). COC and BBOC were included in the non-fossil sources. As OOC is thought to be a surrogate for total secondary OC and originates from both fossil and contem-porary sources, OOC was divided in fossil and non-fossil (OOCf and OOCnf)according to the OCf/OCnf ratio
iden-tified by the14C method, so that the resulting total OC f/OCnf
ratio from PMF-AMS sources equals the OCf/OCnf ratio
from the14C method.
At BCN, OCfis estimated to be∼53 % secondary, and the
remaining fraction of the OCfin BCN is estimated to be
pri-mary (∼47 %). This fossil secondary percentage is relatively low when compared to findings from Robinson et al. (2007), who predict a high proportion of SOA formation from vehi-cle emissions. OCnf is a combination of COC, OOCnf and
primary BBOC. OOC, a surrogate for total secondary OC, is mostly non-fossil (∼60 %), with this fraction being due to biogenic sources, biomass burning, and urban non-fossil sources.
At MSY, OCfis estimated to be∼85 % secondary. This
is consistent with previous conclusions based on the higher OCf/ECf ratio at MSY than at BCN (see Sect. 3.3), which
BCN MSY 0.9 1.0 1.1 1.4 0.4 0% 10% 20% 30% 40% 50% 60% 70% 80% 90% 100% AMS 0.3 0.9 0.6 1.2 0% 10% 20% 30% 40% 50% 60% 70% 80% 90% 100% 14C F O SSI L NO N-F O S S IL 14C 0.08 0.4 1.0 0.12 HOCnf 0.02 0% 10% 20% 30% 40% 50% 60% 70% 80% 90% 100% AMS 0.14 0.7 0.4 0.6 0% 10% 20% 30% 40% 50% 60% 70% 80% 90% 100% 14C F O SSI L NO N-F O S S IL 14C OCbb OCbio OCurb-nf OCf OCbb OCbio OCurb-nf OCf BBOC OOCnf COC OOCf HOC OOCnf OOCf OCbb OCbio OCurb-nf OCf OCbb OCbio OCurb-nf OCf BBOC OOCnf HOCnf OOCf HOCf OOCnf HOCnf OOCf HOCf Figure 6
Fig. 6. Relative source apportionment to organic carbon during
DAURE-W according to the 14C technique and PMF results of
AMS measurements. Numbers indicate the absolute
concentra-tions in µg m−3. BCN averages exclude 01/03–03/03 and 13/03–
15/03 samples because of low availability of AMS data. HOC: hydrocarbon-like organic carbon; OOC: oxygenated organic car-bon (secondary); COC: cooking organic carcar-bon; BBOC: primary
biomass burning organic carbon; OCurb−nf: urban non-fossil
or-ganic carbon.
the carbonaceous aerosol sources, distinguishing the primary and secondary contributions. These conclusions remain the same if the aforementioned assumed 80 % fossil origin of HOC changes from 70 % to 90 %.
3.7 Comparison of biomass burning OC determined by different approaches
In Fig. 7 we compare the biomass burning OC (OCbb)
concentrations during winter estimated using the 14C data with those from several other techniques, including PMF-AMS, PMF-OF, and the tracer-based method using levoglu-cosan. Note that for the results from the PMF-AMS and levoglucosan methods the concentrations refer to only pri-mary BBOC (Grieshop et al., 2009; DeCarlo et al., 2010). No biomass burning source was identified at BCN by PMF-OF although this technique enabled identification of such a source at MSY. Lack of identification at BCN may be due to the presence of multiple additional sources, which compli-cate the identification of relatively small sources (the relative contribution of BBOC to OC was lower than that at MSY according to AMS-PMF results).
Biomass burning contributions estimated by the14C tech-nique are similar or in most cases slightly higher than those from other techniques, with the exception of the three first samples at BCN (Fig. 7). The difference compared to the
0.0 0.5 1.0 1.5 2.0 2.5
27/2-01/3 01/3-03/3 13/3-15/3 17/3-19/3 19/3-21/3 21/3-23/3 23/3-25/3 Average
B iom a s s bur ni ng O C ( µ g m -3)
14C PMF-AMS lev
BCN * * 14C 0.0 0.2 0.4 0.6 0.8 1.0
27/2-01/3 01/3-03/3 13/3-15/3 17/3-19/3 19/3-21/3 21/3-23/3 23/3-25/3 Average
B iom a s s bur ni ng O C ( µ g m -3)
14C PMF-AMS lev PMF-OF
M SY
14C
Fig. 7. Concentrations of OC due to biomass burning (µg m−3)
estimated with different methods: the14C technique, PMF-AMS,
levoglucosan-tracer method, and PMF-OF. *: low AMS data
avail-ability for the 48h period. Error bars in the14C technique account
for the uncertainty of the14C method and the uncertainty of the
(EC/OC)bberatio (from 0.2 to 0.4); error bars in the PMF-AMS are
an estimation of the uncertainty of the biomass burning contribu-tion; error bars in the levoglucosan-tracer method reflect the
vari-ability of the (lev/OC)bberatio from 0.07 to 0.17; error bars in the
PMF-OF are standard deviation of the four 12h samples included in each of the 48h average periods. Date format: dd/m.
AMS and levoglucosan results may be partially explained by the presence of biomass burning SOC, which is not included in the OCbbcalculated using these methods, and would be
ex-pected to be∼25 % of POA (Cubison et al., 2011). It is also possible that the biomass burning OC contribution estimated by the14C method is overestimated, if the (EC/OC)bbe
as-sumed for our calculations is too low for the biomass burning taking place in the study area. Nevertheless, the different estimates follow the same time trend, with the exception of PMF-OF. Thus it appears that PMF-OF is less accurate in the retrieval of this source. The biomass burning source profile determined by PMF-OF can be found in Fig. S6.
It is of interest to further evaluate the similarities of the dif-ferent biomass burning estimation methods and tracers, with-out the possible systematic uncertainties associated with the conversion factors used to estimate the OCbb from different
tracers (such as (EC/OC)bbe, (lev/OC)bbe, and OM/OC for
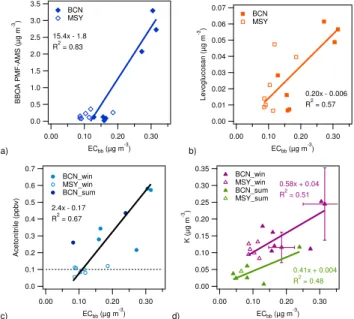
biomass burning). Scatter plots of the different tracers and estimates are shown in Fig. 8. BBOA estimated by PMF-AMS correlates well with ECbb (R2=0.83, using all
sam-ples), as seen in Fig. 8a. The correlation of levoglucosan concentrations with ECbb shows anR2=0.57 with a slope
a) 3.5 3.0 2.5 2.0 1.5 1.0 0.5 0.0 BBOA PM F-AM S ( µ g m -3) 0.30 0.20 0.10 0.00
ECbb (µg m -3
) 15.4x - 1.8 R2 = 0.83
BCN MSY b) 0.07 0.06 0.05 0.04 0.03 0.02 0.01 0.00 Levoglucosan (µ g m -3) 0.30 0.20 0.10 0.00
ECbb (µg m -3
) 0.20x - 0.006 R2 = 0.57 BCN MSY c) 0.7 0.6 0.5 0.4 0.3 0.2 0.1 0.0 Acetonitrile (ppbv ) 0.30 0.20 0.10 0.00
ECbb (µg m -3
) 2.4x - 0.17 R2 = 0.67
BCN_win MSY_win BCN_sum d) 0.35 0.30 0.25 0.20 0.15 0.10 0.05 0.00 K (µ g m -3) 0.30 0.20 0.10 0.00
ECbb (µg m -3
)
0.58x + 0.04 R2 = 0.51
BCN_win MSY_win BCN_sum MSY_sum
0.41x + 0.004 R2 = 0.48
Fig. 8. Scatter plot of(a)biomass burning organic aerosol contri-bution estimated from PMF-AMS vs. biomass burning elemental
carbon estimated by14C method (ECbb) in DAURE-W;(b)
lev-oglucosan concentrations (average of lev-HAS and lev-ISAC
mea-surements) vs. ECbbin DAURE-W;(c)K concentrations vs. ECbb
in DAURE-W (purple) and DAURE-S (green), error bars indicate measurement uncertainty, only shown for two data points for
clar-ity;(d)acetonitrile concentrations vs. ECbbin DAURE-W; dotted
line indicates typical continental background acetonitrile concen-trations (although lower background values are possible for air with recent contact with the ocean). Correlation coefficients were calcu-lated using all data points shown in the plots. Regression lines were calculated with orthogonal distance regressions.
ratio, which is in the lower range of the lev/ECbb values
found in the literature, which vary from 0.15 to 2 in most cases (Schmidl et al., 2008; Sullivan et al., 2008; Gonc¸alves et al., 2010; Saarnio et al., 2010), although much higher val-ues (up to 10 or 15) have also been reported (Fine et al., 2004; Sullivan et al., 2008). This may indicate lower initial emis-sion ratios, or some oxidation or evaporation of levoglucosan during atmospheric transport.
Acetonitrile concentrations show correlation with ECbb
(R2=0.67, Fig. 8c). Although concentrations at MSY were close to typical acetonitrile continental background concen-trations (e.g. Aiken et al., 2010), they are consistent with low ECbbconcentrations.
K concentrations show lower correlation with ECbb for
low concentrations (Fig. 8d), with R2=0.51 in DAURE-W andR2=0.48 in DAURE-S. The winter data suggest the presence of a background level of bulk K (intercept when ECbb=0) of∼40 ng m−3, which may be due to sources other
than biomass burning, such as food cooking (Hildemann et al., 1991; Schauer et al., 1999), vegetative detritus (Hilde-mann et al., 1991), fly ash (Lee and Pacyna 1999), and dust
such as feldspars and clay minerals. This is consistent with findings by Zhang et al. (2010) and Aiken et al. (2010), and the latter authors reported a background non-biomass burn-ing K concentration of∼120 ng m−3in Mexico City. More-over, K emissions depend on the burning conditions. The influence of cooking on the K concentrations is supported by the higherR2 (0.74) found for multilinear regression of K concentrations vs. BBOA and COA concentrations found by PMF-AMS at BCN, compared to theR2 (0.54) for K con-centrations vs. BBOA. Nevertheless, the noise in the K data is quite high (see measurement uncertainty as error bars for two data points in Fig. 8c), which should be considered when evaluating the robustness of the conclusions from these data. Therefore, given the moderate correlation of K with ECbb
and the high uncertainty in K concentrations, K is not the best tracer for biomass burning emissions for the present study.
4 Conclusions
The contribution of EC to TC at BCN was substantially higher than at MSY both in the winter and the summer cam-paign. The OC contribution, although higher at MSY as a fraction of TC, was higher at BCN in absolute concentration. At BCN, 87 and 91 % of the EC, in winter and summer, re-spectively, had a fossil origin (mainly road traffic), whereas at MSY these percentages were 66 and 79 %, respectively. In absolute values, ECf at BCN was 4.5–6.3 times that at
MSY, which is in agreement with dilution ratios estimated from NOx concentrations. Higher concentrations of ECnf
were found in winter than summer and attributed to a higher biomass burning contribution during winter.
The contribution of fossil sources to OC (mainly POA and SOA from road traffic) was 40 % at BCN and 31 % at MSY in winter, and 48 % at BCN and 25 % at MSY in summer. These values are similar to those observed in Zurich, Switzerland, and in G¨oteborg, Sweden. The highest contribution of fossil sources to total carbon found in the present study is similar to the average values from Mexico City. The absolute OCf
concentrations in winter were slightly higher than in sum-mer at BCN due to stronger accumulation of pollutants due to reduced dispersion, whereas at MSY the concentrations were similar for both seasons. By combining results from the14C and PMF-AMS techniques, we can estimate that the OCfat BCN is∼47 % primary. The formation of secondary
OCfappears to be rapid enough that the OCf/ECfstays about
constant for the timescales of our samples. At MSY the OCf
is mainly secondary (∼85 %), as determined both by the high OCf/ECfratio at MSY, and the combination of14C and
PMF-AMS results.
OCnfat BCN was higher in winter than in summer
proba-bly due to a higher contribution of biomass burning. At MSY, OCnfwas higher in summer which is explained by a higher
order-of-magnitude increase observed for biogenic volatile organic compounds (VOCs) between winter and summer, which highlights the uncertainties in the estimation of that component.
There was moderate day-to-day variation throughout the study periods (with the fossil contribution to total carbon be-ing between 42–68 % at BCN and 27–50 % at MSY in win-ter, and between 47–75 % at BCN in summer), but the differ-ences between BCN and MSY in TC levels and source con-tributions depended largely on the meteorological conditions. Hence, during regional pollution accumulation episodes, concentrations and source distributions were similar at both sites; whereas during stagnation episodes when the bound-ary layer was below the MSY sampling site, the sites were decoupled and the total carbon levels and fossil sources con-tribution were higher at BCN than at MSY.
Biomass burning OC contributions estimated by the14C technique were similar or slightly higher than those from other techniques, nonetheless they were reasonably corre-lated. The difference with the PMF-AMS and levoglucosan method results could be partially explained by the contribu-tion of SOA formed from biomass burning emissions (not included in the OCbb from these methods), and/or an
over-estimation of OCbbcontribution due to a non-representative
biomass burning EC/OC ratio used for the calculations. Bulk submicron K concentrations, although commonly used as tracer for biomass burning, appear influenced by additional sources other than biomass burning during winter, as ob-served in some previous studies. PMF-AMS BBOA and ace-tonitrile concentrations are the biomass burning markers that correlate better with ECbb.
Supplementary material related to this article is available online at:
http://www.atmos-chem-phys.net/11/12067/2011/ acp-11-12067-2011-supplement.pdf.
Acknowledgements. This work was supported by the Acci´on
Complementaria DAURE CGL2007-30502-E/CLI, the GRACCIE
project CSD2007-00067, the VAMOS project
CGL2010-19464/CLI, and the Departament de Medi Ambient i Habitatge of the Generalitat de Catalunya. This work was also supported by the EU FP6 project EUCAARI and the IMBALANCE project within the Centre of Competence for Environment and Sustainability (CCES). M. C. Minguill´on was partially supported by a Postdoc-toral Grant in the frame of Programa Nacional de Movilidad de Recursos Humanos del Plan nacional de I-D+I 2008–2011 from the Spanish Ministry of Science and Innovation. D. A. Day, A. M. Or-tega, and J. L. Jimenez were partially supported by US NSF grants ATM-0920940 and ATM-0919189 (from Atm. Chem. and OISE – Office of International Science and Engineering), and by NOAA grant NA08OAR4310565. A. M. Ortega was supported by DOE SCGF (ARRA/ORISE/ORAU) Fellowship DE-AC05-06OR23100. J. Pe˜nuelas and R. Seco were supported by the Spanish Govern-ment projects CGL2010-17172 and Consolider Ingenio Montes CSD2008-00040, and by a postdoctoral grant from Fundaci´on
Ram´on Areces to R. Seco. The National Center for Atmospheric Research is sponsored by the National Science Foundation.
Edited by: A. Petzold
References
Aiken, A. C., Decarlo, P. F., Kroll, J. H., Worsnop, D. R., Huff-man, J. A., Docherty, K. S., Ulbrich, I. M., Mohr, C., Kimmel, J. R., Sueper, D., Sun, Y., Zhang, Q., Trimborn, A., Northway, M., Ziemann, P. J., Canagaratna, M. R., Onasch, T. B., Alfarra, M. R., Prevot, A. S. H., Dommen, J., Duplissy, J., Metzger, A., Baltensperger, U., and Jimenez, J. L.: O/C and OM/OC ra-tios of primary, secondary, and ambient organic aerosols with high-resolution time-of-flight aerosol mass spectrometry, Envi-ron. Sci. Technol., 42, 4478–4485, 2008.
Aiken, A. C., de Foy, B., Wiedinmyer, C., DeCarlo, P. F., Ul-brich, I. M., Wehrli, M. N., Szidat, S., Prevot, A. S. H., Noda, J., Wacker, L., Volkamer, R., Fortner, E., Wang, J., Laskin, A., Shutthanandan, V., Zheng, J., Zhang, R., Paredes-Miranda, G., Arnott, W. P., Molina, L. T., Sosa, G., Querol, X., and Jimenez, J. L.: Mexico city aerosol analysis during MILAGRO using high resolution aerosol mass spectrometry at the urban supersite (T0) Part 2: Analysis of the biomass burning contribution and the non-fossil carbon fraction, Atmos. Chem. Phys., 10, 5315–5341, doi:10.5194/acp-10-5315-2010, 2010.
Allan, J. D., Williams, P. I., Morgan, W. T., Martin, C. L., Flynn, M. J., Lee, J., Nemitz, E., Phillips, G. J., Gallagher, M. W., and Coe, H.: Contributions from transport, solid fuel burning and cooking to primary organic aerosols in two UK cities, Atmos. Chem. Phys., 10, 647–668, doi:10.5194/acp-10-647-2010, 2010. Amato, F., Pandolfi, M., Escrig, A., Querol, X., Alastuey, A., Pey, J., Perez, N., and Hopke, P. K.: Quantifying road dust resuspen-sion in urban environment by Multilinear Engine: a comparison with PMF2, Atmos. Environ., 43, 2770–2780, 2009.
Andersson, A., Sheesley, R. J., Krus˚a, M., Johansson, C., and
Gustafsson, ¨O.: 14C-Based source assessment of soot aerosols
in Stockholm and the Swedish EMEP-Aspvreten regional back-ground site, Atmos. Environ., 45, 215–222, 2011.
Bae, M. S., Schauer, J. J., DeMinter, J. T., Turner, J. R., Smith, D., and Cary, R. A.: Validation of a semi-continuous instrument for elemental carbon and organic carbon using a thermal-optical method, Atmos. Environ., 38, 2885–2893, 2004.
Canagaratna, M. R., Jayne, J. T., Jimenez, J. L., Allan, J. D., Al-farra, M. R., Zhang, Q., Onasch, T. B., Drewnick, F., Coe, H., Middlebrook, A., Delia, A., Williams, L. R., Trimborn, A. M., Northway, M. J., DeCarlo, P. F., Kolb, C. E., Davidovits, P., and Worsnop, D. R.: Chemical and microphysical characterization of ambient aerosols with the Aerodyne Aerosol Mass Spectrometer, Mass Spectrom. Rev., 26, 185–222, 2007.
Cavalli, F., Viana, M., Yttri, K. E., Genberg, J., and Putaud, J.-P.: Toward a standardised thermal-optical protocol for measuring atmospheric organic and elemental carbon: the EUSAAR proto-col, Atmos. Meas. Tech., 3, 79–89, doi:10.5194/amt-3-79-2010, 2010.