1
FUNDAÇÃO GETULIO VARGAS
ESCOLA DE ADMINISTRAÇÃO DE EMPRESAS DE SÃO PAULO
CHLOÉ SANDRINE HÉLÈNE TRICAUD
MAIN OBSTACLES IN THE BUSINESS ENVIRONMENT AFFECTING FIRM
GROWTH: A COMPARATIVE ANALYSIS BETWEEN CHINESE AND BRAZILIAN
SMEs
SÃO PAULO
2
FUNDAÇÃO GETÚLIO VARGAS
ESCOLA DE ADMINISTRAÇÃO DE EMPRESAS DE SÃO PAULO
CHLOÉ SANDRINE HÉLÈNE TRICAUD
MAIN OBSTACLES IN THE BUSINESS ENVIRONMENT AFFECTING FIRM
GROWTH: A COMPARATIVE ANALYSIS BETWEEN CHINESE AND BRAZILIAN
SMEs
Thesis
presented
to
Escola
de
Administração de Empresas de São
Paulo of Fundação Getulio Vargas, as a
requirement to obtain the title of Master in
International Management (MPGI).
Knowledge Field: Economia e Finanças
Internacionais.
Adviser: Prof. Dr. Antonio Carlos
Manfredini Da Cunha Oliveira
SÃO PAULO
3
Tricaud, Chloé Sandrine Hélène
MAIN OBSTACLES IN THE BUSINESS ENVIRONMENT AFFECTING
FIRM GROWTH: A COMPARATIVE ANALYSIS BETWEEN CHINESE
AND BRAZILIAN SMEs / Chloé Sandrine Hélène Tricaud.
–
2015.
130f.
Orientador: Oliveira, Antonio Carlos Manfredini da Cunha.
Dissertação (MPGI) - Escola de Administração de Empresas de
São Paulo.
1. Pequenas e médias empresas - China. 2. Pequenas e médias
empresas - Brasil. 3. Empresas - Crescimento. 4. Análise por
conglomerados. I. Oliveira, Antonio Carlos Manfredini da Cunha. II.
Dissertação (MPGI) - Escola de Administração de Empresas de São
Paulo. III. Título.
4
CHLOÉ SANDRINE HÉLÈNE TRICAUD
MAIN OBSTACLES IN THE BUSINESS ENVIRONMENT AFFECTING FIRM
GROWTH: A COMPARATIVE ANALYSIS BETWEEN CHINESE AND BRAZILIAN
SMEs
Thesis
presented
to
Escola
de
Administração de Empresas de São
Paulo of Fundação Getulio Vargas, as a
requirement to obtain the title of Master in
International Management (MPGI).
Knowledge Field: Economia e Finanças
Internacionais.
Approval Date
27 / 03 / 2015
Committee members:
_______________________________
Prof. Dr. Antonio Carlos Manfredini da
Cunha Oliveira
_______________________________
Prof. Dr.
André Luiz Silva Samartini
_______________________________
5
ACKNOWLEDGEMENTS
I would like to express my sincere gratitude to my supervisor, Antonio Carlos
Manfredini, for the useful comments, the constructive criticism, the patience and
engagement through the learning process of this master thesis. I would like to thank
the World Bank for providing me with the raw data to build the analyses. I am also
deeply grateful to my family, who supported me not only during the thesis but
throughout my entire studies. Finally, I would like to thank my friends
–
especially my
housemates in Paris and in São Paulo as well as Simon, Pi-Ay and Cléa
–
and Marco
6
ABSTRACT
Using World Bank Data, this research analyzes the similarities and differences in the
main obstacles faced by Chinese and Brazilian micro, small and medium enterprises
(MSME). We performed both country and cluster analyses in order to confront
subjective and objective data, with the aim to be able to identify firms’ behaviors
according to their own characteristics and their country environment.
7
RESUMO
Usando dados do Banco Mundial, esta dissertação analisa as semelhanças e
diferenças entre os obstáculos enfrentados pelas micro, pequenas e médias
empresas (MSME) no Brasil e na China. Realizamos tanto uma análise comparativa
entre os dos países como uma análise de clusters para confrontar os dados
subjetivos
e
objetivos
recolhidos,
de
modo
a
identificar
o
desempenho dasempresas, levando em consideração as características dos países
e o ambiente de negócios.
KEY WORDS: MPMEs, OBSTACULOS AOS NEGOCIOS, DESEMPEHNO DA EMPRESA
8
1. INTRODUCTION 15
2. LITERATURE REVIEW 17
2.1. The role of SMEs in economic growth 17
2.2. The fast development of SMEs in Brazil and in China 17
2.3 SME sector’s contribution to the economy in Brazil and China 19
2.4. Impact of the business environment on firm growth 20
2.5. Business environment and the characteristics of firms 20
2.6 The elements of the business environment impacting firm growth 21
2.7. External factors determining firm growth 22
2.8. Access to finance and credit constraints 22
2.9. Barriers to growth in China 25
2.10. Barriers to growth in Brazil 26
3. CONTRIBUTION TO LITERATURE 29
3.1. The WBES : a new common, comprehensive database 29
3.2. Changing the scale of the analysis 32
3.3 Beyond traditional age / size determinants 33
3.4. The comparison between both subjective and objective obstacles to firm growth 34
4. DATA PRESENTATION 35
4.1. Setting the limits of the sample: a SME definition 35
4.2. General presentation of the WBES 36
4.3. Samples’ representativeness 38
4.4. Regional distribution 39
4.5. Sector distribution 43
4.6. Segmentation by firm size 45
5. METHODOLOGY 46
5.1. Common determinants of firm growth 46
5.2. How to measure firm growth 46
9
6. RESULTS : COUNTRY COMPARISON 50
6.1. Main obstacles to business in Brazil and China 50
6.2. Perception of tax rates 52
6.3. Perception of Inadequately educated workforce 54
6.4. Perception of Practices of competitors in the informal market 57
6.5.. Perception of access to finance 62
6.6. Perception of corruption 68
6.7. Perception of transports 69
6.8. General comparison between Brazil and China 71
7. RESULTS : CLUSTER ANALYSIS
7.1. Cluster Analysis 1: Tax rates vs. Access to finance 77
7.2. Cluster Analysis 2: Practices of competitors in the informal market vs. Corruption 84
7.3 Cluster Analysis 3: Inadequately educated workforce vs. Transports 90
7.4. Homogeneity and heterogeneity of clusters 95
8. DISCUSSION AND CONCLUSIONS 98
9. REFERENCES 103
A. APPENDICES 111
10
Table 3. 1. 1. The thresholds of the SME definition by SEBRAE 30
Table 3. 1.2. The thresholds of the SME definition by BNDES 30
Table 3. 1. 3 SME thresholds in China 31
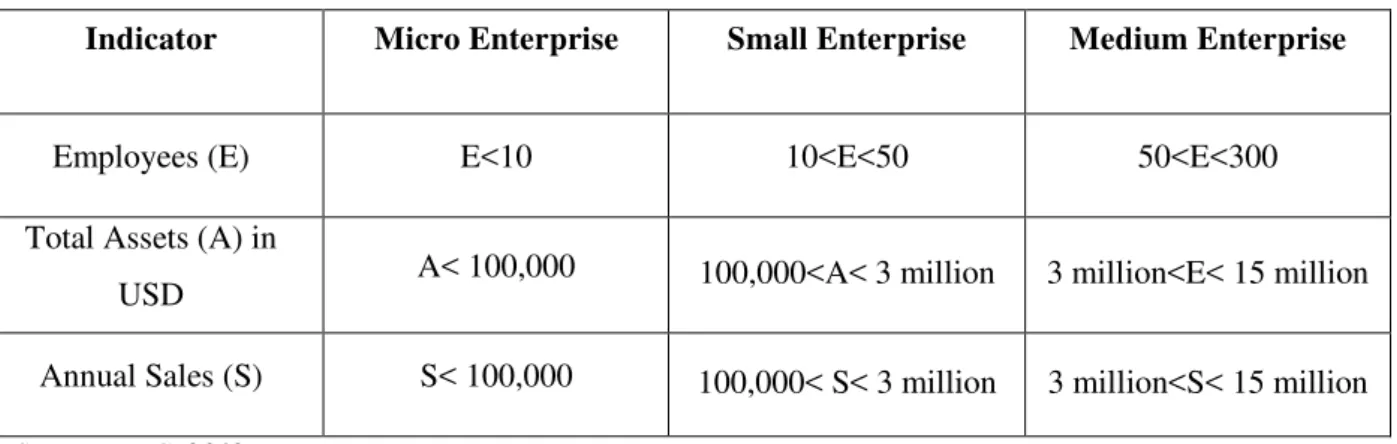
Table 4.1.1. IFC’s most recent definition on SMEs 35
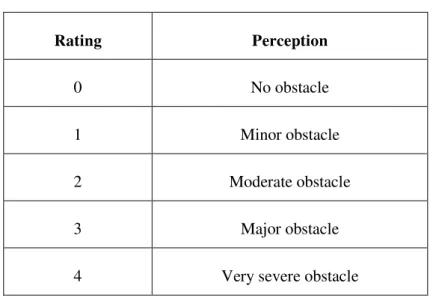
Table 4. 2. 1. WBES Obstacle characterization and classification 37
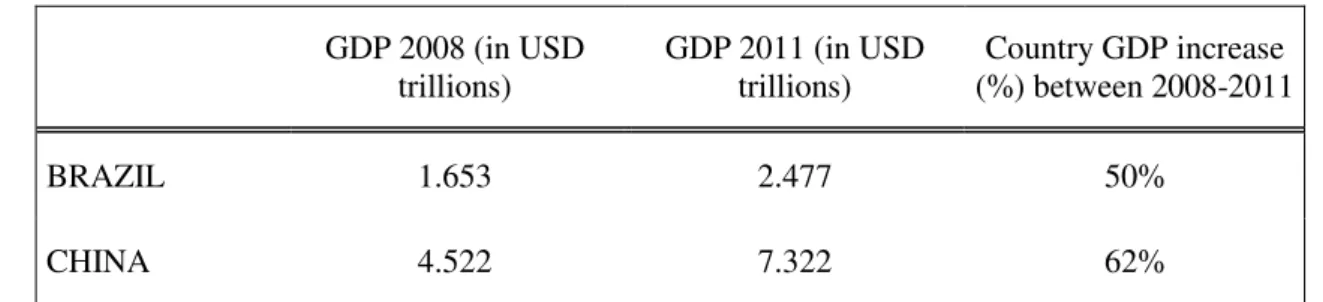
Table 4.3.1. GDP growth rates in China and in Brazil between 2008 and 2011 39
Chart 4.4.1. Firms surveyed by state in the WBES China 2012 39
Map 4.4. 1. Sample distribution between wealthiest, middle-income and poorest states:
China, 2012 40
Chart 4.4.2. Firms surveyed by state in the WBES Brazil 2009 40
Map 4.4.2: Sample distribution between wealthiest, middle-income and poorest states:
Brazil, 2009 41
Table 4.3.2. High-income, middle-income and low-income states surveyed in Brazil and
China (2012) 42
Charts 4.4.3 Firms repartition between low, middle and high-income groups in Brazil and
China 42
Table 4.5.1. Firms surveyed per sector, Brazil 42
Chart 4.5.1. Sample repartition between industry and services, Brazil, 2009 43
Table 4.5.2. Firms surveyed per sector, China 44
Chart 4.6.1. Distribution of firms between micro, small and medium enterprises in both
samples 45
Table 5.3.1. Rating and correspondence of obstacles on the sample 48
Table 5.3.2. Rating and correspondence of obstacles on the sample 49
Chart 6.1.B. Biggest obstacles to business operations in Brazil by number of enterprises
surveyed , 2009 50
Chart 6.1.C. Biggest obstacles to business operations in China by number of enterprises
surveyed, 2011 51
Chart 6.2.1. Obstacle scores on Tax rates, Brazil and China 53
Chart 6.2.2.C. Average annual sales in function of obstacle score on Tax rates, China 53
Table 6.2.1 The tax burden in China and Brazil 54
11
Charts 6.3.2.B.Proportion of skilled workers on total workforce in function of obstacle
scores on Inadequately educated workforce, Brazil 56
Chart 6.3.2.C. Proportion of skilled workers in function of obstacle scores on Inadequately
educated workforce, China 57
Table 6.3.1. Inadequately educated workforce in Brazil and China 58
Chart 6.4.1.Obstacle scores on practices of competitors in the informal market, Brazil and
China 59
Chart 6.4.2.B. Average annual sales in function of obstacle scores on Practices of
competitors in the informal market, Brazil 59
Chart 6.4.2.C. Average annual sales in function of obstacle scores on “Practices of
competitors in the informal market”, China 59
Chart 6.4.3.B. Average percentage of the workforce with a university degree in function of
obstacle score on Practices of competitors in the informal market, Brazil 61
Table 6.4.1 Practices of competitors in the informal market in Brazil and China 61
Chart 6.5.1.. Obstacle scores on access to finance in Brazil and China 62
Chart 6.5.2.B. Average annual sales in function of obstacles scores on access to finance,
Brazil 63
Chart 6.5.2.C. Average annual sales in function of obstacle score on access to finance,
China 63
Chart 6.5.3.B. Composition of working capital by financing sources, Brazil 64
Chart 6.5.3.C. Composition of working capital by financing sources, China 64
Chart 6.5.4.B. Purchase of net fixed assets by financing sources, Brazil 65
Chart 6.5.4.C. Purchase of net fixed assets by financing sources, China 65
Table 6.5.1.B. Firms average sales and scores on access to finance per states, Brazil, 2007 66
Table 6.5.1.C. Firms average sales and scores on access to finance per states, China, 2011 67
Table 6.5.2. Access to finance in Brazil and in China 68
Chart 6.6.1. Obstacle scores on Corruption in Brazil and China 68
Table 6.6.1.Corruption in Brazil and in China 69
Chart 6.7.1 Obstacle score on transports in Brazil and in China 70
Chart 6.7.2.C Average annual sales in function of obstacle scores on “Transports”, China 71
Table 6.7.1. Transports in Brazil and China 71
Table 6.8.1. Indicators on infrastructure quality and bureaucracy: Brazil and China 72
12
Chart 6.8.1.C. Average obstacle score in function of annual sales, China 74
Chart 6.8.2.B. Average obstacle score in function of the number of employees, Brazil 75
Chart 6.8.2.C. Average obstacle score in function of the number of employees, China 75
Table 6.8.2. Portrait of typical firms affected by each obstacle 76
Chart 7.1.1 Clustering 1 : Access to Finance vs. Tax rates 78
Table 7.1.1. Country distribution and aggregated cluster scores, CA1 79
Table 7.1.2. Cluster average annual sales and obstacle scores, CA1 80
Table 7.1.3. Clusters performances : international differentiation, capacity utilization and
sales and employees number’s evolution 81
Table 7.1.4. Clusters’ financing profiles, CA1 82
Table 7.1.5. Credit constrained firms’ distribution across clusters, CA1 83
Chart 7.1.2 Average sales within cluster in function of aggregated cluster score on
obstacles, CA1 83
Chart 7.1.3. Cluster’s average capacity utilization in function of aggregated cluster score on
obstacles, CA1 84
Chart 7.2.1. Clustering 2: Practices of competitors in the informal market vs. Corruption 85
Table 7.2.1. Country distribution and aggregated scores on obstacles, CA2 86
Table 7.2.2. Average annual sales per cluster, CA2 86
Table 7.2.3. Occurrences of bribery per cluster, CA2 87
Table 7.2.4. Clusters’ aggregated scores and performances, CA2 88
Chart 7.2 2. Average annual sales within cluster in function of aggregated scores on
corruption and informal competition, CA2 89
Chart 7.2.3. Cluster’s performance in terms of sales increase in function of aggregated
scores on corruption and informal competition, CA2 90
Chart 7.3.1. Clustering 3: Inadequately educated workforce vs. Transports 91
Table 7.3.1. Country distribution per cluster, CA3 92
Table 7.3.2. Average annual sales and obstacle scores 92
Table 7.3.3. Labor characteristics and scores on inadequately educated workforce 93
Table 7.3.4 Scores on inadequately educated workforce and average cluster performances 94
Chart 7.3.2. Average annual sales within clusters in function of aggregated score on
transport and inadequately educated workforce, CA3 95
13
Chart 7.4.1. Firms duplicates contained in the least affected cluster 96
Table 7.4.2.. Firms duplicates contained in the most affected cluster 96
Chart 7.4.2.. Firms duplicates contained in the most affected cluster 96
LIST OF ABBREVIATIONS
14 BRIC Brazil Russia India China: common acronym to describe these large emerging
economies
FDI Foreign Direct Investment
GDP Gross Domestic Product
IBGE Instituto Brasileiro de Geografia e Estatística
NBFI Non Business Financial Institutions (including MFI)
MFI Microfinance Institutions
MSME Micro Small and Medium Enterprises
OECD Organization of Economic Cooperation and Development
PCB Private Commercial Bank
ROA Return on Assets
ROE Return on Equity
SEBRAE Serviço Brasileiro de Apoio às Micro e Pequenas Empresas
SOB State-Owned Bank
SME Small and Medium Enterprises
15
1.
INTRODUCTION
Brazil and China, two major economies of the loose BRIC group, have been compared on many
grounds, but little light has been shed on their respective small and medium enterprises (SMEs)
development. Both promised to a bright future, China and Brazil SME sectors do not observe the same
performance in terms of competitiveness and growth. Although institutional development in Brazil
seems to have reached a higher level than in China (including a widespread banking system and a
more sophisticated legal framework), Chinese firms apparently manage to perform better than their
Brazilian counterparts. This success, often attributed to the Guanxi1, a set of informal practices
complementing the institutions’ deficiencies, could for the most part actually be traced back to their
demographic power. Nevertheless, interrogations remain on the cause behind the success of Chinese
private enterprises. Is it because they benefit from a more facilitating business environment than firms
in Brazil? In this research, we chose to focus on SMEs, whose essential role in economic development
has been discussed by many scholars.
Besides the profound differences in their economies, China and Brazil share common characteristics
which make them particularly interesting to compare: they both experienced a rapid development of
the SME sectors, starting in the 1980s; they were both subject to a period of intense GDP growth in
the early 2000s and both are still coping with common issues that affect emerging countries such as
lack of infrastructure, low levels of legal enforcement, high regional inequalities and institutional
deficiencies. The two countries are becoming increasingly interdependent, with China becoming the
main export partner of Brazil in 2009, (Latin American Herald Tribune2).
In studying the main obstacles to business for SMEs in Brazil and China, the main objective is to to
identify the variables that are significantly impacting firms’ operations and growth. One objective of
this research work is to make a distinction between country variables and the inner characteristics of
firms. In order to do so, this thesis proposes the following research question:
How do the Brazilian and the Chinese business environments affect firm growth? (a cross-country analysis on the main obstacles to business)
1
Guanxi refers to networks or connections that are facilitating business operations by providing support and cooperation among the parties involved. Guanxi is known to be a structural cultural principle in Chinese society. 22
16
In answering this question, we will get support from the World Bank Enterprise Survey which
provided valuable data on the two countries, allowing the comparison. As discussed in Section IV, this
data has been collected in order to be as representative and reliable as possible. What makes this thesis
really innovative is first that nobody has ever compared China and Brazil using this dataset, given that
the survey’s release date is quite recent. This work will also intend to innovate in the methodological
tools used to analyze the data. We will use quantitative analysis and a qualitative approach including a
cross-country analysis and three different cluster analyses in order to identify both differences and
similar patterns between Chinese and Brazilian SMEs. Our main objective is to highlight differences
between the two countries and to draw similar patterns according to firms’ characteristics in order to
be able to anticipate firms’ behaviors when facing a set of obstacles.
Thanks to these two methods of comparison, we will identify what types of variables have an impact
on the perceived obstacles to a firm’s operations. We will also assert the differences between
perceived obstacles and the objective constraints faced by business owners in their daily operations.
Finally, we intend to draw a portrait of firms that are typically impacted by one obstacle rather than
another. Of course, this work is not exempt from biases, whether from methodological issues or the
data itself. Nevertheless, we paid extra attention to those possible methodological flaws in drawing our
conclusions.
On a more personal level, I do think this research work complements the academic focus I have
undertaken on economics in emerging markets, and that it will be valuable in my future career in the
sector of economic development. I truly believe that supporting the development of a strong SME
sector is at the core of economic development policies, given the SME sector’s importance on GDP
contribution and employment. The stakes are high, and worth further research to identify what really
matters to the development of SMEs. I therefore hope this work can contribute to increase knowledge
17
2.
LITTERATURE REVIEW
2. 1. The role of SMEs in economic growth
A large body of literature has acknowledged the importance of SMEs in economic growth. Ayyagari,
Beck, Demigürç-Kunt (2007) first used World Bank data to find that SMEs employed more than 50%
of the formal workforce for 48 out of the 76 countries covered in the analysis. In Brazil for instance,
their study showed that SMEs accounted for 60% of all formal jobs. In general, economists have
observed a strong correlation between SME contribution to the formal economy and the country’s
state of development. While in middle income countries, SMEs represent 55% of employment and
39% of GDP; this percentage reaches 65% and 52% respectively in high income economies. Beck,
Demigürç-Kunt and Levine (2005) assert that a large SME sector in manufacturing is a characteristic
of a successful economy. Birch (1979) first acknowledged the importance of small firms in job
creation. His survey of American firms showed that those with less than 100 employees were
responsible for generating 80% of new jobs. Ayyagari, Demirgüç-Kunt and Maksimovic (2011)
further found that the size of firms is inversely correlated to their contribution to total employment and
the rate of job creation. The importance of SMEs in job creation can be explained by their greater
flexibility of operations and access to cheap labor (Mitra and Pingali, 1999). The ability to develop a
network of performing SMEs is therefore crucial as they contribute greatly to the building of a
dynamic and healthy economy. However, there is a controversy on the effect of the SME sector on
economic growth. Cravo, Gourlay and Becker (2010), in studying the link between the importance of
the SME sector and regional economic growth in Brazil, found that whereas the opposite may be true
for developed economies, the relative importance of SMEs in developing countries is negatively
correlated to economic growth. According to the authors, whether SMEs have a positive or negative
effect on a country’s economic growth depends on the amount of human capital accumulated within
companies, measured by the average schooling of employees. Even though the causal link between
SMEs and growth is open to debate, the size and the performance of the SME sector gives a first
indication of the impact of institutional bottlenecks on the business environment. Indeed, those
inefficiencies prevent firms from growing to their optimal size (Kumar et al., 2011).
2. 2. The fast development of SMEs in Brazil and China
One similarity between China and Brazil is the fact that their SME sectors have grown quite recently
and at faster pace than for developed countries. Since 1978 and China’s liberalization, the legal
framework and central government’s incentives have allowed SMEs to grow steadily. As rural
18
number of SME owners increased from 1 million in 1980 to 15 million in 1992 (Dana, 1999). In 1994,
SME development was further encouraged by the opening up of 14 coastal cities to FDI, which
provided urban SMEs with needed capital resources. During the 1980s, the Township and Village
Enterprise initiative has allowed SMEs in China to develop at a rate never experienced in any other
country (Sun, 2000) and played an essential role in the country’s industrialization. After 1990, the
Central Chinese government pursued reforms on enterprise governance structure and ownership which
marked the beginning of Sino-foreign corporations. Given their increasing contribution to Chinese
GDP and employment, the economic importance of SMEs was officially acknowledged in the 1997
Fifteen Party Congress. During this period, SME clusters in the provinces of Jiangsu, Zheijiang,
Guangdong and in Beijing blossomed thanks to increased competition, economies of scale and
reduction of transaction costs. In 2003, along with the definition of clear thresholds for SMEs, the
Chinese government enacted a law to foster fair treatment towards SMEs, which included specific
provisions seeking to facilitate market access to non SOE. On the other hand, China’s accession to the WTO in 2001 has increasingly put pressure on Chinese SMEs to comply with international regulations
on trade and labor standards. In 2008, the crisis hit Chinese SMEs hard, with 20% of them going
bankrupt in March 2009, according to the Chinese Academy of Social Sciences, a government think
tank. Despite being more affected by the crisis, SMEs received fewer help packages from the
government which resulted in a slower recovery. Nowadays, Chinese SMEs are concentrated in 600
industrial zones with a combined output value of more than CNY 100 billion, accounting for 50% of
the total industrial output and 80% of formal employment. Within these zones, 5 clusters generated
outputs exceeding CNY 30 billion (Xiangfeng, 2007). In 2009, the Chinese Public Innovation Fund
granted a CNY 1.7 million package to technological SMEs.
For a long time, the Brazilian legal framework has blocked SME development. In 1981 for instance,
an export license required “1,470 separate legal actions with thirteen government ministries and fifty agencies” (Rosenn, 1984, p.21). With Brazil’s liberalization and the gradual state withdrawal from
large corporations with massive privatization in the 1990s, firms’ average size has shrunk (Salama,
2006). Between 1996 and 2002, the amount of micro and small enterprises grew 57% and 51%
respectively, compared to only 15% and 12% for medium and big companies (SEBRAE, 2012)3. The
rise of the SME sector fluctuates depending on economic regions : whereas between 1985 and 2000,
the amount of small companies increased by 56% in the North and 42% in the North-East, this number
only reached 18% for the South-East region (SEBRAE, 2012). Only in 2006 the Brazilian government
implemented the “Juro Zero Program” addressing innovative SMEs’ financial needs, offering zero
coupon loans from BRL 100,000 to BRL 900,000 (OECD, 2010).
3Figures calculated with Sebrae’s t
19
Currently, large amounts of public financial resources are allocated to the development of SMEs
through SEBRAE, whose budget was USD 1.25 billion in 2009 and 1.6 billion in 20114.
2. 3. The SME sector’s contribution to the economy in Brazil and China
According to their respective national definitions, SMEs in Brazil and in China represent the vast
majority of all formally registered enterprises. In 2008, SEBRAE registered 5.8 million SMEs –
compared to only 17,000 large companies - which accounted for over 99% of total enterprises
(SEBRAE, 2010, p.35). The share of microenterprises (less than 20 employees) was 94% in the same
year. In China, small enterprises according to the national definition (with a threshold from 100 to 600
employees depending on the sector) accounted for 98% of total formal enterprises in 2007, with 2.3
million entities registered (Wang, 2009)5.
In 2008, Brazilian SMEs provided 17 million formal jobs which represent 68.7% of all formal
employment in relative terms while microfirms accounted for 24.5% of the total share (SEBRAE,
2010, p.179). At the same time, the employment growth rate was significantly higher for large scale
firms in the 2004-2008 period: 20% compared to 13% (SEBRAE, 2010, p.179). With the Chinese
encompassing definition of SME (See Table 3.1.3 on section 3.1), SMEs generate 82% of total
employment opportunities in China, with small enterprises employing 51% of all formally employed
Chinese.
More importantly, while having fewer enterprises formally registered, the Chinese SME sector’s
contribution to the economy is significantly higher than in Brazil. The total output of Chinese SMEs
accounts for at least 60% of the country’s GDP (Asian Development Bank Institute6
,2014 ; Xiangfeng,
2008). In Brazil, the president of SEBRAE, Carlos Alberto dos Santos admitted that small and micro
firms only accounted for 20% of Brazil’s GDP, while medium sized enterprises did not play a significant role in the national economy. This difference between China and Brazil, while partly
explained because the Chinese definition includes larger firms, may be a symptom of the higher
obstacles faced by Brazilian SMEs, resulting in a negative impact on their productivity.
4
Information available on www.sebrae.com.br
5
It is important to notice that Brazil reported more than twice the number of small enterprises, a gap that may be explained by significantly higher levels of informality in the Chinese business environment or by the use of different thresholds implied in their national definition of small companies.
6
20 2. 4. Impact of business environment on firm growth
While Batra, Kaufmann and Stone (2003), along with Ayyagari, Demirgüç and Levine (2005), have
paid particular attention to the cross-country similarities concerning the impact of the business
environment on firm growth, proving a strong correlation between business environment and firm
size, Dollar, Hallward-Driermeier, and Mengistae (2005) have studied this relationship for a smaller
group of countries (Bangladesh, India, China and Pakistan). They have used the standardized survey
of the World Bank (Investment Climate Survey, 2003) on a large number of companies to identify
how infrastructure bottlenecks affect firm growth, showing that international integration is more likely
to happen in a favorable business environment. Their study seeks to explain why China has succeeded
where many other comparable countries (emerging Asian countries with same levels of GDP) in the
same region have failed or had mitigated success. Similarly, they provide more evidence that
improving the business environment by cutting customs clearance procedures, building efficient
infrastructure and making financial services available affects significantly the probability of a firm
exporting. Studying the African region, Freund and Rocha (2010) find that bureaucratic custom
practices explain most of the limitations to trade. Nevertheless, in order to get an exhaustive analysis
of the correlation between a given business environment and firm growth, it is essential to go further
than just study country variations.
2. 5. Business environment and the characteristics of firms
Aterido, Hallward-Driemeier and Pagés’s analysis (2007; 2009; 2010) shows that the business
environment affects firms differently, depending on their size. Indeed, small firms are exposed to
obstacles and constraints while big firms are able to hedge against them. For instance, small firms
experience more power shortages on average, while large firms, which may be more
electricity-intensive, tend to secure their own power supply (Gelb et al., 2007). The result is that a poor electricity
grid will have a direct impact on the growth rate of SMEs, while only an indirect impact on those of
large firms. Gelb et al. (2007) also studied the variations on perceived obstacles across firms of
different sizes. Using subjective answers on a questionnaire about the investment climate in 26
African countries, they showed that small firms tend to complain more than large firms on issues
regarding finance or access to land, for example; while other perceived obstacles such as corruption or
infrastructure are less scale-dependent. Using the same model, taking into account the perception of
potential constraints, Beck, Demirgüç-Kunt and Maksimovic (2005) found that regardless of the
21
Woodruff (2007) also found that firm location may be an essential determinant to explain the extent to
which a firm is impacted by the business environment.
2. 6. The elements of the business environment impacting firm growth
Basing their work on the World Bank Enterprise Survey, (World Bank and IFC MSME Country
Indicators, 2010) Kushnir, Murmulstein and Ramalho (2010) analyzed the data of MSMEs from 98
countries and tried to establish a common hierarchy of the most binding obstacles. Out of 15 main
obstacles identified in the Enterprise Survey, the most commonly cited as being the biggest obstacles
to the operations of SMEs are in decreasing order: electricity, access to finance, practices of the
informal sector, tax rates, political instability and corruption. Empirical evidence supports the view
that a more efficient judicial system – at the basis of the institutional framework – is correlated with
the presence of larger firms. Kumar, Rajan and Zingales (2001) further argue that improving a
country’s patent protection system leads to an increase in the size of R&D intensive enterprises. These
results advocate for an institutional explanation behind cross-country differences in firm size. Dinh
(2010) focused on developing countries and identified the more binding obstacles on firms operations.
For him, in a majority of developing countries, informal sector competition and access to finance are
the most binding constraints affecting firms’ growth rates, especially for smaller sized firms. In assessing firm growth, he measured the evolution in employment figures; using both objective and
subjective answers to identify the most binding constraints. Klapper, Laeven and Rajan (2006) studied
the impact of different elements of the investment climate on the entry of new firms. High registration
costs hinder business creation and growth, while financial regulations and property rights protection
promote firm creation and growth. Demirgüç-Kunt, Love, and Maksimovic (2006) complemented the
existing literature by providing empirical evidence on a survey with data covering 52 developed and
developing countries. They specifically investigated the drivers of and the gains from incorporations.
Their results show that there is a higher probability of firm incorporation in countries with strong
shareholder and creditor rights, effective bankruptcy legislation and better developed legal and
financial systems. Nevertheless, the causal link with firm growth is not evident, since incorporated
enterprises only register faster growth rates in countries with better institutional development. It only
suggests that the legal status of firms can be an indicator of the country’s institutional development, since incorporated firms are more efficient in a formal institutional framework, whereas
unincorporated firms tend to perform better in countries with less-developed institutions.
What interested most of the scholars is the extent to which each particular element of the business
environment affects firm growth. Indeed, some factors may only have an indirect effect, while others
22
environment variables, Ayyagari, Demirgüç-Kunt and Maksimovic (2006) pointed financial
constraints, crime and political instability as directly affecting firm’s growth rates. Among those three
factors, finance is the most robust variable impacting the rate of growth of enterprises.
2. 7. External factors determining firm growth
In studying the impact of business environment constraints on the growth of firms, we must
acknowledge the external factors that may impact the size of these companies. You (1995), for
instance, identified a potential connection between a given country’s comparative advantage and the
average size of its firms. If a country has a comparative advantage for a good efficiently produced in
large firms, it may show a higher than average density of large firms. Institutional theories also
suggest that the size of firms is a result of the margin between intra-firm transactions and market
transactions (Coase, 1937). Brüderl, Preisendörfer and Ziegler (1992) also argue that business owners
with higher academic achievements tend to be more innovative, which has a direct impact on firm
growth. Lorunka and al. (2011) further found that the amount of capital at start-up, the gender of the
entrepreneur and the growth strategy of a firm are essential determinants predicting growth for small
firms. Moreover, empirical evidence suggests the growth of small firms is directly linked to the
entrepreneur’s ambitions. Surveying small businesses, Kolvereid and Bullvag (1996) actually found
that almost 40% of the responding entrepreneurs did not want their firm to grow. This result is
possibly due to some countries’ legal framework which can require a lot of paperwork and often imply
an increasing tax burden when firms achieve a certain size. The entrepreneur’s aspiration to grow is
significantly correlated with his educational achievement, the industry he is operating in and the firm’s
past growth turnover and growth in the number of employees. Similarly, while emphasizing the
existence of external, internal and social barriers, Gaskill and al. (1993) also found that the lack of
managerial skills, training and education is often responsible for the failure of small businesses.
2. 8. Access to finance and credit constraints
In 2001, the World Bank stated that a significant part of the economic growth differences across
countries were to be explained by their level of financial development. Since financial constraints –
including the access to and the cost of finance – have been identified by a significant number of SMEs
as the primary barrier to growth (Beck, 2007) and access to finance is proven to have a direct impact
23
and Zingales, 1999); it is important to focus on this feature. First, recent research reinforces the fact
that SMEs face bigger financial obstacles in financing their operations than large firms (Beck,
Demirgüç-Kunt and Maksimovic, 2005; Ayyagari, Demirgüç-Kunt and Vojislav; 2006; Beck, Laeven,
Maksimovic 2006). Cole (1998) also found that firms with pre-existing saving accounts are more
likely to be granted a loan. Furthermore, different background conditions lead to different levels of
financing constraints across and within countries (Laeven and Woodruff 2007).
The lack of access to external finance does not only have an impact on the cost firms have to pay for
new investments, it can also prevent firms from making necessary investments. The link between the
lack of external finance and firms being credit constrained has been documented recently by Banerjee
and Duflo (2010). Using a sample of 253 SMEs in India, they studied the evolution of sales before and
after firms become eligible for loans at subsidized interest rates. They observed that instead of just
using subsidized loans to replace other more costly sources of financing, the borrowing firms
expanded their sales proportionally to the newly available credit resources. They both used the
subsidized credit to expand their activities while still using internal sources of financing, which further
supports the assumption that they were previously credit constrained. Following the same pattern, Zia
(2008) observed in Pakistan that a group of small firms were forced to reduce their sales after they
became ineligible for subsidized credit, while large firms facing the same ineligibility did not. The
1999-2000 World Business Environment Survey provided more extensive cross-country evidence;
using a large sample of 10,000 firms in 80 countries. Beck, Demirgüç-Kunt and Maksimovic (2005)
found that the probability of experiencing slow output growth is directly linked to the business
owner’s identification of finance as a major constraint. As seen before, financing obstacles affect
SMEs more than large companies. Specifically, they measured that financing constraints reduce small
enterprise growth by 10 points on average. The required collaterals, bank paperwork and interest rates
payment represent a far more constraining obstacle for SMEs than for large companies. As small
business owners are often asked to back their loans with personal collaterals, this may discourage new
investments as it implies high levels of risk for the individual (Avery et al., 1998). Furthermore, SMEs
do not benefit from the access to other forms of financing such as leasing, export or loans extended by
foreign banks. Indeed, in addition to financial selection, international banks are often located in large
business centers away from SMEs (Clarke et al., 2001). When compared to legal obstacles and
corruption, financing constraints have the most significant impact on reducing firm growth. The
authors also highlight that many other business environment obstacles are actually related to finance.
The lack of credit availability impacts sectors and regions differently. Sectors that are naturally
composed of capital intensive firms – such as the chemical industry – are more impacted by credit
24
An interesting assumption was brought up by Sleuwaegen and Goedhuys (2002) while they were
studying firm size distribution in Ivory Coast. In a situation of limited access to inputs, and more
significantly to credit, small firms tend to grow slower and large firms faster than in a financially
developed country. This results in the “missing middle”, where there is a lack of medium sized
enterprises, a profusion of small and some large companies.
The availability of external finance leads to two main positive effects for existing firms. First, they can
properly exploit investment opportunities in order to reach their efficient size. Secondly, they can
increase the productivity of their portfolio and choose more efficient organizational forms. Improving
the availability of external finance also leads to an increase in the number of start-ups, (Beck,
Demirgüç-Kunt and Honohan, 2009) and is positively correlated with innovation (Rajan and Zingales,
2003) and productivity. This link between the access to external finance and innovation and
productivity is particularly observed when focusing on bank finance. Recently, Kutchev, Ramalho,
Rodriguez-Meza and Yang (2013) provided evidence that firms showing high levels of labor
productivity are less likely to be credit constrained. Additionally, firms with higher turnover
(sales/asset ratio) and lower sales volatility are expected to have a better access to formal credit.
While evidence shows that financing constraints tend to hurt SMEs more than larger firms, it also
suggests that they are the ones benefiting the most from the country’s financial development (Laeven,
2003), while large firms see their financing constraints increase in case of financial liberalization – due
to the increasing competition among firms. For instance, looking at 36 industries in the manufacturing
sector covering 44 countries, Beck, Demirgüç-Kunt, Laeven and Levine (2005) observed that financial
development led to disproportionate growth benefits for the small-firm intensive industries, such as
furniture. In more details, Galindo and Micco’s work (2005) suggests that improving systems of
credit information – both by providing increasing amount of information and by improving its quality
– has a direct impact on the access to financing. Indeed, greater information opacity and the absence of
external audit prevent small business owners to credibly convey the quality of their investment
projects (Berger and Udell 1998; Binks and Ennew 1996). Regarding new entries, Aghion, Fally and
Scarpetta (2007) found in their survey of European firms that financial development leads to the
higher pace of new firms’ entry in sectors that rely heavily on external finance. Additionally, access to
financial services may be essential to the survival of start-ups beyond one year, as shown in
Demirgüç-Kunt, Klapper and Panos’ study of Bosnian entrepreneurs (2009).
To sum up, the existing literature seems to point out the access to finance as one of the main
25 2. 9. Barriers to firm growth in China
Most scholars are focused on finding common patterns to link business environment variables and
firms’ performance. Nevertheless, a significant body of literature chose to look at the particularities of the Chinese context.
First, it is important to acknowledge the importance of the SME sector’s contribution to the Chinese
economy. Since the 2004 constitutional amendment that allowed non-state-owned SMEs to gain a
legal status, the number of Chines SMEs has grown to reach 42 million. Furthermore, they contribute
to 60% of China’s total GDP and 80% of urban employment.
A significant contribution is that of Zhu, Whittman and Peng (2012) who interviewed 82 Chinese
managers and owners of 41 SMEs. By conducting the face-to face interviews, they indentified five key
institutional constraints to SME innovation in China, namely in order of importance: competition
fairness, access to financing, laws and regulations, tax burden and, finally, support systems.
Reid and Xu (2009) further investigated the determinants of firm growth and survival in China. They
gathered empirical data on 83 privately owned Chinese firms in the province of Guangdong between,
2004 and 2006, of which a majority where SMEs. To explain the variations in firms’ growth and
survival rates, they used both firm specific variables (age, size, business planning, among them) and
environmental variables (firm location). They built on existing research to create a comprehensive
model, not only limited to age-size variables. They measured growth in terms of employment (number
of full time employees) and sales. Their main findings were that age and growth alone are insufficient
to explain the difference among firm growth rates, and that factors like the choice of location, the
intensity of competition, and the demand price elasticity have to be considered.
The case of China is especially interesting to study because of the specificities of its financial
environment. According to the work of Banerjee and Duflo (2004) greater banking depth enables
firms to grow and the economy to develop so countries or provinces where the highest banking
capillarity is observed are expected to show the highest growth rates. However, the opposite is
observed in China. Differences in growth rates between Chinese provinces are highly and negatively
correlated with banking depth (Boyreau-Debray and Wei 2005). Given that the central state has been
controlling the banking system, resources were mobilized to pour into the declining Chinese
state-owned companies, which led to a sub-optimal use of credit and credit scarcity for private firms. The
Chinese banking system, while showing among the highest levels of capillarity in the world, has not
contributed significantly to the country’s growth. China may be an example illustrating that a banking
26
differences with other developing countries in the significant role played by the informal financial
system in its economy (Allen, Qian and Quian, 2008). In a context where inefficient state-owned
banks are pervasive, informal financing has compensated for the lack of external finance in providing
financing resources to SMEs in China. Nonetheless, studying a sample of Chinese firms, Ayyagari,
Demirgüç-Kunt, and Maksmovic (2007) noticed that, on average, firms that had access to formal
finance were experiencing faster growth. This empirical evidence suggests that informal finance is
only a second-best option even if the result can be partially explained by the banks’ selection bias.
Still, for our research, it is interesting to assess the impact of informal finance on perceived and
objective financial constraints for Chinese SMEs.
2. 10. Barriers to firm growth in Brazil
Looking at regional data first, Ayyagari, Demirgüç-Kunt, and Maksmovic (2006) observed that Latin
America showed the highest crime and judicial inefficiency perceived obstacles compared to the rest
of the world. Stone, Levy and Paredes (1992) were among the first to notice that while Chile enjoyed a
better legal and regulatory environment, Brazil reduced the gap by using effective informal substitutes.
In their empirical study, Brazilian garment entrepreneurs ranked policy uncertainty, price instability,
inflation and a high tax level as being the most serious obstacles to their firms’ growth7. In Brazil,
SMEs’ failure rate in the first three years is 50% (SEBRAE, 2012).
Brazil is infamous for its high levels of bureaucracy. When comparing institutional efficiency in Chile
and in Brazil, Stone, Levy and Paredes (1992) observed that Brazilian institutions often implement
rigid and complex regulations, regardless of the cost for the business, which are unable to deal with
“day-to-day problems in regulations and business transactions”(p.100).
Informality is also a preponderant issue in the country. According to SEBRAE’s figures, in 2008
approximately 9,5 million enterprises were not formally registered compared to the only 5.9 million
formal enterprises. As in China, the obstacles faced by formal SMEs on informal competition and tax
rate burdens as well as labor regulations are closely related. When a small company decides to register
formally, it loses its competitive advantage from not paying taxes and faces higher labor costs,
becoming more vulnerable to informal competitors.
7
Since a strong emphasis has been put on stabilizing the macroeconomic environment, we expect those results to
27
More recently, Kumar and Francisco (2005) have studied enterprise size, financing patterns and credit
constraints in Brazil, using data from the World Bank’s Investment Climate Survey. They first focused
on financing patterns, and found that on average, Brazilian firms’ working capital and new
investments were financed predominantly with internal funds, then bank credit and trade credits.
According to the authors, informal funding can be important in financing working capital. Their
results are consistent with the work of Crisóstomo, Iturriaga and González (2014) on a panel of
Brazilian companies between 1995 and 2006. Their study provides evidence that large Brazilian firms
mobilize significantly more external funds to finance their investments; 83% of large firms had
overdraft facilities or lines of credit compared to only 76% for small firms and 60% for micro-firms.
MSMEs are also charged significantly higher interest rates than larger firms. Interestingly, in Brazil,
commercial banks provide more financial resources to MSME than public banks. By examining the
managers’ average academic achievements, the authors were able to link it with the use of equity
finance and foreign bank finance.8
Examining credit constraints only, Kumar and Francisco (2005) point out that while 59% of large
firms have at least a bank loan, this proportion falls to 27% for micro-firms; 9.4% of microfirms have
seen their loan applications rejected and 38% did not even apply, even if they needed financing, in
most of the cases because of the cost related to the loan and the procedure complexity. Looking at the
determinants of credit constraints, they did not identify a robust statistical correlation with sales, but
more with sales evolution, since firms with decreasing sales experienced higher rejection rates. More
strikingly, their results show that location has a tremendous impact on firms’ access to credit. Indeed,
Kumar et al. (2004) also observed sharp variations in bank density between the South and South East
regions, relatively well covered by bank branches, and the North and North-East, where the access to
finance is limited. As a result, Kumar and Francisco (2005) provide evidence that Northern enterprises
use twice as much internal funds than other regions. They expect to find easier access to credit in the
states which benefit from higher bank capillarity. Kumar (2004) also found a strong correlation
between the manager’s level of education and its firm’s access to financial services in Brazil.
On a broader perspective, the main obstacles identified in Kumar and Francisco’s Survey of Brazilian
firm owners are, in decreasing order of importance: cost of financing (1), tax rates (2), corruption (3),
economic and regulatory policy uncertainty (4), macroeconomic uncertainty (5) and access to finance
(6). Their research further emphasizes the variation of perceived obstacles between firms of different
sizes: large firms are less likely to rank access to finance, corruption and tax rates as very significant
8
28
constraints to growth. Since their survey was conducted in 2003, one may expect to find some changes
29
3.
A NEW CONTRIBUTION TO THE LITERATURE
3. 1. The World Bank Enterprise Survey : a new common, comprehensive database
SME definition can vary widely across regions, countries, organizations and scholars; both in the
determinants chosen to assess the company’s size or the thresholds set to small and medium size
companies. For instance, Melle and Raymond (2001) used sales as the sole criterion, while Arroyabe
and Arranz (2001) considered both sales and number of employees as criteria. The widest variations
are observed in the number of employees: Bechetti and Trovato (2002) fixed the limit for SME at 100
employees, while Robson and Bennet (2000) set it to 200 employees and Haynes and Senneseth
(2001) to 500 employees. The European Union provides us with an exhaustive definition9, including
criteria on the number of employees, the firms’ turnover, the total balance sheet and the firm’s
independence10. Following this definition, a company may be classified as a medium enterprise if the
number of its employees does not exceed 250 people, its total assets are worth less than EUR 27
million or its annual turnover does not exceed EUR 40 million; and it is an autonomous enterprise11.
According to the same definition, a company is labeled “small” when it has less than 50 employees, a
turnover below EUR 7 million or assets not over EUR 5 million. Microfirms are companies with less
than 10 employees. In an attempt to come up with a universal definition of MSME, Gibson and Van
der Vaart (2008) suggested the following formula: “An SME is a formal enterprise with annual
turnover, in U.S. dollar terms, of between 10 and 1000 times the mean per capita gross national
income, at purchasing power parity, of the country in which it operates.”(p. 18)
As a result, cross-country analysis has long been restrained by this lack of common definition for
SME. It is especially true in the case of China, and that was part of the reason why the country was not
included in World Bank specific data until very recently, in 2011.
A large number of sources (1/3 of the countries in the world), including the OECD, the World Bank
and Brazil’s IBGE (1994) are using the cut-off range of 0 to 250 employees to define SMEs, where micro-enterprises have up to 9 employees, small enterprises from 10 to 49 and medium enterprises
from 50 to 249 employees.
In Brazil, the definition varies across public agencies and sectors. SEBRAE differentiates between
companies operating in the industrial, construction and agriculture sector, for which the threshold for
SMEs is 500 employees and companies operating in the commercial or service sectors, for which the
9
Source : http://ec.europa.eu/enterprise/policies/sme/files/sme_definition/sme_user_guide_en.pdf 10
30
threshold is set at 100 employees (See Table 3.1.1). IBGE uses a similar definition for SME, except
they only use a staff headcount criterion. Finally, BNDES, does not discriminate between sectors and
uses the sole criterion of annual turnover, with a threshold set at BRL 90 millions for SMEs (See
Table 3.1.2).
Table 3. 1. 1. The thresholds of the SME definition by SEBRAE
Enterprise category Industry, Construction, Agriculture,
others Commerce, Service
Staff Headcount
MICRO 1 to 19 1 to 9
SMALL 20 to 99 10 to 49
MEDIUM-SIZED 100 to 499 50 to 99
Annual gross revenues
MICRO ≤ BRL 360,000
SMALL > BRL 360,000 to ≤ BRL 3,600,000
Source: http://www.sebrae-sc.com.br/leis/default.asp?vcdtexto=4154
Table 3. 1.2. The thresholds of the SME definition by BNDES
Enterprise Category Annual Turnover
Micro ≤ BRL 2,4 million
Small > BRL 2,4 million to ≤ BRL 16 million
Medium-sized > BRL 16 million to ≤ BRL 90 million
Medium-large > BRL 90 million to ≤ BRL 300 million
Large-scales > BRL 300 million
(Source: BNDES, Circular N°11/201012)
In China, SMEs only gained access to a legal status in 2004. Previously, it was virtually impossible to
get data from Chinese private SME firms. The Chinese definition of SMEs varies across industries:
companies with up to 3,000 employees can still be considered SMEs, depending on the sector (Table
3.1.3). Generally, small enterprises, according to the national definition, have thresholds superior to
what most of other countries consider as medium-sized enterprises. For instance, in the construction
12
31
sector, a company is consider small if the number of its formal employees does not exceed 600 (SME
promotion law of China, 2003). Traditionally, Chinese official agencies also only collect data for large
firms (annual sales greater than CNY 5 million) while independent commercial data providers have
yet to establish their credibility. In this context, it has been a real challenge to gather credible and
comparable data across countries.
Table 3. 1. 3 SME thresholds in China
Size
Category Sectors
Employees number
Business revenues (CNY
millions)
Total assets (CNY millions)
Small
Industry < 300 < 30 < 40
Construction < 600 < 30 < 40
Wholesale < 100 < 30
Retail < 100 < 10
Transport < 500 < 30
Post < 400 < 30
Hotel &
restaurant < 400 < 30
Medium
Industry 300-2000 30-300 40-400
Construction 600-3000 30-300 40-400
Wholesale 100-200 30-300
Retail 100-500 10-150
Transport 500-3000 30-300
Post 400-1000 30-300
Hotel &
restaurant 400-800 30-150
Note : SME meet one or more of the conditions. ME should meet three conditions, otherwise they are SE. Source : SME Promotion law, 2003
We observed several attempts to gather data on SME’s business environment constraints in both China and Brazil ( Zhu, Whittman and Peng, 2011, Reid and Xu, 2009, Cravo, Gourlay and Becker, 2010)
but, before the WBES, the reduced sample size made their representativeness questionable. For
instance, Reid and Xu’s empirical study (2009), while providing valuable result, only covers 83
private firms. Furthermore, they had access to the firms’ managers through contacts with faculty
members at the Guandong University of Foreign Studies, which led to a significant bias in their
sample. Zhu, Whittman and Peng (2011) used an even more reduced sample in assessing
institution-based barriers to innovation in China, with only 41 SMEs analyzed.
The WBES, using a standardized format, is the first dataset allowing the analysis of large and
32
effort was made to get reliable data and check for the inconsistencies in answers making the WBES
the first large empirical set of data exploitable for cross-country analysis. It is also more
comprehensive than any of the surveys that were launched before, as it provides information on firms’
size, sales, level of international integration, managers, quality of the workforce, as well as
information on objective and subjective obstacles to firm growth, including financial, infrastructural
and institutional barriers.
The World Bank conceived the Enterprise Survey as an exhaustive assessment of national business
environments in order to identify deficiencies across countries and create a better climate for
investment and sustainable growth. The Enterprise Surveys are both collecting objective indicators
based on managers’ experiences and their subjective perception of their own business environment.
Since 2005, the WBES possesses a standardized methodology of sampling, implementation and
quality control that covers 116 countries, which allows comparisons across time and countries. First
reliable data was collected for China in 2011, which may be the reason for under-exploitation of the
results for research purposes. The sampling is chosen to be representative of the formal,
non-agricultural, private economy (state-owned companies are excluded from the sample and analyzed
separately in order to reduce biases). The World Bank’s final goal is to provide researchers with a
panel data to make it possible to analyze the evolutions in the business environment over time. Since
the survey is quite recent, only one or two standardized surveys per country are available so far, so the
time series are too short to be subjected to statistical analysis.
Still, numerous academic papers (e.g. Beck, Demirgüç-Kunt and Martinez, 2010; Kuntchev, Ramalho,
Rodriguez-Meza and Yang, 2013 ; Ayyagari, Demirgüç-Kunt, Maksimovic, 2011) have been written
using the Enterprise Survey samples, but none of them had a special focus on China and Brazil
similarities and divergences. This work will be the first one – to our best knowledge – to compare
these two major emerging economies while using the standardized method brought-up by the World
Bank. It will provide a detailed analysis on the obstacles faced by both countries, and will focus on the
impact of different obstacles on firm growth.
3. 2. Changing the scale of analysis
Basing their research on the World Bank Enterprise Survey, most scholars used the data to find
correlations between obstacles and growth restriction applicable to any country of the data set. The
approach in the work of Beck, Demirgüç-Kunt and Levine (2005) was to identify common
33
between firm size and business environment constraints. Their work provided general relations
between economic and growth firms and most commonly faced obstacles by SMEs.
Beck (2007) exposed in more detail the cross-country and cross-sector variations, highlighting that
smaller, younger and domestic firms report higher financing obstacles.
Some scholars studied variations across regions: Ayyagari, Demigürç-Kunt and Maksimovic (2006)
specifically studied the biggest perceived obstacles in Africa, Latin America, Europe and Asia. Their
results show that Latin America had the highest reported obstacles in crime and corruption whereas
Asian countries reported the lowest financial obstacles. Gaviria (2002) specifically focused on Latin
America, stressing the role played by crime and corruption reducing Latin American firms’
competitiveness. Schiffer and Weder (2001) provide regional averages on most binding constraints to
growth using the data set from the 2001 Global Investment Climate Survey.
Additionally, some scholars specifically looked at country data and variations across country
provinces or states. Using the Investment Climate Survey – former version of the WBES – Kushnir’s
analysis focused on China and found that the six most commonly cited obstacles by Chinese SMEs
were electricity provision, access to finance, practices of the informal sector, tax rates, political
instability and corruption.
Less emphasis was put in analyzing variations in obstacles encountered by SMEs within a given
country. So the purpose of this paper is to compare two seemingly unrelated and very different
countries13, China and Brazil, while also studying variation patterns inside the two countries. Our aim
is to build on existing literature in order to provide a more detailed analysis of SMEs’ obstacles to
growth in China and Brazil, both within and across the two countries.
3. 3. Beyond the traditional age-size determinants
Traditionally, research papers on obstacles to firm growth focus on age (firm’s creation date) and size
determinants (sales and number of employees) to explain most of the cross-firm and cross-country
variations (Evans 1987, Jovanovic 1982). One of the most valuable inputs of the Enterprise Survey to
improve empirical knowledge on SME constraints is that it covers a wide range of determinants, from
firm characteristics (age, size, experience of top manager, owner’s gender, legal status, number of
employees) to business environment characteristics (competitors, regulations, infrastructures). It
allows us to probe for potential determinants of firm growth and obstacles to growth. This research
13
34
aims to test other variables beyond age and size to see if any pattern exists between those
characteristics and firm growth obstacles.
3. 4. The comparison of both subjective and objective obstacles to firm growth
A dimension that has also been neglected in the existing body of literature is the comparison between
the perceptions of managers and actual business environment constraints. As both objective and
subjective questions are asked to managers, an interesting area of focus would be to assess the gap
between perceived and actually experienced constraints. For instance, we can analyze if the number of
power-outages experienced is correlated with energy being perceived as a major constraint to the
business operations. Regarding financial barriers, a significant number of questions are asked about
the average amount of collateral required for loans, the firms’ existing line of credit or overdraft
facilities or their application for new loans. This set of data may be compared with the managers’
perception on their firms’ access to finance.
This paper will also add a new dimension to the existing literature by applying cluster analysis to try to