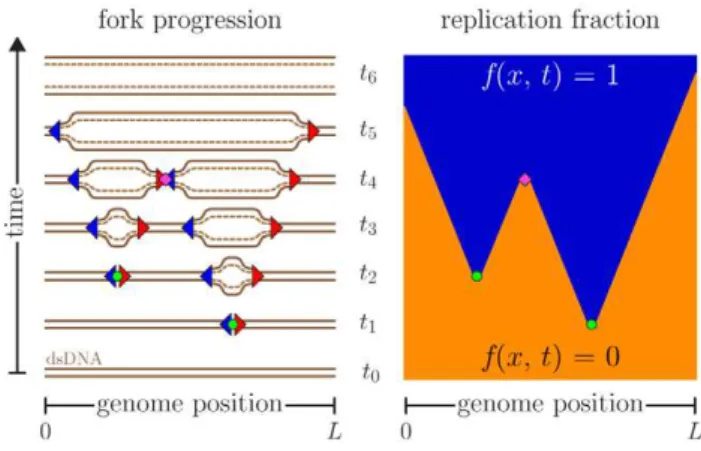
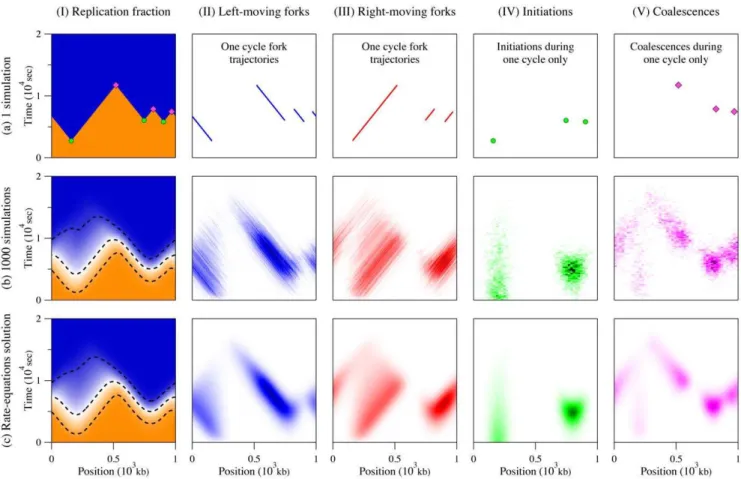
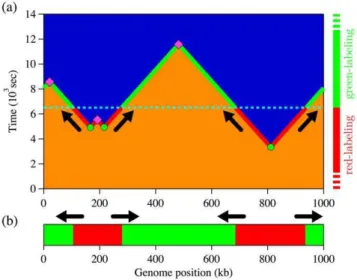
Modeling inhomogeneous DNA replication kinetics.
Texto
Imagem
Documentos relacionados
We also determined the critical strain rate (CSR), understood as the tangent of the inclination angle between the tangent to the crack development curve and the crack development
The iterative methods: Jacobi, Gauss-Seidel and SOR methods were incorporated into the acceleration scheme (Chebyshev extrapolation, Residual smoothing, Accelerated
The long-standing strand-displacement model of mammalian mtDNA replication (for which single-stranded DNA interme- diates are a hallmark) has been intensively challenged by a new set
Functional data have already demonstrated that the role of pre-RC members in plants is not limited to licensing DNA for replication, but is also related to the regulation of
diversas razões, nunca estudaram ou nunca conseguiram frequentar uma escola; continuar a educar a sua população e contribuir para o aumento da escolaridade da sua
social assistance. The protection of jobs within some enterprises, cooperatives, forms of economical associations, constitute an efficient social policy, totally different from
Abstract: As in ancient architecture of Greece and Rome there was an interconnection between picturesque and monumental forms of arts, in antique period in the architecture
Therefore, the objective of this study was to develop an equation that can be used to calculate the volume of gases produced using the pressure data obtained from the in vitro
