www.arch-anim-breed.net/58/177/2015/ doi:10.5194/aab-58-177-2015
© Author(s) 2015. CC Attribution 3.0 License. Archives Animal Breeding
Analysis of growth and feed conversion in purebred and
crossbred German Merinolandschaf lambs
K. F. Schiller, V. Grams, and J. Bennewitz
Institute of Animal Science, University of Hohenheim, Stuttgart, Germany
Correspondence to:K. F. Schiller ([email protected])
Received: 2 June 2014 – Accepted: 10 September 2014 – Published: 29 April 2015
Abstract. In this study, ewes of “Merinolandschaf”, a breed widespread in southern Germany, were crossed with rams of five meat breed types (Ile de France, Charollais, German black-headed mutton sheep (Deutsches Schwarzköpfiges Fleischschaf), Suffolk, Texel) and Merinolandschaf rams. The resulting lambs (179 individu-als) were fattened intensively from 55.3 days and body weight of 20.4 kg until 121.7 days and a weight of 40.9 kg. While fattening, feed intake was recorded and lambs were weighed weekly. Ile de France×Merinolandschaf and Texel×Merinolandschaf seem to be of greatest economic interest for intensive fattening because they showed the best feed conversion rate and energetic feed conversion rate. Only these crosses were significantly superior compared to purebred Merinolandschaf in feed conversion rate and also in daily body weight gain during the fattening period. Except Charollais×Merinolandschaf, all crosses showed at least a tendency of improvement in all three traits compared to Merinolandschaf, although this is not always significant. This underlines the ad-vantage of one-way cross-breeding for efficiently producing lamb meat. The growth was modelled with a linear model and the Gompertz model. The results showed that both models fit the data well, although the averageR2
was slightly higher and the average mean square error was slightly lower for the Gompertz model. In addition, the use of the Gompertz model provided some interesting biological insights concerning the growth of lambs and differences between the crosses, even though the lambs were slaughtered before reaching their mature body weight.
1 Introduction
The “Merinolandschaf” (ML) is a typical widespread breed of sheep in southern Germany. Sheep of this breed are com-pletely white, polled, with a wooled forehead and broad hanging ears. Body weight (BW) for adult is 80–90 kg for ewes and 120–140 kg for rams. These sheep have aseasonal reproduction and good fertility. This breed was originally de-veloped by crossing Merino sheep imported from Spain with local breeds with the intent of breeding robust sheep able to travel the summer to winter pastures routes but also which deliver improved wool quality (Sambraus, 2011).
However, due to the currently high costs for shearing and low wool prices, lamb meat production is an important source of income from sheep (Strittmatter, 2005). In order to improve the growth performance of fattening lambs, ML dams are frequently mated with a meat breed type sire to obtain F1 hybrid progeny. Naturally, the choice of the sire
line is of fundamental importance for optimising this one-way crossing system. In a previous study, five sire breeds were tested for their ability to produce high-quality F1 hybrid lambs (Henseler et al., 2014a, b). However, the important trait feed conversion rate was not considered in that study.
Addi-tionally these authors have shown genetic variability within and between breeds and discussed the use of this variability for breeding purposes.
The aim of the present study was to investigate the abil-ity of six sire breeds to produce F1 hybrid lambs with ML. The two important traits, DG and feed conversion rate (FCR), were considered. A further aim was to fit growth curves and to compare growth model parameters among the F1 hybrids.
2 Material and methods
2.1 Animals, feed and management
The experiment took place at the Oberer Lindenhof experi-mental station (moderate climate, 600 m above sea level, an-nual rainfall 752 mm) of the University of Hohenheim, Ger-many. In total 134 ML ewes were crossed with rams of six breeds: Charollais, Ile de France, German black-headed mut-ton sheep (Deutsches Schwarzköpfiges Fleischschaf), Suf-folk, Texel and ML. Each sire breed was represented by one ram. The ram was progeny tested in an earlier study with around 50 progeny produced with ML ewes (Henseler et al., 2014a). The average progeny yield for DG and other growth and meat traits of the selected rams was close to the mean of the respective breed. Hence, it is assumed that the selected rams are a representative sample of their breeds. Unfortu-nately it was not possible to include multiple rams per sire breed because there were no additional progeny-tested sires available.
The number of lambs as well as number of singletons and males per cross is shown in Table 1. Lambs were born in July and August 2012. During the fattening period, lambs were weighed weekly. Lambs were fed with hay (daily 200–300 g animal−1, 7 MJ ME (metabolisable energy) and
63 g kg−1CP (crude protein)) and concentrate (11 MJ ME
and 188 g kg−1CP) ad libitum. Total feed intake of hay and
of concentrate, and the sum of both, were determined. Due to limited space, six lambs from each F1 hybrid were housed in individual pens and the remaining lambs were housed in groups of 17 to 30 individuals. Lambs were slaughtered when reaching a finishing weight of approximately 41 kg BW.
2.2 Statistical analysis
Daily body weight gain over the lifetime (DGL) and during
the fattening period (DGF) were recorded for each lamb and
were analysed using the following statistical model:
yij kml=µ+SBj+BTk+SEXl+damm+eij klm, (1)
where yij kml is the trait record of lamb i (kg), SBj is the
fixed effect of sire breed j, BTk and SEXl are the fixed
ef-fects of birth type k (single or twin) and of sex l, respec-tively, and dammis the random effect of the dam. The dams
were assumed to be unrelated. The model was fitted using the MIXED procedure of SAS (9.2, SAS Institute, Inc., Cary,
NC, USA). The feed conversion rate traits (FCR, kg dry mat-ter (DM) feed intake kg−1G
F) and energetic FCR (eFCR,
MJ kg−1DG
F) were analysed as follows. The means of the
F1 hybrid were calculated from the corresponding group means and the variances were calculated from the trait values of the six lambs housed in the individual pens. The standard errors of the group means were approximated using these two parameters and the number of lambs in the groups. This way of estimating the standard errors was chosen because only six lambs per cross could be housed in individual pens and the remaining lambs had to be housed in groups. Differences between the means of the F1 hybrids were tested for signifi-cance using the Welch test.
Two types of growth curves were fitted to the weight records. The first one is the Gompertz model, for which the notation of Lambe et al. (2006) was used.
y(t)=Aexp
−exp
B eC−t A
, (2)
where t is the age in days when the weight y (kg) was
recorded,Ais the estimated mature body weight (kg),B is the maximum DG (kg),Cis the age at maximum DGF(days)
andedenotes the Euler number. The second model is a linear model,
y(t)=INT+bt, (3)
wherebis the average DG (kg) and INT is the birth weight (kg). The growth curves were fitted to the data of each indi-vidual using the NLIN procedure of SAS version 9.2. This resulted in three parameter estimates and their standard er-rors for the Gompertz model and two for the linear model for each lamb. The fit of the two models was analysed by cal-culating the mean square errors and theR2 values for each lamb and then averaged over all lambs. The parameter(A, B, C, INT andb) estimates were analysed using model (1), but using the reciprocal of the error variance of the estimated parameters (i.e. standard error squared) as weighting factors to ensure that individuals with more repeated measurements and hence lower standard errors where weighted stronger.
3 Results
3.1 Descriptive statistics of observations
The average birth weights are shown in Table 1. TX (Texel×ML) showed the highest birth weight, and IF (Ile
de France×ML) and SK (German black-headed mutton
sheep×ML) the lowest. Weaning BW, weaning age, BW
Table 1.Crosses of sheep breeds, number of lambs and means and standard deviation of birth weight, bodyweight and age at weaning and finishing of fattening lambs.
Birth Weaning Weaning Finishing Finishing BW, kg BW, kg age, days BW, kg age, days Cross Abb N Nmale Nsingle Mean SD Mean SD Mean SD Mean SD Mean SD Charollais×ML CH 35 13 16 5.2 0.8 20.7 3.3 53.9 6.9 40.7 1.6 125.6 18.9 Ile de France×ML IF 23 10 7 5.0 1.1 20.3 3.3 51.3 8.5 41.2 3.2 110.8 16.0 ML×ML ML 36 19 18 5.3 0.8 20.7 3.4 56.0 7.9 40.9 1.6 125.6 18.0 German black-headed SK 25 12 6 5.0 0.7 20.1 3.3 56.8 7.8 40.8 1.4 122.0 15.9 mutton sheep×ML
Suffolk×ML SU 36 11 9 5.1 1.0 19.6 2.7 57.2 9.4 40.7 1.3 125.9 19.7 Texel×ML TX 24 12 10 6.0 1.0 21.2 4.2 55.6 10.3 40.9 2.1 114.2 21.6
Table 2.Effect of cross on daily feed intake (g) of hay, concentrate and sum of both during the fattening period of lambs.
Hay+
Cross Hay Concentrate concentrate Mean SE Mean SE Mean SE CH 246a 7 1418c 9 1664c 15 IF 241a 10 1475d 21 1715d 22 ML 298b 11 1246a 28 1543a 24 SK 249a 15 1327ab 30 1575ab 27 SU 309b 11 1291ab 26 1601abc 30 TX 293b 10 1330b 15 1623b 15
abcdWithin a column, values with different superscript letters (a–d) differ
significantly atP≤0.05.
3.2 Feed conversion and growth performance
The feed intake means are shown in Table 2. They varied significantly across the crosses for all three components con-sidered (hay, concentrate and total). The highest (lowest) to-tal feed consumption was observed for IF (ML). The feed conversion rates are shown in Table 3. Both FCR and eFCR varied significantly across the crosses. The lowest FCR was determined for IF and TX (4.5) and the highest for CH (5.5). The eFCR was found to be the lowest for TX (50.7) but with-out a significant difference from IF; the highest was found for CH (63.2). The least square means of DGF and DGLare
shown in Table 3. DGFis consistently above DGL, except for
CH. The daily body weight gain during the fattening period and DGLvaried significantly across the crosses. The lowest
values were observed for CH and ML and the highest for IF, though for all three crosses, differences from other crosses are sometimes not significant for DGFand DGL.
3.3 Growth models
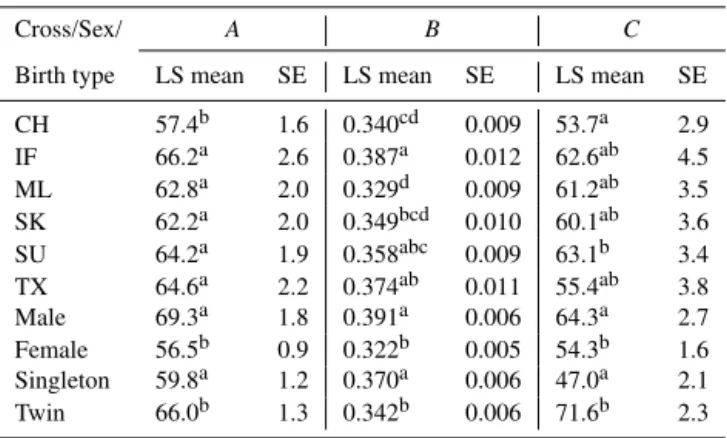
The estimated parameters of the Gompertz model are shown in Table 4. ParameterA(estimated mature body weight) was more or less constant for all crosses. Only for CH is the
es-timated mature body weight significantly lower compared to the other crosses. ParameterB (maximum daily gain) and
C(age at maximum daily gain) showed more variability be-tween the six crosses. The numerically highestB value was estimated for IF and the lowest for ML. Lowest C value was observed for CH and highest for SU. Males and twins (Table 4) compared to females and singletons respectively, showed higher estimated mature body weight. The same holds true for parameterC. Maximum daily gain is higher for males and for singletons. The Gompertz model fit the data well, as indicated by the high averageR2value of 0.994 and low average MSE of 0.789.
The results of parameters of the linear model (INT andb) are shown in Table 5. Both parameters varied significantly across the crosses. The lowest birth weight (parameter INT) was estimated for SU and SK and the highest for CH and TX. The highest average daily gain (parameterb) was es-timated for IF and the lowest for ML. Males and twins in particular showed lower estimated birth weights (Table 5). Males also showed a higher estimated DG; the same holds true for singletons. The goodness of fit of the model was also high with an averageR2value of 0.987 and average MSE of 1.521. However, the fit was slightly poorer than the fit of the Gompertz model, which becomes especially obvious when comparing the MSE of both models.
4 Discussion
First of all, the weakness of the experimental design has to be acknowledged. It was not possible to include more rams per sire breed because there were no additional progeny tested sires available. In addition, it would have been better to house all lambs in individual pens, which was however not possible due to the limited test capacity on the research farm.
4.1 Describing parameters at birth, weaning and finishing
Table 3.Effect of cross on FCR, eFCR, DG during the fattening period and over the lifetime of fattening lambs.
Cross FCR, kg DM kg−1 eFCR, MJ ME kg−1∗ DG∗∗F DG∗∗∗L Mean SE Mean SE LS mean SE LS mean SE CH 5.5d 0.2 63.2c 2.0 297.4c 7.2 298.7cd 6.1 IF 4.5a 0.1 51.2a 1.5 374.1a 8.9 345.3a 7.5 ML 5.0c 0.1 55.8b 1.5 294.0c 7.1 288.5d 5.9 SK 4.6b 0.2 52.6ab 1.8 329.2b 8.7 312.8bc 7.3 SU 4.9c 0.1 54.5ab 0.8 338.1b 7.4 313.5bc 6.1 TX 4.5a 0.2 50.7a 1.8 350.3ab 8.7 322.1b 7.3
∗MJ ME=megajoule metabolisable energy,∗∗results from model (1) effect of the sire breedP <0.0001,∗∗∗results
from model (1) effect of the sire breedP <0.0001,abcdWithin a column values with different superscript letters (a–d) differ significantly atP≤0.05.
before the fattening period started. Also, the finishing weight, which is highly dependent on the decisions of the producer or responsible scientist, did not show much variance. In con-trast, differences were found in finishing age, which indicates an influence of cross on the age of lamb reaching slaughter weight.
4.2 Feed conversion and growth performance
There are significant differences in feed intake (Table 2). Higher feed intake indicates a higher potential of nutrient intake. This might be an advantage under extensive condi-tions because a lower energy content of the feed can be com-pensated for by a higher amount of consumed feed. IF and TX seem to have the highest growth potential because they showed highest DGF and DGL. The daily body weight gain
during the fattening period of purebred male individuals of meat breeds and ML under similar conditions were reported to be higher in other studies than found in this study (Ta-ble 3). Engelhart and Eckl (2012), who considered only pure-bred male lambs, reported a DGF of 362 g day−1for Texel,
438 g day−1for ML, 445 g day−1for German black-headed
mutton sheep, 458 g day−1for Ile de France, and 468 g day−1
Suffolk. Bildungs- und Wissenszentrum Aulendorf (2005) reported a DGFof 360 g day−1for ML and CH, 359 g day−1
for TX and 409 g day−1for SU.
Depending on the diet and breed, different FCR for sheep have been reported in the literature, e.g. 8.8 to 17.8 kg feed per kg bodyweight gain for different selection lines of Merino and different diets (6.3 to 9.2 MJ ME kg−1DM)
(Doyle et al., 2011). Fahmy et al. (1992) determined FCR of 4.99 to 5.76 kg DM kg−1weight gain for different breeds and
crosses including Booroola Merino and Suffolk with feeds of different protein qualities. Engelhart and Eckl (2012) tested purebred male individuals of several meat breed types. The eFCR varied between means of 30.9 for Texel to 32.9 for German black-headed mutton sheep. These figures are low those values found in this study (Table 3), probably be-cause Engelhart and Eckl (2012) considered only purebred
male lambs which were expected to be above the mean of a population.
4.3 Growth models
As can be seen from the MSE andR2, the fit of the Gom-pertz model was improved compared to the linear model, although both fit the data well. In contrast, Daskiran et al. (2010) reported the bestR2results for logistic model. Gbang-boche et al. (2008) determined Brody to be the best fitting model, but reported a lowerR2 for all models than in this study and also used a slightly different Gompertz model. Topal et al. (2004) determined a better fit of the Gompertz model compared to Brody, Logistic and Bertalanffy models for growth of Morkaraman sheep, but for Awassi sheep, the Brody model showed better fit. On the other hand, Yildiz et al. (2009) and Lambe et al. (2006), who used the same model as used in this study, came to the result that the Gompertz model described the growth of their lambs best compared to various other linear and non-linear models.
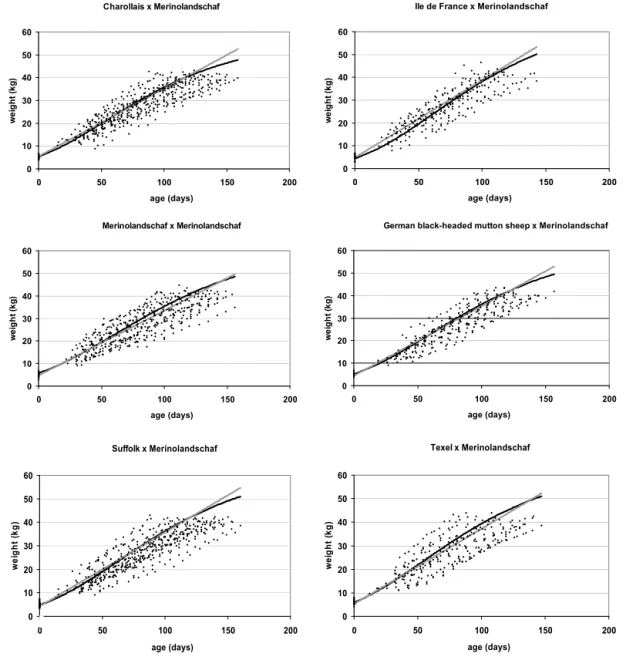
The good fit of the linear model in our study indicates that individuals used in the dataset were still in the phase of al-most linear growth. This is illustrated by the average growth curves fitted to the observed weights (Fig. 1). Observations of older animals are missing and hence the data are trun-cated. This has implications for the interpretation of the pa-rameters of the Gompertz model. The parameterAusually is interpreted as mature BW. Lambe et al. (2006) used also truncated data from lambs and interpreted the parameterA
as finishing weight at the end of fattening. LS means of the Gompertz model parameters are shown in Table 4. Mature BWs of purebred ML are reported to be higher (VDL, 2005) for ML than the estimate ofAfor ML (Table 4). Hence, pa-rameterAseems to underestimate true mature BW, probably due to the truncated data.
low-Charollais x Merinolandschaf
0 10 20 30 40 50 60
0 50 100 150 200
age (days)
we
ig
ht
(
kg
)
Ile de France x Merinolandschaf
0 10 20 30 40 50 60
0 50 100 150 200
age (days)
we
ig
ht
(
kg
)
Merinolandschaf x Merinolandschaf
0 10 20 30 40 50 60
0 50 100 150 200
age (days)
we
ig
ht
(
kg
)
German black-headed mutton sheep x Merinolandschaf
0 10 20 30 40 50 60
0 50 100 150 200
age (days)
we
ig
ht
(
kg
)
Suffolk x Merinolandschaf
0 10 20 30 40 50 60
0 50 100 150 200
age (days)
w
ei
ght
(
kg
)
Texel x Merinolandschaf
0 10 20 30 40 50 60
0 50 100 150 200
age (days)
w
ei
ght
(
kg
)
Figure 1.Estimated growth function for Gompertz (black) and linear model (grey) for different crossbred lambs and purebred Merinoland-schaf lambs; body weight (kg) plotted against age (days).
est estimate was found for ML. Hence, all crosses were supe-rior in maximum DG compared to ML (although not always significantly).
ParameterC, which is interpreted as the age at maximum DG, is the lowest for TX and CH (Table 4). This indicates that TX and especially CH reached the maximum DG at a younger age compared to the other crosses. This may cause some problems if this maximum DG takes place around weaning. First, because weaning as a stress factor might cause growth depression, sometimes called post-weaning de-pression (e.g. Peeters et al., 1995). Second, this early maxi-mum DG must be supported by the milk of the ewes. Re-duced milk yield of the ewes might result in a reRe-duced max-imum DG of the lambs. This is less problematic for lambs
that mainly grow later in life during the fattening period, i.e. showing a higherCvalue (SU and IF in our study, Table 4).
The parameter INT from the linear model underestimates the average birth weight for all crosses except CH (Tables 1 and 5 and Fig. 1). As expected, the estimated (parameterb, Table 5) and observed DG (Table 3) are in close agreement for all crosses.
Table 4.Effect of cross, sex and birth type on Gompertz parameters
A(estimated mature body weight),B(maximum daily gain) andC
(age at maximum daily gain) modelled for fattening lambs.
Cross/Sex/ A B C
Birth type LS mean SE LS mean SE LS mean SE
CH 57.4b 1.6 0.340cd 0.009 53.7a 2.9 IF 66.2a 2.6 0.387a 0.012 62.6ab 4.5 ML 62.8a 2.0 0.329d 0.009 61.2ab 3.5 SK 62.2a 2.0 0.349bcd 0.010 60.1ab 3.6 SU 64.2a 1.9 0.358abc 0.009 63.1b 3.4 TX 64.6a 2.2 0.374ab 0.011 55.4ab 3.8 Male 69.3a 1.8 0.391a 0.006 64.3a 2.7 Female 56.5b 0.9 0.322b 0.005 54.3b 1.6 Singleton 59.8a 1.2 0.370a 0.006 47.0a 2.1 Twin 66.0b 1.3 0.342b 0.006 71.6b 2.3
abcdWithin a column values and given the same aspect (cross, sex or birth type),
values with different superscript letters (a–d) differ significantly atP≤0.05.
Table 5.Effect of cross, sex and birth type on parameters INT and b of linear regression modelled for fattening lambs.
Cross/Sex/ INT b
Birth type LS mean SE LS mean SE CH 5.8c 0.2 0.296ab 0.007 IF 4.8abc 0.3 0.339d 0.009 ML 4.7ab 0.2 0.287a 0.006 SK 4.4a 0.3 0.309bc 0.008 SU 4.2a 0.3 0.315c 0.007 TX 5.2bc 0.3 0.318cd 0.008 Male 4.5a 0.2 0.337a 0.005 Female 5.2b 0.1 0.284b 0.004 Singleton 6.2a 0.2 0.327a 0.005 Twin 3.5b 0.2 0.294b 0.004
abcdWithin a column values and given the same aspect (cross, sex or birth type), values with different superscript letters (a–d) differ significantly atP≤0.05.
breed. As expected, significant differences between sexes and birth types were detected in this study. Mature BW (pa-rameterA, Table 4) shows differences between sexes, even though absolute values are underestimated as already dis-cussed above. Males are estimated to be significantly heavier. Estimations for DG (Bandb, Tables 4 and 5) were higher for males and singletons compared to females and twins. Female lambs are younger at maximum DG (parameterC, Table 5) than males.
In conlusion, IF and TX seem to be of greatest economic interest for intensive fattening because they showed the best FCR and eFCR. Only these crosses were significantly su-perior compared to purebred ML in FCR, eFCR and also in DGF. This underlines the advantage of one-way
cross-breeding for efficiently producing lamb meat.
Both growth models were well suited to model the data, but the fit of the Gompertz model was slightly better. In addi-tion, the use of the Gompertz model provided some interest-ing biological insights of the growth of lambs and differences between the crosses, even though the lambs were slaughtered before reaching mature BW.
Acknowledgements. The authors thank the team of the Oberer Lindenhof experimental station of the University of Hohenheim. The study was supported by the Ministerium für ländlichen Raum, Ernährung und Verbraucherschutz Baden-Württemberg (MLR) and the Marketing Gesellschaft Baden-Württemberg (MBW). K. F. Schiller was supported by the H. Wilhelm Schaumann Stiftung, Hamburg, Germany.
Edited by: A.-E. Freifrau von Tiele-Winckler Reviewed by: two anonymous referees
References
Analla, M., Montilla, J. M., and Serradilla, J. M.: Analyses of lamb weight and ewe litter size in various lines of Spanish Merino sheep, Small Rumin. Res., 29, 255–259, 1998.
Bildungs- und Wissenszentrum Aulendorf: [Test report no. 2 – 2005: Influence of father race on the fattening performance of lambs], Education and knowledge center Aulendorf, Livestock, vegetation management, wildlife, fisheries, Aulendorf, Germany, 2005 (in German).
Daskiran, I., Koncagul, S., and Bingol, M.: Growth Characteristics of Indigenous Norduz Female and Male Lambs, Tar Bil Der – J. Agric. Sci., 16, 62–69, 2010.
Doyle, E. K., Kahn, L. P., McClure, S. J., and Lea, J. M.: Volun-tary feed intake and diet selection of Merino sheep divergently selected for genetic difference in resistance toHaemonchus con-tortus, Vet. Parasitol., 177, 316–323, 2011.
Engelhart, T. and Eckl, R.: Test Station for sheep St. Johann – 30th Report on the Audit of the fattening performance and carcass value in sheep test year 2011/2012. Main and state stud Marbach, Marbach, Germany, 2012 (in German).
Fahmy, M. H., Boucher, J. M., Poste, L. M., Grégoire, R., Butler, G., and Comeau, J. E.: Feed efficiency, carcass characteristics, and sensory quality of lambs, with or without prolific ancestry, fed diets with different protein supplements, J. Anim. Sci., 70, 1365–1374, 1992.
Gbangboche, A. B., Glele-Kakai, R., Salifou, S., Albuquerque, L. G., and Leroy, P. L.: Comparison of non-linear growth models to describe the growth curve in West African Dwarf sheep, Animal, 2, 1003–1012, 2008.
Hassen, Y., Sölkner, J., Gizaw, S., and Baumung, R.: Performance of crossbred and indigenous sheep under village conditions in the cool highlands of central-northern Ethiopia: growth, birth and body weights, Small Rumin. Res., 43, 195–202, 2002.
Henseler, S., Preuss, S., and Bennewitz, J.: Meat Production with Merinolandschaf Crossbreeds – 2nd Communication: Sensory Analysis and Creation of a Joint Index for the Results, Züch-tungskunde, 86, 104–115, 2014b (in German).
Lambe, N. R., Navajas, E. A., Simm, G., and Bünger, L.: A ge-netic investigation of various growth models to describe growth of lambs of two contrasting breeds, J. Anim. Sci., 84, 2642–2654, 2006.
Peeters, R., Kox, G., and Van Isterdael, J.: Environmental and ge-netic influences on growth performance of lambs in different fat-tening systems, Small Rumin. Res., 18, 57–67, 1995.
Sambraus, H. H.: Sheep, in: Color atlas of livestock breeds, 7th ed., Stuttgart, Germany, 160–181, 2011 (in German).
Strittmatter, K.: Development, situation and perspectives of the sheep production in Germany, Züchtungskunde, 77, 496–501, 2005 (in German).
Topal, M., Ozdemir, M., Aksakal, V., Yildiz, N., and Dogru, U.: Determination of the best nonlinear function in order to estimate growth in Morkaraman and Awassi lambs, Small Rumin. Res., 55, 229–232, 2004.
VDL: VDL Race and breeding objective description Merino sheep, http://www.bundesverband-schafe.de/uploads/media/ Merinolandschaf_03.pdf (last access: September 2014), 2005 (in German).