REVISITING THE PROCEDURES FOR THE VECTOR DATA QUALITY ASSURANCE
IN PRACTICE
M. Erdoğan, *, A. Torun, D. Boyacı
General Command of Mapping, Photogrammetry Department, 06100 Dikimevi Ankara, Turkey, - (mustafa.erdogan,
abdulvahit.torun, dijle.baysal)@hgk.msb.gov.tr
Commission IV, WG IV/1
KEY WORDS: Mapping, Database, Feature, GIS, Quality, Vector
ABSTRACT:
Immense use of topographical data in spatial data visualization, business GIS (Geographic Information Systems) solutions and applications, mobile and location-based services forced the topo-data providers to create standard, up-to-date and complete data sets in a sustainable frame. Data quality has been studied and researched for more than two decades. There have been un-countable numbers of references on its semantics, its conceptual logical and representations and many applications on spatial databases and GIS. However, there is a gap between research and practice in the sense of spatial data quality which increases the costs and decreases the efficiency of data production. Spatial data quality is well-known by academia and industry but usually in different context. The research on spatial data quality stated several issues having practical use such as descriptive information, metadata, fulfillment of spatial relationships among data, integrity measures, geometric constraints etc. The industry and data producers realize them in three stages; pre-, co- and post data capturing. The pre-data capturing stage covers semantic modelling, data definition, cataloguing, modelling, data dictionary and schema creation processes. The co-data capturing stage covers general rules of spatial relationships, data and model specific rules such as topologic and model building relationships, geometric threshold, data extraction guidelines, object-object, object-belonging class, object-non-belonging class, class-class relationships to be taken into account during data capturing. And post-data capturing stage covers specified QC (quality check) benchmarks and checking compliance to general and specific rules. The vector data quality criteria are different from the views of producers and users. But these criteria are generally driven by the needs, expectations and feedbacks of the users. This paper presents a practical method which closes the gap between theory and practice. Development of spatial data quality concepts into developments and application requires existence of conceptual, logical and most importantly physical existence of data model, rules and knowledge of realization in a form of geo-spatial data. The applicable metrics and thresholds are determined on this concrete base. This study discusses application of geo-spatial data quality issues and QA (quality assurance) and QC procedures in the topographic data production. Firstly we introduce MGCP (Multinational Geospatial Co-production Program) data profile of NATO (North Atlantic Treaty Organization) DFDD (DGIWG Feature Data Dictionary), the requirements of data owner, the view of data producers for both data capturing and QC and finally QA to fulfil user needs. Then, our practical and new approach which divides the quality into three phases is introduced. Finally, implementation of our approach to accomplish metrics, measures and thresholds of quality definitions is discussed. In this paper, especially geometry and semantics quality and quality control procedures that can be performed by the producers are discussed. Some applicable best-practices that we experienced on techniques of quality control, defining regulations that define the objectives and data production procedures are given in the final remarks. These quality control procedures should include the visual checks over the source data, captured vector data and printouts, some automatic checks that can be performed by software and some semi-automatic checks by the interaction with quality control personnel. Finally, these quality control procedures should ensure the geometric, semantic, attribution and metadata quality of vector data.
* Corresponding author.
1. INTRODUCTION
Data quality has been studied and researched for years and it also depends on use. Since the use of geodata becomes wider, QC is increasingly getting more importance.
In geoscience, analytical information symbolizes one of the main categories maintained by geoinformation systems. The vector data is generally showed by lists of coordinates defining points, lines, polygons, etc. These primitives are traditionally used for describing geographic entities, for example buildings, rivers, vegetation or soil types. In GIS, vector data has important applications in the evaluation and management of
virtual landscapes. Therefore, techniques that allow visualization of terrain and geospatial vector data are required. Such techniques have to evolve the vector data of the terrain surface and should ensure a precise and efficient mapping. (Dai et al, 2008)
Many disciplines like environmental planning, documentation and analysis uses geodata and the quality of the geodata and description of that quality are very important subjects to get good results. Additionally a quality description in terms of geometric and thematic reliability and completeness is a must. For verifying the quality of geodata, it is required to make sure that a production process of geodata offers the desired quality.
Such a program has to cover a cycle of procedures for quality control that warranties to keep the specified quality. Each phase in quality control assessments defines one aspect of quality requirements for the underlying information model. Thus, quality management should be the initial phase in data processing, data analysis, maintenance or homogenization of different data sets to make sure a well-defined result in any of these processes. (Busch and Willrich, 2002)
Many studies are performed about the quality of geodata. In one of these studies, a framework to support quality driven large-scale geospatial data integration (QGM) was described by Thakkar et al (2007). The key contributions of their framework are: (1) the ability to automatically estimate quality of data provided by a source by using the information from a source of known quality, (2) declarative representation of both the content and the quality of geospatial data provided by sources, and (3) a quality-driven query answering technique for geospatial data. Their experimental evaluation using over 1200 real-world sources show that QGM not only provides better quality data compared to the traditional data integration systems, it also has lower response time.
Spatial data quality is well-known by academia and industry but usually in different context. The research on spatial data quality stated several issues having practical use such as descriptive information as metadata, fulfilment of spatial relationships among data, integrity measures, geometric constraints etc. The industry and data producers realize them in three stages; pre-, co- and post data capturing. The pre-data capturing stage covers semantic modelling, data definition, cataloguing, modelling, data dictionary and schema creation processes. The co-data capturing stage covers general rules of spatial relationships, data and model specific rules such as topology and model building relationships, geometric threshold, data extraction guidelines, object, object-belonging class, object-non-object-belonging class, class-class relationships to be taken into account during data capturing. And post-data capturing stage covers specified QC benchmarks and checking compliance to general and specific rules.
Vector data represents one major category of data managed by GIS. Based on geo-spatial data standards and integrity rules GIS vendors and data producers build QC and QA guidelines and apply them in production workflow. The vector data quality criteria are different from the views of producers and users. But these criteria are generally driven by the needs, expectations and feedbacks of the users.
This paper presents a practical method which closes the gap between theory and practice. Development of spatial data quality concepts into developments and application requires existence of conceptual, logical and most importantly physical existence of data model, rules and knowledge of realization in a form of geo-spatial data. The applicable metrics and thresholds are determined on this concrete base.
This study discusses application of geo-spatial data quality issues and QC procedures in the topographic data production. Firstly we introduce MGCP data profile of NATO DFDD, the requirements of data owner, view of data producers for both data capturing and QC and finally quality assurance to fulfil user needs. Then, our practical and new approach which divides the quality into three phases is introduced. Finally,
implementation of our approach to accomplish metrics, measures and thresholds of quality definitions is discussed. In this paper, especially geometry and semantics quality and quality control procedures that can be performed by the producers are discussed.
2. QUALITY ASSURANCE OF VECTOR DATA
2.1 What is Vector Data?
Vector data provide a way to characterize real world features within the GIS environment. A feature is anything you can see on the landscape. Think about you are at a high position on the field. When you look at down, you can see many features like forests, houses, roads, trees, rivers etc. Each of these things would be a feature when we characterize them in a GIS program. Vector features have attributes, which consist of text or numerical information that describe the features.
A vector feature has its shape represented using a special geometry. The geometry is made up of one or more interconnected vertices. A vertex describes a position in space using a x, y and optionally z axis. Geometries which have vertices with a z axis are often referred to as 2.5D since they describe height or depth at each vertex, but not both. When a feature's geometry consists of only a single vertex, it is referred to as a point feature. Where the geometry consists of two or more vertices and the first and last vertex are not equal, a polyline feature is formed. Where four or more vertices are present, and the last vertex is equal to the first, an enclosed polygon feature is formed. (www1, 2011)
2.2 Quality of Vector Data
The quality elements described in ISO (International Organization for Standardization) 19113 are completeness, logical consistency, positional accuracy, temporal accuracy, thematic accuracy. Also they can be defined as measures of quality such as closeness to the actual value, spatial accuracy of position, shape, size/area of features, “currentness” of data and completeness of attribute values. Another side of quality should be thought as absence of contradictions in the data and conformance of the data to rules.
Also there are other classifications made for the quality of vector data. In one of these classifications made by Subbiah et a. (2007), quality parameters are defined as accuracy, resolution, completeness, and types. Accuracy of geospatial data is defined in terms of tuple (attribute, value), where attribute refers to a geographic concept/object and the value is its measurement. It is assumed that geospatial service providers provide data that conform to such tuples and that there is an objective assessment of all concept values. Resolution refers to the amount of detail that can be determined in space, time or theme. Vector data can be represented in either fine or coarse density. Scale of maps can be thought as resolution. The coarser the data is, the less information is available about vector points of an object’s shape. Resolution is also related to accuracy because the level of resolution affects the database specification against which accuracy is assessed. Completeness refers to the absence of omissions in a provider database. Completeness is distinct from accuracy in that the errors that result in lack of completeness are not incorrect encoding of object values.
Instead, when a service provider fails to keep its database updated with latest data, it is considered to have incomplete data. Data types refer to the format of desired data. Even though the area of geospatial data interoperability has made a lot of progress, various reasons still exist that lead clients to request specific type of data format.
Nowadays term of “level” is used to define the resolution of vector data. VMap (vector-map) is a good example for this. VMap Level 0 corresponds to approximately 1:1.000.000 scale and Level 1 to 1:250.000. Especially globally produced vector data is labelled with levels. A good example to such kind of global production is MGCP. In that program level-2 data that corresponds to 1:100.000 or 1:50.000 scale is produced by different nations. The project represents the most current evolution of a 10-year, global VMap Level 1 effort that began in 1993 and was revamped in 2003. In such kind of projects, quality becomes more important, mainly to prevent the production of non-harmonized data between the participant countries.
Vector data needs a lot of work and maintenance to ensure that it is accurate and reliable. Inaccurate vector data can occur when the instruments used to capture the data are not properly set up, when the people capturing the data aren't being careful, when time or money don't allow for enough detail in the collection process, and so on. If you have poor quality vector data, you can often detect some of these quality lacks when viewing the data in a GIS. (www1, 2011)
The usefulness of the quality measures depends on the application. It is not always clear to decide on how many quality parameters can be introduced to describe the quality of data. The number of quality parameters can be very large because quality varies spatially and temporally. Defining the quality measures is already a very actual topic in the standardization process. (Ragia, 2000)
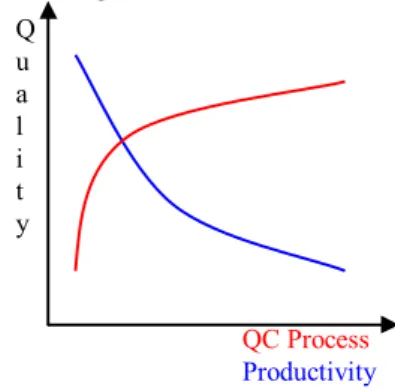
Level of the quality should be adjusted carefully. Quality and efficiency or productivity are conflicting or opposite aspects. If the quality of the product is selected very high, it increases the quality control period and decrease the productivity. The relation between these objects can be seen as in Figure 1. So the quality, time for quality control and productivity should be optimized according to the needs.
Figure 1. Quality vs QC Process and productivity relation
2.3 Quality Assurance of Vector Data
For rating the quality of geodata certain set of measures are needed, which give us expressive, comprehensive and useful criteria. A coarse subdivision of quality measures into two
categories can be done, which due to the following arguments are important for practical applications:
1. Quality measures that concern consistency with the data model,
2. Quality measures that concern consistency of data and reality within the scope of the model.
A complete check of the first category can be performed automatically within a database or GIS without any additional data. This inspection can be done exhaustively, i.e. the whole area covered by the data can be checked. On the other hand the comparison of data and reality is much more expensive. Performing it for the whole area requires much more effort. (Busch, 2002)
In this paper quality control procedures, which are used for MGCP production in General Command of Mapping, to accomplish the certain quality measures and the experiences from these procedures are discussed. Our quality control procedures consist of parameters specifying the following quality aspects: topology, geometry, completeness of features and attributes, logical consistency. To succeed these aspects some automatic, semi automatic or manual quality checks are used.
The data quality is assured in feature and feature-class levels. The error inspection procedure comprises consistency, completeness and correctness control categories. QA software is the main QC tool for consistency checking and topology. This software checks the topology errors, some geometry errors like connection, overlaps etc, attribution conformity and compatibility errors. Some of the found errors are corrected later automatically or manually but without checking the error. Some of the found errors should be checked over the data and other sources since they can be false positives, which means that they seem as errors but in fact they are not errors. The completeness of geometry and attributes is tried to be guaranteed based on four levels control approach.
At the first level, vector data is controlled over the source imagery and other ancillary sources. At this stage the captured data is controlled according to the technical prerequisites. A control stuff checks all captured data and looks at; 1) if the features on the topography captured as the correct features in feature and attribute dictionary, 2) if the correct attributes are assigned to the captured features, 3) if the feature captured with the correct geometry according to its size (point, line or area), 4) if the features corrected with the needed density, 5) if the features captured with the needed geometric location accuracy. In Figure 2, a dry river found in this control, that is not captured but should be captured according to the defined standards, is shown. This control takes approximately %5 to 10 of the production time of data capture and approximately %5 additional conditions of the captured data are detected. Q
u a l i t y
QC Process
Productivity
Figure 2. An uncaptured river
The second level is the control of vector data over the previously produced raster or vector maps. A control stuff checks all the captured data and looks at; 1) if there is a feature which exists on the old data but not in the newly produced data, 2) if the captured features are compatible in the old and new data, 3) if the assigned attributes are compatible according to the old data. Here the found error conditions can be not an error. These are only suspicious conditions that should be checked over the source and ancillary data which are used for data capturing. In Figure 3, a condition found is shown. In that condition, the extent of the captured river and the extent of the same river over the old topographic map are different and should be checked. This control takes approximately %5 of the production time of data capture and approximately %2 to 3 additional conditions for the captured data are detected. Approximately %50 of the conditions is real errors.
Figure 3. An uncaptured river part
At the third level the printouts of the vector data are taken with the appropriate scale and controlled according to the logical consistency. An experienced control stuff checks out the printouts for logical inconsistencies such as a wet river flowing through a dry river, a hard paved road connected to a loose unpaved cart track, a building over an empty area with no road connection to that house etc. The examples for this control can be extended. As the second level control, again the found error conditions can be not an error and should be checked over the source and ancillary data which are used for data capturing. In
Figure 4 such a condition is shown. Two hard paved roads are connected with a loose unpaved road. It can be a real situation or an error, but this is a suspicious condition should be checked. This control takes approximately %5 of the production time of data capture and approximately %2 to 3 additional conditions of the captured data are detected. Approximately %30 of the conditions is real errors. Generally by the use of computers for the vector data or map production, this kind of control over printouts are begun to be neglected. But the main importance of this control is the errors detected here are generally important and coarse errors that affect the overall quality of data. An operator who is capturing data on a small area can mix up a pipeline with road, but it can be easily detected over the printout by the very long and straight geometry and connection of pipeline. This kind of many important and coarse errors are detected and corrected as a result of this control.
Figure 4. Connected roads with different qualities
At the final level, geonames are controlled by using different sources such as USA (United States of America) NGA (National Geospatial-Intelligence Agency) Geonames Server, old topographic maps and plans, other gazetteers etc. A control stuff checks all the captured geonames over the printouts and digital data and looks at; 1) if the correct name is assigned, 2) if the extent of the name is given correctly. In Figure 5 extent of a river is signed with yellow that a single geoname should be assigned. After that yellow part, the name of the river changes. This control takes approximately %5 of the production time of data capture and approximately %5 additional conditions of the captured data are detected.
Figure 5. A geoname correction
3. CONCLUSIONS
Reliability of a GIS mainly depends upon its accuracy. The accuracy of such information can be achieved by two main approaches. In one approach the data is controlled and
corrected after it produced. And this process is repeated till the data reach a certain accuracy level. In the second approach, the data is tried to be produced with the best quality. To accomplish this preparation of the needed sources, training of the stuff etc. are performed before the capture of data. In this study, it is specified that by controlling the data with a period of %20-25 of its production time, %10 percent of increase in the quality is accomplished. Also %10-15 of production time is needed to check and correct the found conditions. So to find and correct the errors after the production is not an efficient way. But if the operator who is capturing the data is trained, prepared and supported with the needed materials, the more quality data is captured, the less control and correction time is performed. So QA efforts should concentrate on pre and co production procedures more than post production QC procedures.
Nowadays, by the use of computer technology for vector data production, generally automatic QC procedures are preferred and used and other QC procedures which needs human source are neglected. This situation causes the production of vector data which are at high quality at appearance but low quality in reality. The practical QA/QC procedures described in this paper shows that only automatic controls are not enough to guarantee the quality. Another subject is that conditions detected with the control over printouts are very useful for the detection of important and coarse errors and this kind of control should be a must for a consistent, accurate and high quality vector data.
3.1 References and/or Selected Bibliography
Busch, A., Willrich, F., 2002, Quality Management of ATKIS Data, OEEPE/ISPRS Joint Workshop on Spatial Data Quality Management, 21-22 March 2002, Istanbul.
Dai, C., Zhang, Y., Yang, J., 2008. Rendering 3D Vector Data Using the Theory of Stencil Shadow Volumes, The International Archives of the Photogrammetry, Remote Sensing
and Spatial Information Sciences. Vol. XXXVII. Part B2.
Beijing 2008.
Ragia, L., 2000, A Quality Model For Spatial Objects, ISPRS
Working Group IC WG IV/III.1,
http://citeseerx.ist.psu.edu/viewdoc/summary?doi=10.1.1.35.96 20 (12 Dec. 2011)
Subbiah, G., Alam, A., Khan L., Thuraisingham, B., 2007, Geospatial Data Qualities as Web Services Performance Metrics, 15th International Symposium on Advances in
Geographic Information Systems, ACM GIS 2007.
Thakkar, S., Knoblock, C.A., Ambite, J.L., 2007, Quality-Driven Geospatial Data Integration,15th International Symposium on Advances in Geographic Information Systems, ACM GIS 2007.
www1, 2011, GIS for Educators Topic 2: Vector Data,
http://elogeo.nottingham.ac.uk/xmlui/bitstream/handle/url/66/2
_VectorData.pdf?sequence=1 (12 Dec. 2011)