18
2017
DISCARDS FROM THE PORTUGUESE
BOTTOM OTTER TRAWL OPERATING IN
ICES DIVISION 27.9.a (2004-2015)
Ana Cláudia Fernandes, Nuno Prista e Manuela
Azevedo
RELATÓRIOS CIENTÍFICOS E TÉCNICOS DO IPMA – SÉRIE DIGITAL
Destinam-se a promover uma divulgação rápida de resultados de carácter científico e técnico,
resultantes da actividade de investigação e do desenvolvimento e inovação tecnológica nas áreas
de investigação do mar e da atmosfera. Esta publicação é aberta à comunidade científica e aos
utentes, podendo os trabalhos serem escritos em Português, Francês ou Inglês.
Edição
IPMA
Rua C – Aeroporto de Lisboa
1749-007 LISBOA
Portugal
Corpo Editorial
Francisco Ruano – Coordenador
Aida Campos
Irineu Batista
Lourdes Bogalho
Mário Mil-Homens
Rogélia Martins
Teresa Drago
Edição Digital
Anabela Farinha
As instruções aos autores estão disponíveis no sitio web do IPMA
http://ipma.pt
ou podem ser solicitadas aos membros do Corpo Editorial desta publicação
Capa
Conceição Almeida
ISSN
2183-2900
27.9.a (2004-2015)
Ana Cláudia Fernandes
1
; Nuno Prista
1,2
; Manuela Azevedo
1
1
Instituto
Português
do
Mar
e
da
Atmosfera,
IPMA
I.P.,
R.
Alfredo
Magalhães
Ramalho,
6
1495-006 Lisboa
, Portugal;
2Institute of Marine Research (SLU Aqua) Swedish University of Agricultural Sciences,
Turistgatan,5, 453 30 Lysekil,Sweden
Recebido em: 2017-11-08
Aceite em 2017-11-29
ABSTRACT
This document compiles the information available on discards from Portuguese vessels operating with
bottom otter trawl (OTB) in the Portuguese ICES Division 27.9.a, estimated by IPMA for the period
2004-2015. These discards include species from the stocks assessed in ICES assessment Working Groups and
species commercially important at national level. The samples were collected by the onboard sampling
programme of the National Programme for Biological Sampling (PNAB/EU DCF), integrated in the National
Data Collection Framework . The onboard sampling programme, estimation algorithms and data quality
assurance procedures are described and results for two fisheries provided: the crustacean bottom otter trawl
fishery (OTB_CRU) and the demersal bottom otter trawl fish fishery (OTB_DEF). Estimates of discard
volume and length composition are provided for the ‘year, fishery, species’ combinations where they are
frequently observed ( 30% of sampled hauls). Results show that although there’s a large number of species
discarded, the number of species frequently discarded is very low (~7% in OTB_CRU and ~4% in
OTB_DEF). Mean number of discards per haul is calculated for all species that occurred in discards and
analysis of length compositions are displayed for selected species. Analyses of the combined results indicates
that a large part of the species selected for this work are either absent in discards or very rarely discarded.
Indications are given on possible discarding reasons and on the discard estimation methodology to be
developed for less frequent species and for other Portuguese fleet components.
Key words: Species discards, bottom otter trawl, ICES Division 27.9.a
Título – Devoluções ao mar pela frota de arrasto Portuguesa a operar
na Divisão ICES 27.9.a
(2004-2015)
RESUMO
Este documento reúne informação sobre as devoluções ao mar efetuadas pela frota comercial Portuguesa a
operar com arrasto de fundo com portas (OTB) na Divisão ICES 27.9.a. As devoluções ao mar foram
estimadas pelo IPMA, para as populações de espécies que são avaliadas em grupos de trabalho de avaliação
do ICES e espécies comercialmente importantes a nível nacional. As amostras foram recolhidas pela
amostragem a bordo da frota comercial, no âmbito do Programa Nacional de Amostragem Biológica
(PNAB/EU DCF) entre 2004 e 2015. O plano de amostragem a bordo, os algoritmos de estimação e os
procedimentos de verificação da qualidade dos dados são descritos e apresentados os resultados obtidos para
as duas frotas de arrasto comercial: pescaria de arrasto de fundo dirigida a crustáceos (OTB_CRU) e pescaria
de arrasto de fundo dirigida a espécies demersais (OTB_DEF). As estimativas do volume de devoluções ao
mar e de distribuições de comprimentos são estimadas para a combinação ano x pescaria x espécies onde elas
são frequentemente observadas ( 30% nos lances amostrados). Os resultados apresentados mostram que,
apesar de existir um elevado número de espécies devolvidas ao mar, o número de espécies frequentemente
presente naquela fração da captura é muito baixo (~7% em OTB_CRU e ~4% em OTB_DEF). O número
médio de devoluções ao mar por lance é calculado para todas as espécies que foram devolvidas ao mar e a
análise das distribuições de comprimentos é apresentada. A análise dos resultados indica que grande parte
das espécies selecionadas para este estudo, ou não está presente nas devoluções ao mar ou poucas vezes se
encontram naquela fração da captura. Por fim, são dadas indicações sobre algumas das razões possíveis para
as devoluções ao mar, assim como sobre a metodologia a desenvolver para a sua estimativa nas espécies
menos frequentes e de outras componentes de frota da pesca nacional.
Palavras-chave: Devoluções de espécies ao mar, arrasto de fundo com portas, Divisão ICES 27.9.a
________________________________________________________________________________
BIBLIOGRAPHIC REFERENCE:
Fernandes, A. C.; Prista N.; Azevedo. M. (2017).
Discards from the
Portuguese bottom otter trawl operating in ICES Division 27.9.a (2004-2015).
Relat.Cient.Tec. do IPMA
1. Introduction
The objective of the onboard sampling programme is to estimate the composition, volume, lengths
and age of catches (landings + discards) taken by the Portuguese bottom otter trawl fleet (OTB)
operating in the Portuguese ICES Division 27.9.a. This fleet is generally engaged in
mixed-fisheries, where a variety of species contribute to the output of the fishery. These species differ in
habitat requirements and in their seasonal migration pattern, hence the species composition of
catches will vary in space and time (Poos
et al.
, 2010). Consequently, also discard patterns can be
highly variable due to changing economic, environmental and social factors (Catchpole
et al.
,
2005). Knowledge on the retained and discarded catch compositions of a fishery and how these vary
spatially, temporally and among different fishing operations is then necessary for identifying the
potential impacts of fishing on stocks assessment and ecosystems (Gray
et al.
, 2005).
The present work compiles the information on discards of near 100 taxa (species and groups)
caught by the Portuguese bottom otter trawl fleets. Most of the information has been reported to
ICES Working Groups (see Annex I for WG acronyms and Annex II, Table 1 for species and
groups). The data presented in this work was collected by the onboard sampling programme within
National Programme for Biological Sampling (PNAB/EU DCF - CR (EC) 199/2008; CD
2010/93/EU) between 2004 and 2015. The document starts with a description of the onboard
sampling programme and sampling design. Then some details of the estimation algorithms and data
quality assurance procedures are presented together with results on the annual frequency of
occurrence in discards, number of specimens discarded at haul level, and length composition of
individuals sampled in discards for the different taxa. Fishery-level estimates of discard volume and
length composition are presented for the combinations (‘year, fishery, species’) where discards were
frequently observed. For less frequent species summary tables of the information collected are
provided that include both annual discards per haul in number and a statistical summary of total
sampled lengths.
2. Onboard sampling programme
operates cod-end mesh size 65-69 mm and
≥
70 mm and targets horse-mackerel, cephalopods and
other finfish (OTB_DEF). The near totality of vessels operates on only one of the fisheries (either
the crustacean or the demersal fish fishery) throughout time as they require different technical
setups on the vessels. A detailed account of the characteristics in these fisheries can be found in
Castro
et al.
(2007).
2.1 Sampling Design
A brief description of the sampling design follows:
Population:
Lengths of fish captured by the Portuguese bottom otter trawlers operating in ICES
Division 27.9.a.
Target population:
Lengths of fish captured by the Portuguese bottom trawlers >12 m length
overall that operate in ICES Division 27.9.a.
Study population:
Lengths of fish captured by Portuguese vessels (>18 m) that operate in ICES
Division 27.9.a (within species), for each fishery.
Sampling frame:
List of cooperative vessels for each fleet segment/métier. Stratification type:
Spatial
–
ports (Northwest, Southwest and South); Temporal
–
quarters.
Sampling effort:
The number of trips to sample OTB_CRU and OTB_DEF was obtained from an
initial Neyman allocation which was considered valid for the entire DCF period (OTB_CRU: 12
trips and OTB_DEF: 27 trips). Within each fishery, sampling effort distribution in space and time is
proportional to effort and landings.
Primary/Secondary Sampling Unit (PSU/SSU):
Vessel/Trip.
2.2 Description
2.2.1 Trip Selection
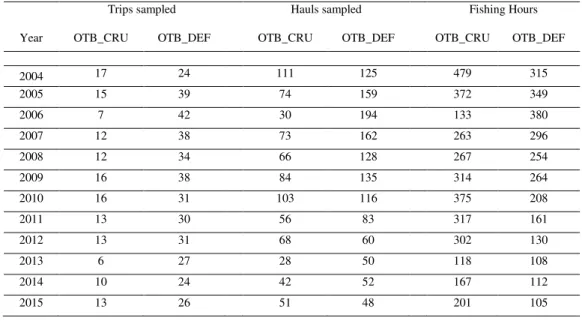
Table 1
- Sampling levels of the Portuguese onboard sampling programme in the two OTB
fisheries in ICES Division 27.9.a (2004-
2015). “OTB_CRU” = crustacean fishery, “OTB_DEF”
= demersal fish fishery.
Trips sampled
Hauls sampled
Fishing Hours
Year
OTB_CRU
OTB_DEF
OTB_CRU
OTB_DEF
OTB_CRU
OTB_DEF
2004
17
24
111
125
479
315
2005
15
39
74
159
372
349
2006
7
42
30
194
133
380
2007
12
38
73
162
263
296
2008
12
34
66
128
267
254
2009
16
38
84
135
314
264
2010
16
31
103
116
375
208
2011
13
30
56
83
317
161
2012
13
31
68
60
302
130
2013
6
27
28
50
118
108
2014
10
24
42
52
167
112
2015
13
26
51
48
201
105
2.2.2 Catch sampling
The sampling protocol used in Portuguese onboard sampling of the OTB fleet is detailed in Jardim
et al.
(2011) and Prista
et al.
(2011). For both fisheries (OTB_CRU and OTB_DEF), two observers
are deployed per fishing trip. Until 2010 instructions were given to observers to sample as many
hauls as possible in the trip. Since 2011, haul selection was made systematically (either odd or even
hauls are sampled after a random start). On each selected haul observers take a sample from the
catch, sort the specimens into landed/retained
1
and discarded fraction according to crew’s criteria
and register the weight and length composition. Concurrently, observers also collect auxiliary
fishery-related information such as effort (e.g., fishing hours), geographic and environmental data
(e.g., GPS coordinates, depth, bottom type). From 2004 to 2010 the onboard sampling protocols
have suffered only minor changes and adaptations. In 2011 the size of catch samples was doubled
(from 1 to 2 boxes of catch) and the within-
trip selection of hauls was standardized to “at least,
every other haul”.
3. Data archiving & Quality assurance procedure
Data involved in the calculation of discard estimates from Portuguese waters comes from an IPMA
database (onboard sampling data) and from the Directorate General for Natural Resources, Safety
and Maritime
Services, DGRM (logbook, sales and VMS data). The IPMA onboard database is
programmed in Oracle and contains internal routines for the detection of basic errors (e.g., errors in
dates). In what concerns the OTB fleet, the database contains general trip information (vessel
information, date, location, haul number, retained weight by species), along with sample information by
1
fraction (retained, discarded) and species, namely weight, number of specimens and length
composition. Quality checks involving the manual checking of (at least) 10% of annual trawl records
have been routinely carried out since the beginning of the onboard sampling programme. In 2010-2011
a semi-automated R quality assurance procedure was designed and the 2004-2011 trawl data base was
checked for so far undetected errors, subsequently corrected. Since then, routine quality assurance
procedures include: quarterly checks using the semi-automated R routine and an annual check of 10%
of the trawl records that detects observer-related biases, with only minor updates and data reviews being
performed in the previous data. Fishing effort and commercial data (logbooks and landings statistics) is
supplied to IPMA by DGRM on an annual basis. The 2004-2011 logbook data was based on paper
logbooks and displayed increasing fleet coverage over time. However, in 2012, DGRM discontinued
most of its logging of paper logbooks since these have been progressively replaced by electronic
logbooks. Quality checks are also performed to the logbook information in what concerns to
consistency and coherence (e.g. fishing days, number of hauls) according to the obtained knowledge on
fishing patterns from vessels in each fishery.
3.1 Note on species identification
The Portuguese onboard observers are trained in using the FAO 3-alpha code list (ASFIS List of
Species for Fishery Statistics Purposes: available at http://www.fao.org/fishery/collection/asfis/en,
date: February 2017) to identify species and species groups during field observations. General
training in species identification is provided to observers during demersal surveys, market
sampling and on dedicated workshops. When onboard a commercial fishing trip, observers are
requested to record fish data at the most appropriate taxonomic level based on the specimen's
conservation status, on field logistics (e.g. confined space, lack of time), and their own
identification expertise. The practice shows that Portuguese onboard observers are quite accurate
in the identification of species assessed by ICES. The FAO 3-alpha codes, scientific and common
names of species covered by this working document are near 100 species/groups and are described
in Table 1 (Annex II).
4. Data analysis
The procedures used to raise discard data from samples to haul and fleet level, considering each
fishery have been previously described in Jardim and Fernandes (2013) and Fernandes
et al.
(2010) following presentations and discussions in dedicated ICES Working Groups (e.g. SGPIDS,
WKPICS, WKDRP). A brief account follows.
4.1 Estimates of discards (haul level)
Where
is the weight of discards in the sample,
is the weight landed in the sample and
is the total weight of landings in the haul. The volume of discards of individual species in
each haul (
) is calculated:
Where
is the weight of the discards of species
in the sample,
is the weight of the
sample and C is the total volume of the catch in the haul.
4.2 Estimates of discards (fleet level)
The procedure generally used to raise discards from haul to fleet level in the Portuguese trawl
fisheries is presented in Annex III. This procedure relies on haul level discard data (discards per
hour) and effort data (fishing hours and fishing trips) derived from logbooks, sales slips and, for
2012-2015 periods, VMS (Vessel Monitoring System) data was also used. The procedure was
developed for hake that is a very frequent catch of the Portuguese OTB fisheries (Jardim and
Fernandes, 2013). To accurately estimate the discard volume of species with low abundance and
low frequency of occurrence in the sampled hauls, a large number of non-zero observations are
required. The current fleet-level discard estimation algorithm is considered sensitive to large
number of zeros in the data set (Jardim
et al.,
2011) and discard estimates are deemed not reliable
when the frequency of occurrence of species is below 30%. Consequently, annual discard volumes
are only routinely obtained for species discarded in
≥
30% of sampled hauls. The length structure
of discards at fleet level is estimated using the same raising methodology as Jardim and Fernandes
(2013) but applied to the number of discarded specimens per length class.
4.3 Number of discarded specimens
per species at haul level
The number of individuals discarded per species (
) is estimated using the same procedure as
discard volume.
Where
is the number of individuals of species
in the discards fraction of the sample,
is
the weight of the sample and C is the total volume of the catch in the haul. Mean number of
specimens discarded per species and haul, including those less frequent, were calculated. For each
4.4 Length frequency of discards
The length composition of species discarded in each fishery (OTB_CRU and OTB_DEF) was
estimated fo
r the ‘year, species’ combinations where total discards were calculated (
see Section
4.2 and in Annex III). Concerning the less frequent species, the sample information of each fishery
was compiled and the number of specimens measured, mean length, precision and range of lengths
observed for all period (2004-2015) is given.
5. Species discards
5.1 Frequency of species occurrence
Only a small part of the species routinely reported to ICES assessment are frequently discarded (
≥
30%); most of them are completely absent in sampled hauls for both fisheries (Figure 1).
Complete information on the frequency of occurrence of species (taxa) in sampled hauls from
OTB_CRU and OTB_DEF fisheries is displayed in Tables 2, 3, 4 and 5 (Annex IV)
5.2 Total discards
5.2.1
Discard volume
The fleet level discards for
species in specific ‘year, fishery’ combination
is presented in Tables
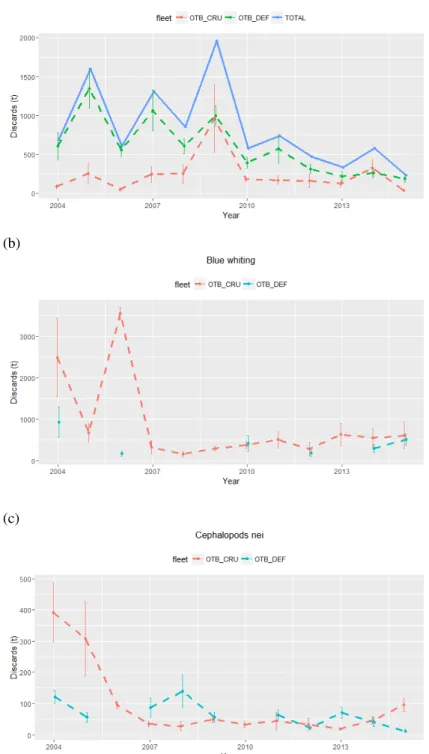
6, 7, 8 and 9 (Annex IV). Hake
was the only species frequently discarded in all ‘year, fishery’
combinations and where full record of total volume of discards could be obtained. Discard
fluctuated in an increasing mode until 2009 where the highest values were observed, showing a
decreasing trend onwards (Figure 2(a)). The OTB_DEF fleet was the fleet responsible for most of
the discarding of this species. Blue whiting and Cephalopods nei were also discarded in all years
in OTB_CRU fishery. Figure 2 shows lower discards of blue whiting since 2006 and a decreasing
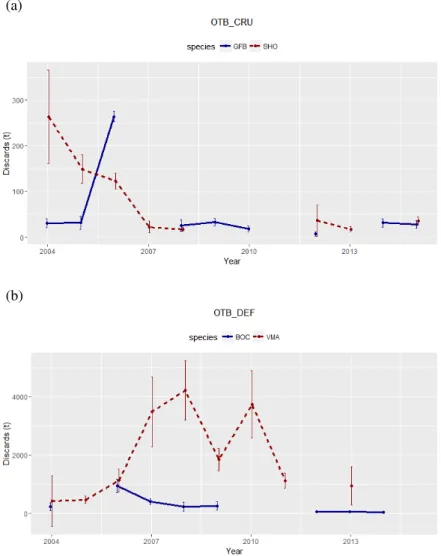
trend for the cephalopods nei in the beginning of the time series. Species discarded in more than 8
years of the 11 years sampling period in each fishery were greater forkbeard and blackmouth
catshark in OTB_CRU, and boarfish and chub mackerel in OTB_DEF (Figure 3). Discards of
blackmouth catshark decreased from 2004 to 2007, remaining low (less than 100 t) in the period
2012-2013. The analysis suggests low discards of greater forkbeard (less than 50 t) with the
exception of 2006, with discards around 250 t (Figure 3). Discards of chub mackerel were below
1000 t in the period 2004-2006 and increased to 2000-4000 t between 2007 and 2010. In most
recent years, discards have decreased. In fact, discards were estimated at 1000 t in 2013 while
discard frequency of this species was very low (< 30% occurrence) in 2012 and 2014-2015.
Boarfish discards were estimated for 2004, 2006-2009 and 2012-2014, showing values mostly
below 250 t.
5.2.2
Numbers of discarded specimens per species at haul level
Summary tables containing information of mean numbers discarded per h
aul in each ‘year,
fishery’ combination are presented in Table 10 and Table 11 (Annex IV) for OTB_CRU fishery
and OTB_DEF fishery, respectively. Tables combine information for both frequent and less
frequent species in sampled hauls. They also show that the number of individuals of the less
frequent species is lower than 10 per haul. A minor part of them present higher haul-level
estimates indicating larger discards at haul level but their frequency of discarding in sampled hauls
only rarely achieved 30% making the current total discard estimation algorithm unreliable for
(a)
(b)
(c)
(a)
(b)
Figure 3
–
Discards (total +/- SD) of greater forkbeard (GFB), blackmouth catshark (SHO),
boarfish (BOC) and chub mackerel (VMA) in each fishery: OTB_CRU - crustaceans (a);
OTB_DEF - demersal (b).
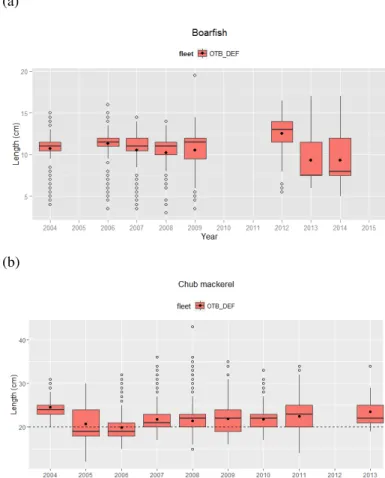
5.3 Length frequency of discards
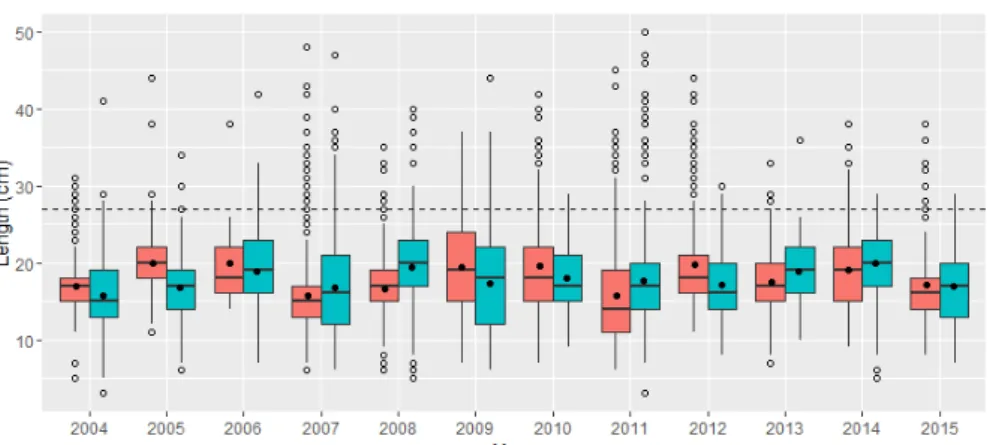
Figure 4
–
Annual variation of the discarded lengths for hake by fishery (OTB_CRU:
crustaceans; OTB_DEF: demersal). Black points within boxes are the mean value and
the horizontal dashed line represents the MLS for hake (27 cm); open circles:
observations with values differing 1 SD from the mean.
(a)
(b)
(c)
(a)
(b)
Figure 6
–
Annual variation of the discarded lengths for boarfish (a) and chub mackerel (b) in
OTB_DEF: demersal. Dot point shows the mean and open circles the observations with values
differing 1 SD from the mean; the horizontal dashed line represents the MLS for chub
mackerel (20 cm).
6. Final Remarks
fisheries are considered reliable. Hake discards are mainly composed of small size fish and these
are dumped dead overboard due to regulatory reasons, namely MLS, despite having considerable
commercial value at local markets. Discards estimates for other frequent species are more
fishery-specific. Analyses of discards length distribution are very important to understand the fisheries
behavior and the different fishing patterns in terms of species discarded. The main reasons for
discards of a number of species by the otter trawl fleet are discussed in Fernandes
et al
(2015) for
the ICES Division 27.9.a where market forces and regulatory reasons (TACs, by-catch limits,
MLS) were considered the main factors. Concerning discards in general, we emphasize that
conclusions on the importance of discards reported for specific fisheries should always be assessed
relative to a) quantitative estimates on the fisheries impacts on the sustainability of the stocks and
b) quantitative discard estimates obtained from other fleets and countries exploiting the same
stocks.
A discard estimation methodology for bottom trawl fleet, considering clusters of fishing trips
based on spatio-temporal exploitation patterns, is currently being developed aimed to improve the
precision and accuracy of the estimates of commonly discarded species (Fernandes
et al.
, in prep).
Also, IPMA I.P. intends to develop a discard estimation methodology that allows reliable
estimates for the less frequent ones, exploring statistical analyses for rare events.
Moreover, procedures to extend discard estimation to the multi-gear fleet components (longline,
gill and trammel nets, purse seine) are being developed. For this to be concluded, fleet effort
information will be of major importance because fishing trip is a too coarse unit to describe the
complex fishing effort of these fleet components, and appropriate and reliable effort units like gear
dimension and soaking time, number of hooks, number of pots and traps or proxies are then
necessary. For such reasons, only preliminary haul-level data on these fleets has so far been
submitted to ICES Assessment Groups (e.g. Prista
et al
, 2014a; Prista
et al
, 2014b).
7. Acknowledgements
We would like to thank skippers from cooperative vessels who collaborated with onboard
sampling programmes, the observers that collected the data to accomplish this work, and DGRM
for providing logbooks, sales and VMS data. Three reviewers provided useful comments to an
earlier version of the manuscript.
8. References
Azevedo, M., C. Silva, J.H. Vølstad, N. Prista, R. Alpoim, T. Moura, I. Figueiredo, M. Dias, A.C.
Fernandes, P. Lino, M. Felício, C. Chaves, E. Soares, S. Dores, P. Gonçalves, A.M. Costa, C.
Nunes. 2014. Workshop on sampling design and optimization.
Relat. Cient. Téc. do IPMA
, nº2,
79p.
Castro, J., E. Abad, I. Artetxe, F. Cardador, R. Duarte, D. Garcia, C. Hernandez, M. Marin, A.
Murta, A. Punzon, I. Quincoces, M. Santurtun, C. Silva, L. Silva. 2007. Identification and
segmentation of mixed-species fisheries operating in the Atlantic Iberian Peninsula waters
(IBERMIX project). Final report. Contract ref.: FISH/2004/03-33. 220 pp.
Catchpole T.L., C.L.J. Frid, T.S. Gray. 2005. Discarding in the English north-east coast Nephrops
norvegicus fishery: the role of social and environmental factors. Fisheries Research, 72: 45
–
54.
Council Regulation (EC) No 199/2008 of 25 February 2008
concerning the establishment of a
Community framework for the collection, management and use of data in the fisheries sector and
support for scientific advice regarding the Common Fisheries Policy
Commission Implementing Decision (EU) 2016/1251 of 12 July 2016
adopting a multiannual
Union programme for the collection, management and use of data in the fisheries and
aquaculture sectors for the period 2017-2019.
DOCAPESCA Portos e Lotas, S.A.. 2012. Campanha de Promoção da Cavala, 2ª Fase
–
2013, 2p
DOCAPESCA Portos e Lotas, S.A.. 2016. Campanha de Cavala e Carapau
–
o melhor do nosso
mar. Boletim de Informação Mensal, Janeiro 2016. 2 p.
Fernandes, A.C., N. Pérez, N. Prista, J. Santos, M. Azevedo. 2015. Discards composition from
Iberian trawl fleets. Marine Policy, 53 (33-44).
http://dx.doi.org/10.1016/j.marpol.2014.10.012
Fernandes, A. C., E. Jardim, G. Pestana. 2010. Discards raising procedures for Portuguese trawl
fleet
–
revision of methodologies applied in previous years. Working document presented at
Benchmark Workshop on Roundfish (WKROUND), 9
–
16 February 2010, ICES Headquarters,
Copenhagen, Denmark. ICES CM 2010/ACOM:36, 183 pp.
Gray C.A., D.D. Johnson, M.K. Broadhurst, D.J. Young. 2005. Seasonal, spatial and gear-related
influences on relationships between retained and discarded catches in a multi-species gillnet
fishery. Fisheries Research, 75: 56
–
72.
ICES. 2007. Report of the Workshop on Discard Raising Procedures (WKDRP), 6
–
9 February
2007, San Sebastian, Spain. ICES CM 2007ACFM:06. 57 pp.
ICES. 2012. Report of the Working Group on Practical Implementation of Statistical Sound Catch
Sampling Programs (WKPICS), 8 -10 November 2011, Bilbao, Spain. ICES CM 2011 /
ACOM:52. 55pp.
ICES. 2013. Report of the Study Group on Practical Implementation of Discard Sam-pling Plans
(SGPIDS), 24 June
–
28 June 2013, Lysekil, Sweden. ICES CM 2013/ACOM:56. 142pp.
ICES. 2013. Report of the second Workshop on Practical Implementation of Statistical Sound
Catch Sampling Programmes (WKPICS2), 6-9 November 2012, ICES Copenhagen. ICES CM
2012 / COM:54 71pp.
ICES. 2014. Report of the third Workshop on Practical Implementation of Statistical Sound Catch
Sampling Programmes (WKPICS3), 19-22 November 2013, ICES HQ, Copenhagen, Denmark.
ICES M2013/ACOM: 54. 109 pp.
Jardim, E., R. Alpoim, C. Silva, A.C. Fernandes, C. Chaves, M. Dias, N. Prista, A.M. Costa. 2011.
Portuguese data provided to WGHMM for stock assessment in 2011. Working Document
presented at the ICES Working Group on the Assessment of Southern Shelf Stocks of Hake, Monk
and Megrim (WGHMM), 5-11 May 2011, ICES Headquarters, Copenhagen, Denmark. ICES CM
2011/ACOM: 11, 625 pp.
Jardim, E., A.C. Fernandes. 2013. Estimators of discards using fishing effort as auxiliary
information with an application to Iberian hake (
Merluccius merluccius
) exploited by the
Portuguese trawl fleets. Fisheries Research 140: 105-113.
Poos J.J., J.A. Bogaards, D.M. Quirijns, D.M. Gillis, A.D. Rijnsdorp. 2010. Individual quotas,
fishing effort allocation, and over-quota discarding in mixed fisheries. ICES Journal of Marine
Science, 67: 323
–
33.
Practical Implementation of Discard Sampling Plans (SGPIDS), 27 June
–
1 July 2011, ICES
Headquarters, Copenhagen, Denmark. ICES CM 2011/ACOM: 50, 116 pp.
Prista, N., C. Silva., M. Azevedo, A.C. Fernandes. 2013. Going Back in Time
–
Reconstructing
Discard Time Series from a Portuguese Fishery. ICES CM 2013/J:13. Reykjavík, 23-28
September 2013.
Prista, N., A.C. Fernandes, C. Maia, T. Moura, I. Figueiredo. 2014a. Discards of elasmobranchs in
the Portuguese fisheries operating in ICES Division IXa: Bottom otter trawl, deep-water set
longlines, set gillnet and trammel net fisheries (2004-2013). Working Document for the ICES
Working Group on Elasmobranch Fishes (WGEF 2014), Lisbon, Portugal, 17-26 June. 23pp.
Annex I
List of the acronyms
TAC: Total Allowable Catch
MLS: Minimum Landing Size
VMS: Vessel Monitoring System
ICES WG: ICES Assessment Working Groups
WGDEEP: Working Group on the Biology and Assessment of Deep-Sea Fisheries Resources
WGBIE: Working Group for the Bay of Biscay and the Iberic Waters Ecoregion
WGCEPH: Working Group on Cephalopod Fisheries and Life History
WGEF: Working Group on Elasmobranch Fishes
WGHANSA: Working Group on Southern Horse Mackerel, Anchovy and Sardine
WGWIDE: Working Group on Widely Distributed Stocks
WGNEW: Working Group on Assessment of New MoU Species (created for 2012)
WKDRP: ICES Workshop on Discard Raising Procedure (2007)
SGPIDS: Study Group Practical Implementation of Discard Sampling Plans
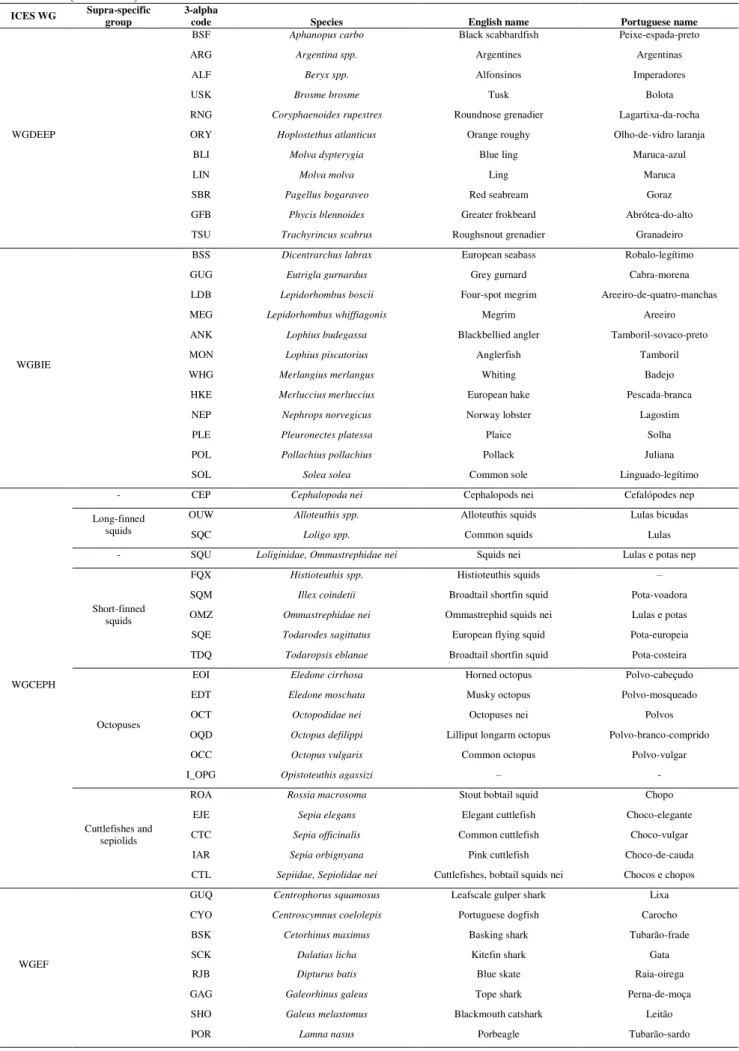
Annex II
Table 1
- Species codes and common names presented in each ICES Working Group (ICES WG) and other species assessed at
national level
(‘OTHER’)
.
ICES WG Supra-specific group
3-alpha
code Species English name Portuguese name
WGDEEP
BSF Aphanopus carbo Black scabbardfish Peixe-espada-preto
ARG Argentina spp. Argentines Argentinas
ALF Beryx spp. Alfonsinos Imperadores
USK Brosme brosme Tusk Bolota
RNG Coryphaenoides rupestres Roundnose grenadier Lagartixa-da-rocha
ORY Hoplostethus atlanticus Orange roughy Olho-de-vidro laranja
BLI Molva dypterygia Blue ling Maruca-azul
LIN Molva molva Ling Maruca
SBR Pagellus bogaraveo Red seabream Goraz
GFB Phycis blennoides Greater frokbeard Abrótea-do-alto
TSU Trachyrincus scabrus Roughsnout grenadier Granadeiro
WGBIE
BSS Dicentrarchus labrax European seabass Robalo-legítimo
GUG Eutrigla gurnardus Grey gurnard Cabra-morena
LDB Lepidorhombus boscii Four-spot megrim Areeiro-de-quatro-manchas
MEG Lepidorhombus whiffiagonis Megrim Areeiro
ANK Lophius budegassa Blackbellied angler Tamboril-sovaco-preto
MON Lophius piscatorius Anglerfish Tamboril
WHG Merlangius merlangus Whiting Badejo
HKE Merluccius merluccius European hake Pescada-branca
NEP Nephrops norvegicus Norway lobster Lagostim
PLE Pleuronectes platessa Plaice Solha
POL Pollachius pollachius Pollack Juliana
SOL Solea solea Common sole Linguado-legítimo
WGCEPH
- CEP Cephalopoda nei Cephalopods nei Cefalópodes nep
Long-finned squids
OUW Alloteuthis spp. Alloteuthis squids Lulas bicudas
SQC Loligo spp. Common squids Lulas
- SQU Loliginidae, Ommastrephidae nei Squids nei Lulas e potas nep
Short-finned squids
FQX Histioteuthis spp. Histioteuthis squids –
SQM Illex coindetii Broadtail shortfin squid Pota-voadora
OMZ Ommastrephidae nei Ommastrephid squids nei Lulas e potas
SQE Todarodes sagittatus European flying squid Pota-europeia
TDQ Todaropsis eblanae Broadtail shortfin squid Pota-costeira
Octopuses
EOI Eledone cirrhosa Horned octopus Polvo-cabeçudo
EDT Eledone moschata Musky octopus Polvo-mosqueado
OCT Octopodidae nei Octopuses nei Polvos
OQD Octopus defilippi Lilliput longarm octopus Polvo-branco-comprido
OCC Octopus vulgaris Common octopus Polvo-vulgar
I_OPG Opistoteuthis agassizi – -
Cuttlefishes and sepiolids
ROA Rossia macrosoma Stout bobtail squid Chopo
EJE Sepia elegans Elegant cuttlefish Choco-elegante
CTC Sepia officinalis Common cuttlefish Choco-vulgar
IAR Sepia orbignyana Pink cuttlefish Choco-de-cauda
CTL Sepiidae, Sepiolidae nei Cuttlefishes, bobtail squids nei Chocos e chopos
WGEF
GUQ Centrophorus squamosus Leafscale gulper shark Lixa
CYO Centroscymnus coelolepis Portuguese dogfish Carocho
BSK Cetorhinus maximus Basking shark Tubarão-frade
SCK Dalatias licha Kitefin shark Gata
RJB Dipturus batis Blue skate Raia-oirega
GAG Galeorhinus galeus Tope shark Perna-de-moça
SHO Galeus melastomus Blackmouth catshark Leitão
Table 1 (cont.)
WGEF (cont.)
RJN Leucoraja naevus Cuckoo ray Raia-de-dois-olhos
SDS Mustelus asterias Starry smoothound –
SMD Mustelus mustelus Smooth-hound Cação-liso
RJH Raja brachyura Blonde ray Raia-pontuada
RJC Raja clavata Cuckoo ray Raia-lenga
RJM Raja montagui Spotted ray Raia-manchada
RJU Raja undulata Undulate ray Raia-curva
RJA Rostroraja alba White skate Raia-tairoga
SYC Scyliorhinus canicula Small-spotted catshark Pata-roxa
DGS Squalus acanthias Picked dogfish Galhudo-malhado
DGZ Squalus spp. Dogfishes nei Esqualídeos
AGN Squatina squatina Angel shark –
RAJ (Rajidae nei)
RJY Raja fyllae Round ray –
RJO Dipturus oxyrhinchus Longnosed skate Raia-bicuda
RJI Leucoraja circularis Sandy ray Raia-de-São-Pedro
RJE Raja microocellata Small-eyed ray Raia-zimbreira
JAI Raja miraletus Brown ray Raia-de-quatro-olhos
SKA Raja spp. Raja rays nei Raias
SRX (Rajiformes nei)
MYL Myliobatis aquila Common eagle ray Ratão-águia
PLS Pteroplatytrygon violacea Pelagic stingray Uge-violácea
TTR Torpedo marmorata Marbled electric ray Tremelga-marmoreada
TTO Torpedo nobiliana Electric ray Tremelga-negra
TOE Torpedo spp. Torpedo rays Tremelgas
TTV Torpedo torpedo Common torpedo Tremelga-de-olhos
I_PWS (Pelagic sharks nei)
SMA Isurus oxyrinchus Shortfin mako Tubarão-anequim
BSH Prionace glauca Blue shark Tintureira
DWS (Deep-water sharks nei)
DWS – Deep-water sharks nei Tubarões de profundidade
GUP Centrophorus granulosus Gulper shark Barroso
CYP Centroscymnus crepidater Longnose velvet dogfish Sapata-preta
CYY Centroscymnus cryptacanthus Shortnose velvet dogfish Xara-preta-de-natura
HXC Chlamydoselachus anguineus Frilled shark –
DCA Deania calcea Birdbeak dogfish Sapata-branca
SDU Deania profundorum Arrowhead dogfish Sapata-flecha
SHL Etmopterus spp. Lantern sharks nei Lixinhas-da-fundura
SYR Scymnodon ringens Knifetooth dogfish Arreganhada
WGHANSA
ANE Engraulis encrasicolus Anchovy Biqueirão
HOM Trachurus trachurus Horse mackerel Carapau-branco
PIL Sardina pilchardus Sardine Sardinha
WGWIDE
BOC Capros aper Boarfish Mini-saia
HER Clupea harengus Atlantic herring Arenque
MAC Scomber scombrus Atlantic mackerel Sarda
WHB Micromesistius poutassou Blue whiting Verdinho
WGNEW
GUR Chelidonichthys cuculus Red gurnard Cabra-vermelha
GUU Chelidonichthys lucernus Tub gurnard Cabra-cabaço
MUR Mullus surmuletus Striped red mullet Salmonete-legítimo
OTHER
VMA Scomber colias Chub mackerel Cavala
BIB Trisopterus luscus Pouting Faneca
Annex III
The discard raising procedure presented is adapted from Jardim and Fernandes (2013).
Let D be discards in weight (kg), T fishing effort (hours), Y discards per unit effort (kg/hour) and P the trip
duration (days). The following indexes are used:
i=1, … ,N for fishing trips, j=1, … ,
J for fleets, h for
sampled
hauls and s=1, … ,
S for trip days. Small caps represent sampled quantities, while capitals represent
population quantities.
Step 0) Computation of discards in weight (
) and fishing time (
) by trip (i) and fleet (j)
Step 1) Estimation of discards in weight per hour by fleet
with variance
Step 2) Estimation of the total discards
with variance
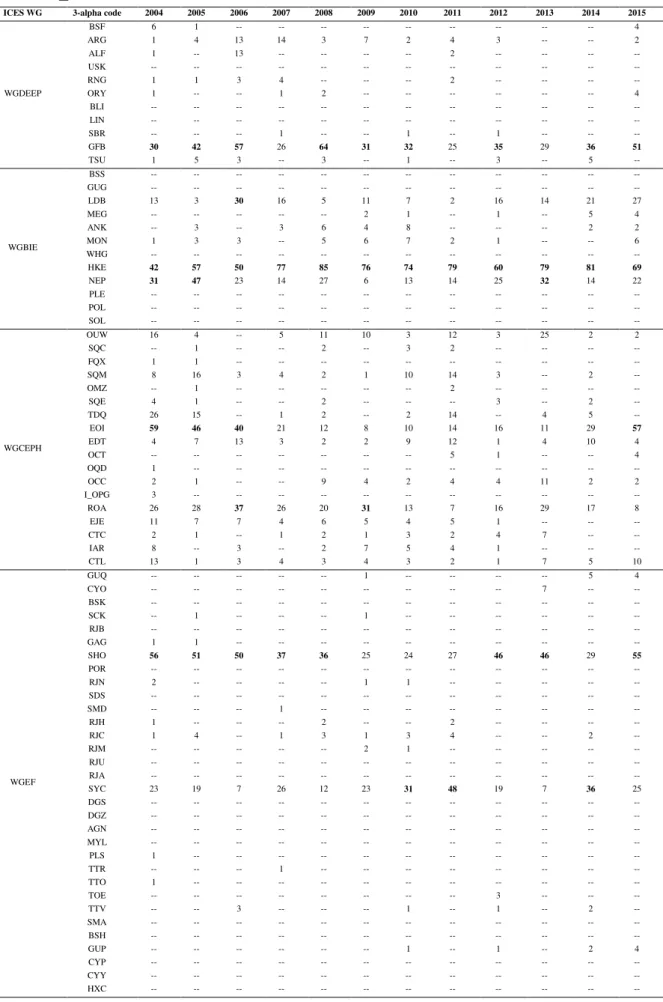
Annex IV
Table 2 -
Frequency of occurrence (%) of species in the discards of hauls sampled in the OTB_CRU fishery
(2004-2015). See Table 1
for species codes; “
--
” indicates no occurrence
; bold numbers indicate frequency of
occurrence
≥
30%.
ICES WG 3-alpha code 2004 2005 2006 2007 2008 2009 2010 2011 2012 2013 2014 2015
WGDEEP
BSF 6 1 -- -- -- -- -- -- -- -- -- 4
ARG 1 4 13 14 3 7 2 4 3 -- -- 2
ALF 1 -- 13 -- -- -- -- 2 -- -- -- --
USK -- -- -- -- -- -- -- -- -- -- -- --
RNG 1 1 3 4 -- -- -- 2 -- -- -- --
ORY 1 -- -- 1 2 -- -- -- -- -- -- 4
BLI -- -- -- -- -- -- -- -- -- -- -- --
LIN -- -- -- -- -- -- -- -- -- -- -- --
SBR -- -- -- 1 -- -- 1 -- 1 -- -- --
GFB 30 42 57 26 64 31 32 25 35 29 36 51
TSU 1 5 3 -- 3 -- 1 -- 3 -- 5 --
WGBIE
BSS -- -- -- -- -- -- -- -- -- -- -- --
GUG -- -- -- -- -- -- -- -- -- -- -- --
LDB 13 3 30 16 5 11 7 2 16 14 21 27
MEG -- -- -- -- -- 2 1 -- 1 -- 5 4
ANK -- 3 -- 3 6 4 8 -- -- -- 2 2
MON 1 3 3 -- 5 6 7 2 1 -- -- 6
WHG -- -- -- -- -- -- -- -- -- -- -- --
HKE 42 57 50 77 85 76 74 79 60 79 81 69
NEP 31 47 23 14 27 6 13 14 25 32 14 22
PLE -- -- -- -- -- -- -- -- -- -- -- --
POL -- -- -- -- -- -- -- -- -- -- -- --
SOL -- -- -- -- -- -- -- -- -- -- -- --
WGCEPH
OUW 16 4 -- 5 11 10 3 12 3 25 2 2
SQC -- 1 -- -- 2 -- 3 2 -- -- -- --
FQX 1 1 -- -- -- -- -- -- -- -- -- --
SQM 8 16 3 4 2 1 10 14 3 -- 2 --
OMZ -- 1 -- -- -- -- -- 2 -- -- -- --
SQE 4 1 -- -- 2 -- -- -- 3 -- 2 --
TDQ 26 15 -- 1 2 -- 2 14 -- 4 5 --
EOI 59 46 40 21 12 8 10 14 16 11 29 57
EDT 4 7 13 3 2 2 9 12 1 4 10 4
OCT -- -- -- -- -- -- -- 5 1 -- -- 4
OQD 1 -- -- -- -- -- -- -- -- -- -- --
OCC 2 1 -- -- 9 4 2 4 4 11 2 2
I_OPG 3 -- -- -- -- -- -- -- -- -- -- --
ROA 26 28 37 26 20 31 13 7 16 29 17 8
EJE 11 7 7 4 6 5 4 5 1 -- -- --
CTC 2 1 -- 1 2 1 3 2 4 7 -- --
IAR 8 -- 3 -- 2 7 5 4 1 -- -- --
CTL 13 1 3 4 3 4 3 2 1 7 5 10
WGEF
GUQ -- -- -- -- -- 1 -- -- -- -- 5 4
CYO -- -- -- -- -- -- -- -- -- 7 -- --
BSK -- -- -- -- -- -- -- -- -- -- -- --
SCK -- 1 -- -- -- 1 -- -- -- -- -- --
RJB -- -- -- -- -- -- -- -- -- -- -- --
GAG 1 1 -- -- -- -- -- -- -- -- -- --
SHO 56 51 50 37 36 25 24 27 46 46 29 55
POR -- -- -- -- -- -- -- -- -- -- -- --
RJN 2 -- -- -- -- 1 1 -- -- -- -- --
SDS -- -- -- -- -- -- -- -- -- -- -- --
SMD -- -- -- 1 -- -- -- -- -- -- -- --
RJH 1 -- -- -- 2 -- -- 2 -- -- -- --
RJC 1 4 -- 1 3 1 3 4 -- -- 2 --
RJM -- -- -- -- -- 2 1 -- -- -- -- --
RJU -- -- -- -- -- -- -- -- -- -- -- --
RJA -- -- -- -- -- -- -- -- -- -- -- --
SYC 23 19 7 26 12 23 31 48 19 7 36 25
DGS -- -- -- -- -- -- -- -- -- -- -- --
DGZ -- -- -- -- -- -- -- -- -- -- -- --
AGN -- -- -- -- -- -- -- -- -- -- -- --
MYL -- -- -- -- -- -- -- -- -- -- -- --
PLS 1 -- -- -- -- -- -- -- -- -- -- --
TTR -- -- -- 1 -- -- -- -- -- -- -- --
TTO 1 -- -- -- -- -- -- -- -- -- -- --
TOE -- -- -- -- -- -- -- -- 3 -- -- --
TTV -- -- 3 -- -- -- 1 -- 1 -- 2 --
SMA -- -- -- -- -- -- -- -- -- -- -- --
BSH -- -- -- -- -- -- -- -- -- -- -- --
GUP -- -- -- -- -- -- 1 -- 1 -- 2 4
CYP -- -- -- -- -- -- -- -- -- -- -- --
CYY -- -- -- -- -- -- -- -- -- -- -- --
Table 2 (cont.)
ICES WG 3-alpha code 2004 2005 2006 2007 2008 2009 2010 2011 2012 2013 2014 2015
WGEF (cont.)
DCA 5 5 3 4 8 2 2 2 4 18 7 2
SDU -- -- -- -- -- -- -- 2 -- -- 2 2
SHL 32 23 37 22 15 8 11 23 29 7 12 16
SYR 4 1 -- -- -- 1 -- -- 1 -- -- --
WGHANSA
ANE -- -- 13 4 -- -- -- 7 -- -- -- --
HOM 2 8 7 8 11 17 24 25 9 7 36 31
PIL 1 -- -- -- -- -- -- -- -- -- -- --
WGWIDE BOC 32 16 47 34 17 57 29 39 32 36 40 25
HER -- -- -- -- -- -- -- -- -- -- -- --
MAC 10 11 10 22 18 1 4 25 22 18 2 12
WHB 83 86 73 68 56 67 84 91 72 93 60 82
WGNEW
GUR -- -- -- -- -- -- -- -- -- 4 -- --
GUU -- -- 3 -- -- -- -- -- -- -- -- --
MUR -- -- -- -- -- -- 4 4 -- -- -- --
VMA 10 11 10 22 18 1 4 25 22 18 2 12
OTHER BIB 1 -- -- -- -- -- -- -- -- -- -- --
JAA -- 5 33 37 39 31 51 43 15 18 36 27
Table 3 -
Frequency of discarding (%) of supra-specif taxa in the hauls sampled from the OTB_CRU fishery
(2004-2015). See Table 1
for species groupings; “
--
” indicates no occurrence; bold
numbers indicate frequency of occurrence
≥
30%.
ICES WG Supra-specific group 3-alpha code 2004 2005 2006 2007 2008 2009 2010 2011 2012 2013 2014 2015
WGCEPH
Long-finned squids -- 16 5 -- 5 12 10 6 14 3 25 2 2
Squids SQU -- -- -- -- -- -- 5 2 3 -- 2 6
Short-finned squids -- 36 31 3 5 5 1 12 25 6 4 7 --
Octopuses -- 64 50 53 23 23 14 18 32 24 25 40 63
Cuttlefishes and sepiolods -- 41 38 47 33 29 42 24 16 25 36 21 18
Cephalopoda nei CEP 77 74 67 52 50 54 49 48 47 57 52 75
WGEF
Rajidae nei RAJ 5 7 7 1 3 1 1 2 1 4 5 --
Rajiformes nei SRX 2 -- 3 1 -- -- 1 -- 4 -- 2 2
Pelagic sharks nei I_PWS -- -- -- -- -- -- -- -- -- -- -- --
Deep-water sharks nei DWS 37 28 40 25 18 11 12 23 35 25 19 24
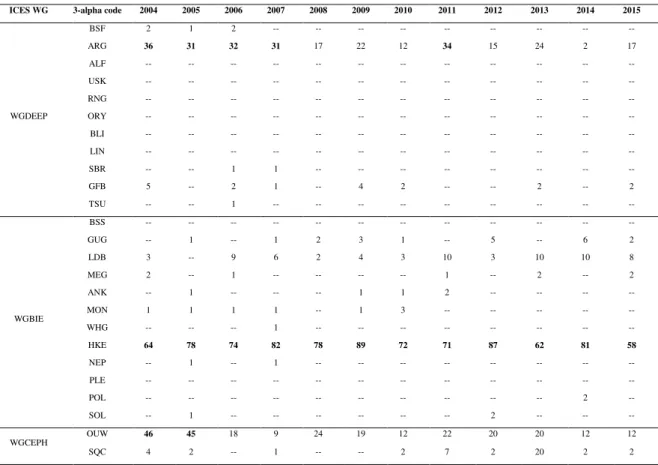
Table 4 -
Frequency of occurrence (%) of species in the discards of hauls sampled in the OTB_DEF fishery
(2004-2015). See Table 1
for species codes; “
--
” indicates no occurrence
; bold numbers indicate frequency of
occurrence
≥
30%.
ICES WG 3-alpha code 2004 2005 2006 2007 2008 2009 2010 2011 2012 2013 2014 2015
WGDEEP
BSF 2 1 2 -- -- -- -- -- -- -- -- --
ARG 36 31 32 31 17 22 12 34 15 24 2 17
ALF -- -- -- -- -- -- -- -- -- -- -- --
USK -- -- -- -- -- -- -- -- -- -- -- --
RNG -- -- -- -- -- -- -- -- -- -- -- --
ORY -- -- -- -- -- -- -- -- -- -- -- --
BLI -- -- -- -- -- -- -- -- -- -- -- --
LIN -- -- -- -- -- -- -- -- -- -- -- --
SBR -- -- 1 1 -- -- -- -- -- -- -- --
GFB 5 -- 2 1 -- 4 2 -- -- 2 -- 2
TSU -- -- 1 -- -- -- -- -- -- -- -- --
WGBIE
BSS -- -- -- -- -- -- -- -- -- -- -- --
GUG -- 1 -- 1 2 3 1 -- 5 -- 6 2
LDB 3 -- 9 6 2 4 3 10 3 10 10 8
MEG 2 -- 1 -- -- -- -- 1 -- 2 -- 2
ANK -- 1 -- -- -- 1 1 2 -- -- -- --
MON 1 1 1 1 -- 1 3 -- -- -- -- --
WHG -- -- -- 1 -- -- -- -- -- -- -- --
HKE 64 78 74 82 78 89 72 71 87 62 81 58
NEP -- 1 -- 1 -- -- -- -- -- -- -- --
PLE -- -- -- -- -- -- -- -- -- -- -- --
POL -- -- -- -- -- -- -- -- -- -- 2 --
SOL -- 1 -- -- -- -- -- -- 2 -- -- --
WGCEPH
OUW 46 45 18 9 24 19 12 22 20 20 12 12
Table 4 (cont.)
ICES WG 3-alpha code 2004 2005 2006 2007 2008 2009 2010 2011 2012 2013 2014 2015
WGCEPH (cont.)
FQX -- -- -- -- -- -- -- -- -- -- -- --
SQM 13 4 -- 1 1 -- -- 2 -- 2 -- --
OMZ -- -- -- -- -- -- -- -- -- -- -- --
SQE 1 -- -- -- -- -- -- -- -- -- -- --
TDQ 6 3 -- 1 -- -- -- -- 2 -- 8 --
EOI 17 16 8 5 4 9 8 5 3 2 4 6
EDT 1 2 1 4 2 1 2 2 2 -- -- --
OCT -- -- -- 1 -- -- -- 1 -- -- -- --
OQD -- -- -- -- -- -- -- 1 -- -- -- --
OCC 1 6 4 6 20 10 2 11 12 16 8 6
I_OPG -- -- -- -- -- -- -- -- -- -- -- --
ROA 1 4 1 4 2 1 -- -- -- -- 4 2
EJE 19 19 7 9 12 11 3 7 -- -- -- --
CTC 1 3 2 1 2 3 1 -- -- 2 2 2
IAR 14 5 1 2 5 8 1 -- 3 2 -- --
CTL 5 -- 1 1 -- -- 2 4 -- -- -- --
WGEF
GUQ -- -- -- -- -- -- -- -- -- -- -- --
CYO -- -- -- -- -- -- -- -- -- -- -- --
BSK -- -- -- -- -- -- -- -- -- -- -- --
SCK -- -- -- -- -- -- -- -- -- -- -- --
RJB -- -- -- -- -- -- -- -- -- -- -- --
GAG -- -- -- -- -- -- -- -- -- -- -- --
SHO 6 2 4 3 2 1 2 -- -- 2 -- 2
POR -- -- -- -- -- -- -- -- -- -- -- --
RJN 1 1 3 2 2 -- -- -- -- -- 4 --
SDS -- -- -- -- -- -- -- -- -- -- -- --
SMD -- -- -- -- -- -- -- -- -- -- -- --
RJH 3 1 3 1 -- -- 1 -- -- 2 -- --
RJC 8 3 5 10 5 5 6 12 3 6 10 6
RJM 1 1 2 1 2 1 2 2 -- 2 --
--RJU -- -- -- 1 -- 1 -- -- -- -- -- --
RJA -- -- -- -- -- -- -- -- -- -- -- --
SYC 22 21 20 19 27 18 21 42 23 20 42 17
DGS -- -- -- -- -- -- -- -- -- -- -- --
DGZ -- -- -- -- -- -- -- -- -- -- -- --
AGN -- -- -- -- -- -- -- -- -- -- -- --
MYL -- -- -- -- -- -- -- -- -- -- -- --
PLS -- -- -- -- -- -- -- -- -- -- -- --
TTR -- -- -- -- -- -- -- -- -- -- -- --
TTO -- -- -- -- -- -- -- -- -- -- -- --
TOE -- -- -- -- -- -- -- -- -- -- -- --
TTV -- -- -- -- -- -- -- -- -- -- -- --
SMA -- -- -- -- -- -- -- -- -- -- -- --
BSH -- -- -- -- -- -- -- -- -- -- -- --
GUP -- -- -- -- -- -- -- -- -- -- -- --
CYP -- -- -- -- -- -- -- -- -- -- -- --
CYY -- -- -- -- -- -- -- -- -- -- -- --
HXC -- -- -- -- -- -- -- -- -- -- -- --
DCA 1 -- -- -- -- -- -- -- -- -- -- --
SDU -- -- -- -- -- -- -- -- -- -- -- --
SHL 2 3 1 -- -- 1 -- -- -- -- -- --
SYR -- -- -- -- -- -- -- -- -- -- -- --
WGHANSA
ANE 9 10 10 16 9 10 8 17 2 4 6 2
HOM 8 32 13 4 10 11 16 5 13 14 17 6
PIL 46 43 27 20 24 20 41 30 15 22 12 10
WGWIDE
BOC 33 26 52 46 42 47 27 25 47 34 40 21
HER -- -- -- -- -- -- -- -- -- -- -- --
MAC 22 18 17 31 20 23 22 29 37 44 29 10
Table 4 (cont.)
ICES WG 3-alpha code 2004 2005 2006 2007 2008 2009 2010 2011 2012 2013 2014 2015
WGNEW
GUR 23 12 5 2 8 5 5 8 15 30 25 10
GUU 2 1 6 2 7 2 3 7 -- -- 10 2
MUR -- -- -- 1 -- -- 1 1 -- -- -- --
VMA 38 36 45 69 75 70 67 71 23 44 12 10
OTHER BIB 15 13 4 1 11 6 8 11 22 30 10 21
JAA 5 23 80 79 59 52 35 40 27 60 35 15
Table 5 -
Frequency of discarding (%) of supra-specic taxa in the hauls sampled from the OTB_DEF fishery (2004-2015).
See Table 1
for species groupings; “
--
” indicates no occurrence; bold numbers indicate frequency of occurrence
≥
30%.
ICES WG Supra-specific group 3-alpha code 2004 2005 2006 2007 2008 2009 2010 2011 2012 2013 2014 2015
WGCEPH
Long-finned squids -- 48 47 18 10 24 19 14 29 22 28 13 15
Squids SQU 2 -- -- -- -- -- 2 8 3 -- 8 6
Short-finned squids -- 17 8 -- 2 1 -- -- 2 2 2 8 --
Octopuses -- 18 21 12 15 24 20 11 19 17 18 12 12
Cuttlefishes and sepiolods -- 29 26 10 15 17 18 5 11 3 4 6 4
Cephalopoda nei CEP 66 59 29 31 48 38 25 53 33 40 40 33
WGEF
Rajidae nei RAJ 2 1 1 -- -- -- 2 -- 2 -- 8 2
Rajiformes nei SRX -- -- -- -- -- -- -- -- -- -- -- --
Pelagic sharks nei I_PWS -- -- -- -- -- -- -- -- -- -- -- --
Table 6 -
Volume (in metric tons) and CVs (%, in brackets) of species in the OTB_CRU fishery (2004-2015). See Table 1
for species codes;
“(a)” = low frequency of occurrence
.
ICES WG 3-alpha code 2004 2005 2006 2007 2008 2009 2010 2011 2012 2013 2014 2015
WGDEEP
BSF (a) (a) 0 (0%) 0 (0%) 0 (0%) 0 (0%) 0 (0%) 0 (0%) 0 (0%) 0 (0%) 0 (0%) (a)
ARG (a) (a) (a) (a) (a) (a) (a) (a) (a) 0 (0%) 0 (0%) (a)
ALF (a) 0 (0%) (a) 0 (0%) 0 (0%) 0 (0%) 0 (0%) (a) 0 (0%) 0 (0%) 0 (0%) 0 (0%)
RNG (a) (a) (a) (a) 0 (0%) 0 (0%) 0 (0%) (a) 0 (0%) 0 (0%) 0 (0%) 0 (0%)
ORY (a) 0 (0%) 0 (0%) (a) (a) 0 (0%) 0 (0%) 0 (0%) 0 (0%) 0 (0%) 0 (0%) 0 (0%)
SBR 0 (0%) 0 (0%) 0 (0%) (a) 0 (0%) 0 (0%) (a) 0 (0%) (a) 0 (0%) 0 (0%) 0 (0%)
GFB 30
(33%) 31 (48%)
264
(5%) (a)
25 (50%)
33 (25%)
18
(31%) (a)
7
(63%) (a)
31 (31%)
28 (30%)
TSU (a) (a) (a) 0 (0%) (a) 0 (0%) (a) 0 (0%) (a) 0 (0%) (a) 0 (0%)
WGBIE
LDB (a) (a) (a) (a) (a) (a) (a) (a) (a) (a) (a)
MEG 0 (0%) 0 (0%) 0 (0%) 0 (0%) 0 (0%) (a) (a) 0 (0%) (a) 0 (0%) (a) (a)
ANK 0 (0%) (a) 0 (0%) (a) (a) (a) (a) 0 (0%) 0 (0%) 0 (0%) (a) (a)
MON (a) (a) (a) 0 (0%) (a) (a) (a) (a) (a) 0 (0%) 0 (0%) (a)
HKE 87
(31%) 253 (54%) 51 (45%) 247 (40%) 251 (48%) 962 (45%) 183 (15%) 169 (32%) 159 (53%) 121 (33%) 323 (36%) 35 (34%)
NEP 10
(46%) 27
(53%) (a) (a) (a) (a) (a) (a) (a)
3
(54%) (a) (a)
WGCEPH
OUW (a) (a) 0 (0%) (a) (a) (a) (a) (a) (a) (a) (a) 0 (0%)
SQC 0 (0%) (a) 0 (0%) 0 (0%) (a) 0 (0%) (a) (a) 0 (0%) 0 (0%) 0 (0%) 0 (0%)
FQX (a) (a) 0 (0%) 0 (0%) 0 (0%) 0 (0%) 0 (0%) 0 (0%) 0 (0%) 0 (0%) 0 (0%) 0 (0%)
SQM (a) (a) (a) (a) (a) (a) (a) (a) (a) 0 (0%) (a) 0 (0%)
OMZ 0 (0%) (a) 0 (0%) 0 (0%) 0 (0%) 0 (0%) 0 (0%) (a) 0 (0%) 0 (0%) 0 (0%) 0 (0%)
SQE (a) (a) 0 (0%) 0 (0%) (a) 0 (0%) 0 (0%) 0 (0%) (a) 0 (0%) (a) 0 (0%)
TDQ (a) (a) 0 (0%) (a) (a) 0 (0%) (a) (a) 0 (0%) (a) (a) 0 (0%)
EOI 277
(32%) 99 (38%)
45
(10%) (a) (a) (a) (a) (a) (a) (a) (a)
89 (29%)
EDT (a) (a) (a) (a) (a) (a) (a) (a) (a) (a) (a) (a)
OCT 0 (0%) 0 (0%) 0 (0%) 0 (0%) 0 (0%) 0 (0%) 0 (0%) (a) (a) 0 (0%) 0 (0%) (a)
OQD (a) 0 (0%) 0 (0%) 0 (0%) 0 (0%) 0 (0%) 0 (0%) 0 (0%) 0 (0%) 0 (0%) 0 (0%) 0 (0%)
OCC (a) (a) 0 (0%) 0 (0%) (a) (a) (a) (a) (a) (a) (a) (a)
I_OPG (a) 0 (0%) 0 (0%) 0 (0%) 0 (0%) 0 (0%) 0 (0%) 0 (0%) 0 (0%) 0 (0%) 0 (0%) 0 (0%)
ROA (a) (a) 26
(7%) (a) (a)
16
(52%) (a) (a) (a) (a) (a) (a)
EJE (a) (a) (a) (a) (a) (a) (a) (a) (a) 0 (0%) 0 (0%) 0 (0%)
CTC (a) (a) 0 (0%) (a) (a) (a) (a) (a) (a) (a) 0 (0%) 0 (0%)
IAR (a) 0 (0%) (a) 0 (0%) (a) (a) (a) (a) (a) 0 (0%) 0 (0%) 0 (0%)
CTL (a) (a) (a) (a) (a) (a) (a) (a) (a) (a) (a) (a)
WGEF
GUQ 0 (0%) 0 (0%) 0 (0%) 0 (0%) 0 (0%) (a) 0 (0%) 0 (0%) 0 (0%) 0 (0%) (a) 0 (0%)
CYO 0 (0%) 0 (0%) 0 (0%) 0 (0%) 0 (0%) 0 (0%) 0 (0%) 0 (0%) 0 (0%) (a) 0 (0%) 0 (0%)
SCK 0 (0%) (a) 0 (0%) 0 (0%) 0 (0%) (a) 0 (0%) 0 (0%) 0 (0%) 0 (0%) 0 (0%) 0 (0%)
GAG (a) (a) 0 (0%) 0 (0%) 0 (0%) 0 (0%) 0 (0%) 0 (0%) 0 (0%) 0 (0%) 0 (0%) 0 (0%)
SHO 263
(39%) 150 (21%) 123 (14%) 22 (59%) 17
(27%) (a) (a) (a)
36 (94%)
17
(32%) (a)
35 (23%)
RJN (a) 0 (0%) 0 (0%) 0 (0%) 0 (0%) (a) (a) 0 (0%) 0 (0%) 0 (0%) 0 (0%) 0 (0%)
SMD 0 (0%) 0 (0%) 0 (0%) (a) 0 (0%) 0 (0%) 0 (0%) 0 (0%) 0 (0%) 0 (0%) 0 (0%) 0 (0%)
RJH (a) 0 (0%) 0 (0%) 0 (0%) (a) 0 (0%) 0 (0%) (a) 0 (0%) 0 (0%) 0 (0%) 0 (0%)
RJC (a) (a) 0 (0%) (a) (a) (a) (a) (a) 0 (0%) 0 (0%) (a) 0 (0%)
RJM 0 (0%) 0 (0%) 0 (0%) 0 (0%) 0 (0%) (a) (a) 0 (0%) 0 (0%) 0 (0%) 0 (0%) 0 (0%)
SYC (a) (a) (a) (a) (a) (a) 30
(29%) 49
(40%) (a) (a)
72
(38%) (a)
PLS (a) 0 (0%) 0 (0%) 0 (0%) 0 (0%) 0 (0%) 0 (0%) 0 (0%) 0 (0%) 0 (0%) 0 (0%) 0 (0%)
TTR 0 (0%) 0 (0%) 0 (0%) (a) 0 (0%) 0 (0%) 0 (0%) 0 (0%) 0 (0%) 0 (0%) 0 (0%) 0 (0%)
TTO (a) 0 (0%) 0 (0%) 0 (0%) 0 (0%) 0 (0%) 0 (0%) 0 (0%) 0 (0%) 0 (0%) 0 (0%) 0 (0%)
TOE 0 (0%) 0 (0%) 0 (0%) (a) 0 (0%) 0 (0%) 0 (0%) 0 (0%) (a) 0 (0%) 0 (0%) 0 (0%)
TTV 0 (0%) 0 (0%) (a) 0 (0%) 0 (0%) 0 (0%) (a) 0 (0%) (a) 0 (0%) (a) 0 (0%)
GUP 0 (0%) 0 (0%) 0 (0%) 0 (0%) 0 (0%) 0 (0%) (a) 0 (0%) (a) 0 (0%) (a) 0 (0%)
DCA (a) (a) (a) (a) (a) (a) (a) (a) (a) (a) (a) 0 (0%)
SDU 0 (0%) 0 (0%) 0 (0%) 0 (0%) 0 (0%) 0 (0%) 0 (0%) (a) 0 (0%) 0 (0%) (a) 0 (0%)
SHL 42
(40%) (a)
321
(5%) (a) (a) (a) (a) (a) (a) (a) (a) (a)