www.atmos-chem-phys.net/12/6939/2012/ doi:10.5194/acp-12-6939-2012
© Author(s) 2012. CC Attribution 3.0 License.
Chemistry
and Physics
Modeling nitrous acid and its impact on ozone and hydroxyl radical
during the Texas Air Quality Study 2006
B. H. Czader1, B. Rappengl ¨uck1, P. Percell1, D. W. Byun1,2,†, F. Ngan1,*, and S. Kim1,**
1Department of Earth and Atmospheric Sciences, University of Houston, Houston, TX, USA 2Air Resources Laboratory, NOAA, Silver Spring, MD20910, USA
*present address: Air Resources Laboratory, NOAA, Silver Spring, MD20910, USA **present address: Ajou University, Suwon, S. Korea
†deceased
Correspondence to:B. H. Czader ([email protected])
Received: 14 January 2012 – Published in Atmos. Chem. Phys. Discuss.: 23 February 2012 Revised: 10 July 2012 – Accepted: 13 July 2012 – Published: 2 August 2012
Abstract.Nitrous acid (HONO) mixing ratios for the Hous-ton metropolitan area were simulated with the Commu-nity Multiscale Air Quality (CMAQ) Model for an episode during the Texas Air Quality Study (TexAQS) II in Au-gust/September 2006 and compared to in-situ MC/IC (mist-chamber/ion chromatograph) and long path DOAS (Differ-ential Optical Absorption Spectroscopy) measurements at three different altitude ranges. Several HONO sources were accounted for in simulations, such as gas phase formation, direct emissions, nitrogen dioxide (NO2) hydrolysis,
photo-induced formation from excited NO2and photo-induced
con-version of NO2 into HONO on surfaces covered with
or-ganic materials. Compared to the gas-phase HONO forma-tion there was about a tenfold increase in HONO mixing ratios when additional HONO sources were taken into ac-count, which improved the correlation between modeled and measured values. Concentrations of HONO simulated with only gas phase chemistry did not change with altitude, while measured HONO concentrations decrease with height. A trend of decreasing HONO concentration with altitude was well captured with CMAQ predicted concentrations when heterogeneous chemistry and photolytic sources of HONO were taken into account. Heterogeneous HONO production mainly accelerated morning ozone formation, albeit slightly. Also HONO formation from excited NO2only slightly
af-fected HONO and ozone (O3) concentrations. Photo-induced
conversion of NO2into HONO on surfaces covered with
or-ganic materials turned out to be a strong source of daytime HONO. Since HONO immediately photo-dissociates during
daytime its ambient mixing ratios were only marginally al-tered (up to 0.5 ppbv), but significant increase in the hydroxyl radical (OH) and ozone concentration was obtained. In con-trast to heterogeneous HONO formation that mainly accel-erated morning ozone formation, inclusion of photo-induced surface chemistry influenced ozone throughout the day.
1 Introduction
The importance of nitrous acid (HONO) in the chemistry of the atmosphere stems from its photo-dissociation that serves as a significant source of hydroxyl radical (OH) (Lammel and Cape, 1996; Alicke et al., 2002, 2003; Kleffmann et al., 2005). OH plays a crucial role in the oxidation of volatile or-ganic compounds (VOCs) leading to the formation of ozone, in particular in urban areas with high burden of VOCs (see for instance Mao et al., 2010).
The occurrence of HONO in the lower atmosphere can be attributed to either direct emissions (Kirchstetter et al., 1996; Kurtenbach et al., 2001) or chemical formation. Among known chemical sources of HONO is the gas-phase forma-tion from the reacforma-tion between OH and nitric oxide (NO) (Pagsberg et al., 1997) and heterogeneous formation on sur-faces from nitrogen dioxide (NO2) hydrolysis (Kleffmann et
al., 1998; Finlayson-Pitts et al., 2003; Yu et al., 2009). Addi-tional nighttime formation of HONO that was not related to NO2was reported on aqueous surfaces in the marine
conversion of NO2 to HONO on surfaces covered with
hu-mic acid and other similar organic compounds. Several stud-ies pointed to HONO formation initiated by the electronic excitation of NO2; however, they differ in an explanation of
the exact mechanism of this process, and correspondingly, the yield of HONO formation (Crowley and Carl, 1997; Li et al., 2008, 2009; Carr et al., 2009; Amedro et al., 2011).
A number of studies reported modeling of HONO for-mation from different sources and its impact on ozone con-centrations. Li et al. (2010) performed 3-D model simula-tions with the WRF-CHEM model for Mexico City in which they accounted for several HONO sources. They concluded that addition of HONO sources other than gas-phase chem-istry significantly affects HOx(HOx= OH + HO2) in Mexico
City leading to a midday average increase in O3 of about
6 ppb. Sarwar et al. (2008) performed CMAQ modeling of HONO for the north-eastern area of the US in which, in ad-dition to the gas phase chemistry, HONO emissions, hetero-geneous HONO formation involving NO2and H2O and the
photolysis of HNO3 adsorbed on surfaces were accounted
for. This approach improved surface HONO predictions and resulted in an average ozone increase of 1.4 ppbv. The recent study of Wong et al. (2011) for Houston showed that during night HONO production on the surface is the major source of HONO and deposition the major removal pathway. A study of daytime HONO production for Houston indicate that there must be additional HONO sources beyond formation from reaction of OH and NO and from excited NO2(Wong et al.
2012). Both studies for Houston were limited to the use of 1-D model that simplifies transport processes.
The Houston-Galveston-Brazoria (HGB) area has one of the highest ozone concentrations in the US often exceed-ing the National Ambient Air Quality Standard for ozone (Berkowitz et al., 2004; Daum et al., 2003; Wilczak et al., 2009). Since high HONO concentrations were measured in Houston during several air quality campaigns, e.g. in 2006 (Stutz et al., 2010; Ziemba et al., 2010) and thereafter repeat-edly in 2009 (Wong et al., 2012) and 2010 (Rappengl¨uck et al., 2011), it is important to evaluate the impact of HONO on ozone for this region. The present study assesses sources and losses of HONO and its impact on ozone and HOx
forma-tion. HONO is simulated with a three dimensional Commu-nity Multiscale Air Quality (CMAQ) model which includes
concentrations of HONO are compared with in-situ as well as with long-path measurements at three different altitudes obtained in Houston, Texas.
2 Model configuration
Simulations for this study were performed with the CMAQ model version 4.7.1, released by the US Environmental Pro-tection Agency (EPA) (Byun and Schere, 2006). For the pur-pose of deriving reliable boundary conditions CMAQ was run with 36 km grid resolution for the domain covering con-tinental US, north Mexico, and south Canada and with 12 km grid resolution for the Texas domain. Current analysis is based on the simulations performed with 4 km grid reso-lution for the domain covering the HGB area. The atmo-sphere was divided into 23 vertical layers between the sur-face and 50 mbar (around 20 km height). Chemical reactions were simulated with the SAPRC-99 chemical mechanism (Carter, 1990, 2000) that included aerosol and aqua chem-istry (saprc99 ae5 aq). Simulations were performed for the 25 August–21 September 2006 time period that coincides with the Texas Air Quality Study II. Two days spin-up time was used to obtain realistic initial conditions.
The process analysis (PA) tool that is available in CMAQ was utilized in this work. PA provides information on the impact of different physical and chemical processes on sim-ulated concentrations. PA consist of two parts: integrated process rate (IPR) analysis that determines contributions of emissions, overall chemical reactions and transport processes to simulated mixing ratios, and integrated reaction rate (IRR) analysis that provides information on the impact of indi-vidual chemical reactions on the concentration of simulated compounds.
performed with the Meteorological Chemistry Interface Pro-cessor (MCIP) (Byun and Schere, 2006).
Gridded emissions were derived with the Sparse Ma-trix Operator Kernel Emissions (SMOKE) system (Houyoux et al., 2000) using the Texas inventory, including hourly-specific Texas Point-source Special Inventory (TPSI2006) for the year 2006, the Base5b 2007 area and non-road emis-sions, 2006 biogenic emisemis-sions, and mobile emissions de-rived from “linked based” and the High Performance Mon-itoring System (HPMS) data (available at: ftp://amdaftp. tceq.texas.gov/pub/HGB8H2/ei/). For SMOKE processing the Texas emission inventory was converted from the AIRS Facility Subsystem (AFS) to the Inventory Data Analyzer (IDA) format. Locations of point sources in the Lambert Conformal Conic (LCC) map projection format were con-verted into latitude-longitude (LL) coordinates for spatial allocation in SMOKE. The National Emission Inventory v. 2002 (NEI2002) was utilized for areas not covered by the Texas inventory.
2.1 HONO sources
In addition to the gas-phase HONO chemistry, the CMAQ version used in this study accounts for the heterogeneous formation of HONO on urban, leaves, and particle surfaces (Foley et al., 2009) with a reaction rate coefficientk=5×
10−5×(S/V )[s−1] as measured by Kurtenbach et al. (2001), whereS/V is the ratio of a surface area to volume of air. For this study we implemented two additional photo-dependent HONO sources into CMAQ as described below.
Stemmler et al. (2006, 2007) showed that HONO can be formed from the photo-induced reaction of NO2on
sur-faces covered with humic acid and similar organic materials. George et al. (2005) also observed photo-enhanced HONO production on solid organic compounds. These studies sug-gested that the uptake coefficient for reaction with organ-ics is much larger than the one for heterogeneous reaction and that it depends on solar radiation. Enhanced photochem-ical production of HONO was also reported by Ndour et al. (2008) and Monge et al. (2010). Based on these studies Li et al. (2010) implemented a daytime HONO source with an uptake coefficient of 2×10⁻⁵ for light intensities less
than 400 W m−2 and an uptake coefficient scaled by (light intensity) / 400 for solar radiation larger than 400 W m−2.
We adopted this approach for CMAQ simulations for Hous-ton, but obtained unrealistically high HONO concentrations. Therefore, contrary to Li et al. (2010) our approach does not employ a threshold value for solar radiation as we used an up-take coefficient of 2×10⁻⁵scaled by (light intensity) / 900,
where light intensity at local noon reaches about 900 W m−2.
According to the following equation for the reaction rate co-efficient:
k=1
8vNO2 S
Vrg
(1)
wherevNO2is the mean molecular speed of NO2,S/V is the surface to volume ratio, andrgis the reactive uptake
coeffi-cient, the reaction uptake coefficientrgof 2×10⁻⁵resulted in
a reaction rate coefficientkof 1×10⁻³×(S/V )[s−1] scaled
to (light intensity / 900).
Formation of HONO initiated by excitation of NO2 was
confirmed by several studies. Li et al. (2008) reported that the excited NO2 (indicated as NO2∗) reacts with water to
produce HONO and determined a reaction rate coefficient of 1.7×10⁻¹³cm3s−1. Carr et al. (2009) and Amedro et
al. (2011) suggested that this is a two step process involving two NO2∗ molecules, and consequently, less efficient than
the one reported by Li et al. (2008). In our study we adopted the Li et al. (2008) approach; therefore, our results provide an upper bound of the impact of this reaction on atmospheric chemistry. The excess energy of excited NO2can also be
re-leased upon collision with nitrogen, oxygen, or water; there-fore, these reactions were also accounted for in the model. The impact of this reaction was subject of several studies. While the modeling study of Wennberg and Dabdub (2008) show that exited NO2chemistry causes significant ozone
in-crease in California (up to 55 ppb) when modeled for a past period (1987) when still high NOxemissions were observed,
Ensberg et al. (2010) obtained much smaller impact on ozone when lower NOx emissions occurring in 2005 were
simu-lated.
HONO emissions from mobile sources, non-road sources, such as construction and lawn equipment, as well as off-road sources, such as emissions from ships, locomotives, and air-crafts were estimated based on the Kurtenbach et al. (2001) formula HONO / NOx= 8×10⁻³.
Three simulations were performed using different HONO sources and are indicated as follows:
G –gas-phase HONO chemistry;
GEH – gas phase chemistry, HONO emissions, and HONOheterogeneous formation;
GEHP – same as GEH, but with addition of p hoto-induced HONO production;
3 Results and discussion
3.1 Evaluation of HONO modeling
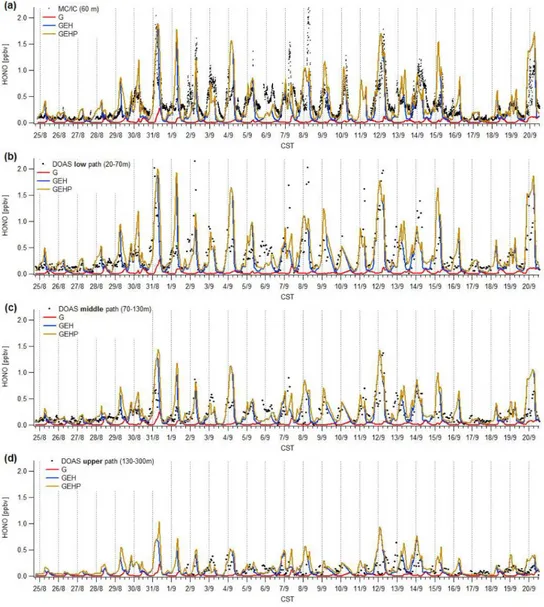
Fig. 1.Comparison of measured vs. simulated HONO time series at the UH Moody Tower for the time period 25 August–20 September 2006. Dots represent measured values, the solid lines represent CMAQ predicted concentration from G, GEH, and GEHP cases (explanation see text). Dashed vertical lines indicate midnight times.(a): Comparison with data measured in-situ by a MC/IC system at the top of the Moody Tower, at 60 m a.g.l.(b–d): Time series comparison of HONO measured from the Moody Tower by DOAS low light-path(b), middle light path(c), and upper path(d).
of HONO concentrations. HONO mixing ratios from GEH and GEHP cases are much closer to the observed values (e.g. 31 August, 12 and 20 September). The advantage of including photochemical HONO sources can nicely be seen on 30 August, 7, 9, and 13 September (and others) when daytime HONO values from the GEHP case are higher and closer to measurements than HONO values from the GEH case. In some cases a mismatch between observed and sim-ulated HONO values occurs (e.g. 1 and 6 September). This is mostly related to mismatch in NO2concentrations as
dis-cussed further below.
In order to evaluate HONO modeling for different alti-tudes in the urban boundary layer observational HONO data
values reaching about 2 ppbv at the low level and only about 0.5 ppbv at the upper level. Contrary to the measured values, HONO mixing ratios from the G case do not show variation with height. HONO values obtained from GEH and GEHP cases correctly capture the trend towards lower nighttime and early morning mixing ratios at higher altitudes. In addition, including photolytic HONO sources in the GEHP case re-sulted in average 100 ppt higher daytime HONO concentra-tions at the low DOAS level and an average daytime increase of 50 and 30 ppt at the middle and upper DOAS levels, re-spectively. Since most of the photolytic HONO production occurs by NO2reaction at the surface, stronger increase was
obtained at the lower altitudes and changes in HONO mixing ratios at higher altitudes can be explained by upward trans-port of HONO (see discussion in Sect. 3.2 and bottom graph in Fig. 9).
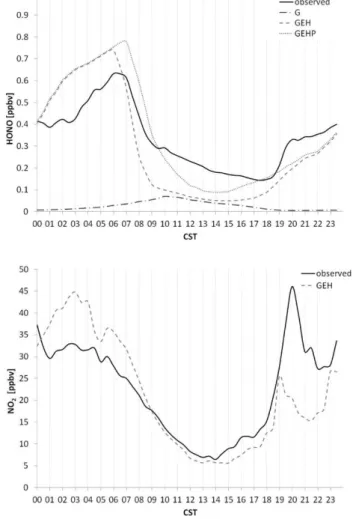
Figure 2 shows an average diurnal variation of HONO and NO2 based on the same data set (25 August–20 September
2006) for all simulated cases as well as MC/IC observed val-ues. This presentation summarizes clearly the general differ-ences in HONO model simulations. It can be seen that higher daytime values were obtained from the GEHP case, which in-cludes photolytic HONO formation, in comparison with the GEH case, in which heterogeneous HONO production dom-inates HONO sources. The model tends to overpredict NO2
during nighttime and early morning which causes overpre-diction of simulated HONO at those times.
Figure 3 shows a time series comparison of NO2measured
by DOAS with the values simulated with the GEH case. Too high NO2concentrations on 1 and 4 September resulted in
over prediction of HONO concentrations at those times. In contrast, NO2 under prediction on 2, 7, and 8 September
leads to under predictions of HONO. There may be several reasons for NO2mismatches, such as uncertainties in
emis-sion inventory or mixing layer height, in some cases these mismatches can be related to predictions of meteorological parameters. For example, on the night of 1 September the measurements indicate calm conditions, while the model pre-dicts strong southerly winds, causing lower modeled concen-trations at the location of measurements. On 6 September the model fails to predict precipitation correctly which in turn di-rectly affects the concentration of pollutants. The correlation coefficient between HONO values measured at the DOAS low path and those simulated with GEH case is 0.68. How-ever, when data points with wrong NO2prediction were
ig-nored and only NO2 values simulated within 70 % of
mea-sured value were considered the correlation coefficient for HONO increased to 0.82.
3.2 Impact of HONO on HOxand ozone formation
31 August and 1 September were the days with the poorest air quality index for Houston in the entire year 2006 (see also Rappengl¨uck et al., 2008): peak 8-h averages of up to 126 ppbv on 31 August and up to 129 ppbv on 1 September
Fig. 2.Average diurnal variation of HONO (top) and NO2(bottom)
based on data for 25 August–20 September 2006 at the top of the Moody Tower, at 60 m a.g.l. Measured data obtained by MC/IC.
were measured in the Houston area. In particular for 31 Au-gust meteorological modeling (Ngan et al., 2012) has been extensively studied. Since it is of particular interest to an-alyze the potential impact of HONO on O3 formation for
ozone exceedance days most of the analysis presented here is focusing on 31 August.
Fig. 3.Time series comparison of NO2measured from the Moody Tower by DOAS low light-path (top graph), middle light path (middle
graph), and upper path (bottom graph) with simulated mixing ratios for 25 August–20 September 2006.
Fig. 4.Time series of observed and simulated OH mixing ratios at the top of the Moody Tower, at 60 m a.g.l., which corresponds to the second model layer.
employed. This analysis was based on data which were aver-aged in a box consisting of 25 horizontal cells with the mid-dle cell corresponding to the location of the Moody Tower. The gray line in Fig. 5 shows IRR results for the GEHP case for the sum of reactions HONO +hν→OH + NO and
NO2∗+ H2O→OH + HONO that can be interpreted as the
Fig. 5. OH production from the reaction of HONO +hν→OH + NO and NO2∗+ H2O→OH + HONO.
on OH formation an additional simulation was performed in which photochemical HONO formation on surfaces covered with organic materials was not included; this simulation is indicated in the graph as “GEHP (no surface phot)”. Dur-ing mornDur-ing hours OH production from the GEHP case was 2–3 times higher than production from the case without pho-tochemical HONO formation (the GEH case) indicating that HONO produced in a photochemical way on surfaces is a significant source of OH in the morning. Reactions involving NO2∗contributed only about 30 % to the increase in OH.
IRR analysis was also employed to assess HONO contri-bution to radical production relative to other radical sources. Due to the fast chemistry between OH and the hydroperoxyl radical (HO2) both radicals were considered in the
analy-sis as HOx(HOx=OH + HO2). Figure 6 illustrates the
diur-nal variations of contributions of O3, HCHO, HONO (from
photolysis reaction), NO2∗, and alkenes to the HOx budget
for 31 August 2006. The results from the G case show that the contribution of HONO to the HOxformation rates in the
morning (06:00–09:00 a.m. CST) is 45 %, which is low in comparison to other studies. For example, Mao et al. (2010) demonstrated that in the Houston area HONO is the major contributor to HOxin the morning. In our model analysis the
morning contribution of HONO to HOx formation rates in
Houston became dominant (81 %) when HONO emissions and heterogeneous chemistry is taken into account (GEH case). In the GEHP case HONO contributes 83 % to HOx
formation and NO2∗contributes 7 % by directly forming OH
radicals. The GEHP case also resulted in higher contributions throughout the day, especially between 09:00 a.m. and noon CST when HONO contribution to HOxis 52 % (20 % higher
than contribution from GEH case at that time).
Figure 7 shows comparison of observed and simulated ozone concentrations at the DOAS low level for simulated time period of 25 August–20 September 2006. As it is hard to distinguish differences in ozone concentrations among
sim-Fig. 6.Diurnal variations of contributions of O3, HCHO, HONO
(from photolysis reaction), NO∗
2, and alkenes to the HOxbudget for
the G case (top), GEH case (middle), and GEHP case (bottom) at the top of the Moody Tower, at 60 m a.g.l.
Fig. 7.Time series comparison of O3measured from the Moody Tower by DOAS low light-path with simulated mixing ratios for 25 August–
20 September 2006. The insert shows a blow-up for 31 August 2006, displaying all three model simulations vs. the observed O3data on that
day.
was formed from HONO on 31 August as there were much higher NO2 mixing ratios and consequently higher HONO
levels observed on that day as compared to 30 August. The first row of Fig. 8 shows differences in ozone for 30 August at the time of the maximum HONO impact. While ozone changes due to HONO formed in a heterogeneous way are minimal (left graph), the difference in ozone between the GEHP and G cases reach 4.3 ppbv at noon (right graph). On 31 August ozone increase from the GEH case reaches 3 ppbv at 09:00 a.m. CST while at the same time ozone differences for the GEHP case are around 8 ppbv (middle row). In the afternoon, at the time of the maximum impact of HONO on ozone mixing ratios, ozone changes in the GEH case reach only 2 ppbv and are confined to a smaller area, while in the GEHP case ozone increases up to 11 ppbv in comparison to the G case (bottom row).
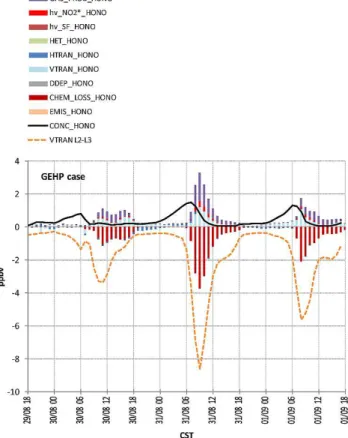
Even though about a tenfold increase in HONO concen-tration related to its heterogeneous formation and emissions was simulated with the GEH case (see Fig. 1) as compared to the G case, the impact of it on ozone was small. To get more insights into sources and losses of HONO the process analysis (PA) was utilized. The results of the process analysis for the G, GEH, and GEHP cases are presented in Fig. 9 and can be interpreted as contributions of processes and chemical reactions to changes in HONO mixing ratios. Processes that contribute to an increase in HONO mixing ratios are plotted with positive values, and those contributing to a decrease in HONO mixing ratio are shown with negative values. Note that the rate of change at a given hour represents change in HONO mixing ratio between that hour and the previous hour. Since most of the HONO sources occur on the surface this analysis is confined to the first model layer (0–34 m a.g.l.); horizontally data was averaged in 25 cells with the middle cell corresponding to the location of the Moody Tower. In the G case, the gas-phase chemistry (GAS PROD HONO) contributes the most to an increase in HONO mixing ra-tio; about 60 % of produced HONO is consumed by means
of photolysis and reaction with OH during daytime (indi-cated in the graph as CHEM LOSS HONO), about 20 % is deposited to the ground, and 20 % removed by transport processes. In the GEH case, 71 % of HONO production is caused by heterogeneous surface chemistry (HET HONO) during nighttime and early morning. The accumulation of HONO formed by heterogeneous chemistry and emitted dur-ing nighttime leads to the peak HONO concentration that oc-curs around 06:00 a.m. CST (which is 3–4 h earlier in com-parison to the G case). At that time direct HONO emissions contribute 27 %. During daytime contribution from emis-sions increases to 50 %, while heterogeneous and gas for-mation contributes 31 % and 19 %, respectively. The main removal of HONO from the surface layer is through up-ward transport (VTRAN HONO) that contributes 77 % to nighttime and 65 % to daytime reduction in HONO concen-tration. Dry deposition removes 23 % and 12 % of HONO during nighttime and daytime, respectively. 24 % of day-time HONO reacts to form OH. Although dry deposition and vertical transport are significant HONO removal processes during nighttime, the production of HONO is higher lead-ing to a net increase of HONO concentration that result in the morning peak. After sunrise photochemical reactions add to the removal of HONO resulting in a decrease of HONO concentration. There are two additional pathways of pho-tochemical HONO production in the GEHP case, these are photochemical formation on surfaces covered with organic material (hν SF HONO) and formation from excited NO2
(hν NO2∗ HONO). Although we used the largest reaction coefficient for HONO formation from excited NO2it resulted
Fig. 8.Differences in surface ozone simulations between GEH-G case (left) and GEHP-G case (right) for 30 August at noon (top row), 31 August 2006 at 09:00 a.m. CST (middle row) and 01:00 p.m. CST (bottom row).
HONO mixing ratios. High removal by vertical transport can be explained by the fact that diffusion between a cell and a neighboring cell is proportional to the concentration gradient between those cells. Since the extra HONO in the GEHP case is added just in layer 1, then that increases vertical diffusion out of layer 1. HONO chemical loss (CHEM LOSS HONO) immediately after sunrise is more significant in the GEHP case than the GEH case. About twice as much HONO photo-dissociates in the GEHP case producing twice as much OH and NO as compared to the GEH case. As previously shown, this additional OH resulted in higher OH and O3mixing
ra-tios in the GEHP case (see Figs. 5, 7, and 8). Figure 10 shows contributions of processes and chemical reactions to changes
Fig. 9.HONO mixing ratio (black line) in ppbv and contribution of different processes to changes in HONO mixing ratios (columns) for G case (top), GEH case (middle), and GEHP case (bottom) in the first model layer (0–34 m a.g.l.). Note that the scale is differ-ent in the graphs. GAS PROD HONO represdiffer-ents OH + NO reaction producing HONO, hνNO2∗ HONO is HONO formed from ex-cited NO2,hν SF HONO–is photochemical production of HONO
on surfaces, HET HONO represents change in HONO mixing ra-tio due to heterogeneous chemistry, VTRAN HONO–vertical trans-port, HTRAN HONO–horizontal transtrans-port, DDEP HONO–dry de-position, CHEM LOSS HONO–oss of HONO by gas phase chem-ical reactions, EMIS HONO–emissions.
Fig. 10.The same as Fig. 9 but for the model layer 2, which is between 34–85 m a.g.l. “VTRAN L2–L3” represents HONO trans-ported upward from layer 2 to the next model layer.
4 Conclusions
CMAQ simulations of HONO that included several sources of HONO were performed and compared with MC/IC mea-sured values at the Moody Tower and DOAS measurements at three altitudes. In addition, source and losses for HONO as well as the impact of its different sources on HOxand O3
were examined.
Accounting for additional HONO production (e.g. hetero-geneous HONO formation) as compared to gas-phase for-mation resulted in about a tenfold increase in the morn-ing HONO concentrations causmorn-ing improved correlation be-tween modeled and measured values. Also, for the first time a 3-D chemistry transport model such as CMAQ could be to a large extent successfully validated against vertically resolved HONO measurements during day and nighttime, and was able to capture correctly a trend of decreasing HONO con-centration with altitude. Since NO2is a precursor of HONO
the mismatches in NO2modeling directly influence HONO
predictions. The correlation between measured and simu-lated HONO values increased significantly when data points with wrong NO2prediction were ignored and only NO2
Heterogeneous HONO production is a major source of HONO during nighttime leading to HONO accumulation and early morning peak concentration of up to 2 ppbv. Since HONO dissociation at that time is less important than de-position and vertical transport, heterogeneous HONO pro-duction only slightly increases concentrations of OH and O3
(up to 3 ppbv ozone increase). The implementation of addi-tional photo-dependent HONO sources, in particular HONO formation from the photo-induced reaction of NO2 on
sur-faces covered with humic acid and similar organic materi-als, only resulted in an increase in HONO mixing ratios of at most 0.5 ppbv. However, process analysis shows that actu-ally much more HONO was produced, but was quickly trans-ported upward and dissociated, which resulted in doubled morning production of hydroxyl radical and an ozone in-crease of up to 11 ppbv. In contrast to heterogeneous HONO formation that mainly accelerates morning ozone formation, inclusion of HONO photochemical sources influences ozone throughout the day, affecting its peak concentration.
Although daytime HONO formation mechanisms may not be understood in all details and the implementation of it to the model is based on many assumptions and simplifica-tions, for example the estimation of urban surfaces or un-certainties in the uptake coefficient, this paper demonstrates that photochemical HONO formation can be a strong source of daytime HONO that directly impacts OH mixing ratios and peak ozone concentrations while nighttime and early morning HONO production by means of NO2 hydrolysis
greatly affects the HONO morning peak concentration but only slightly increases hydroxyl radical and ozone concen-trations.
Acknowledgements. The authors would like to thank the Houston Advanced Research Center (HARC) for support. Observational DOAS data provided by Jochen Stutz, UCLA and MC/IC data provided by Jack Dibb, UNH. OH data provided by Bill Brune, Penn State University.
Edited by: A. Hofzumahaus
References
Alicke, B., Platt, U., and Stutz, J.: Impact of nitrous acid photoly-sis on the total hydroxyl radical budget during the limitation of oxidant production/Pianura Padana Produzione di Ozono study I Milan, J. Geophys. Res., 107, 8196, doi:10.1029/2000JD000075, 2002.
Alicke, B., Geyer, A., Hofzumahaus, A., Holland, F., Konrad, S., P¨atz, H. W., Sch¨afer, J., Stutz, J., Volz-Thomas, A., and Platt, U.: OH formation by HONO photolysis during the BERLIOZ exper-iment, J. Geophys. Res., 108, 8247, doi:10.1029/2001JD000579, 2003.
Amedro, D., Parker, A. E., Schoemaecker, C., and Fittschen, C.: Direct observation of OH radicals after 565 nm multi-photon
ex-citation of NO2in the presence of H2O, Chem. Phys. Lett., 513, 12–16, doi:10.1016/j.cplett.2011.07.062, 2011.
Berkowitz, C. M., Jobson, T., Jiang, G., Spicer, C. W., and Doskey, P. V.: Chemical and meteorological characteristic associated with rapid increases of O3in Houston, Texas, J. Geophys. Res., 109,
D10307, doi:10.1029/2003JD004141, 2004.
Byun, D. and Schere, K. L.: Review of the Governing Equa-tions, Computational Algorithms, and Other Components of the Models-3 Community Multiscale Air Quality (CMAQ) Model-ing System, Appl. Mech. Rev., 59, 51–77, 2006.
Carr, S., Heard, D. E., and Blitz, M. A.: Comment on “Atmospheric Hydroxyl Radical Production from Electronically Excited NO2
and H2O”, Science, 324, 336b, doi:10.1126/science.1166669,
2009.
Carter, W. P. L.: A Detailed Mechanism for the Gas-Phase Atmo-spheric Reactions of Organic Compounds, Atmos. Environ., 24, 481–518, 1990.
Carter, W. P. L.: Documentation of the SAPRC-99 chemical mech-anism for VOC reactivity assessment, Final Report to the Cali-fornia Air Resources Board, Contracts 92-32 and 95-308, River-side, CA, available at: http://www.cert.ucr.edu/∼carter/absts. htm#saprc99, 2000.
Cheng, F.-Y. and Byun, D. W.: Application of high resolution land use and land cover data for atmospheric modeling in the Houston-Galveston metropolitan area, Part I, Meteorological simulation results, Atmos. Environ., 42, 7795–7811, 2008. Crowley, J. N. and Carl, S. A.: OH Formation in the Photoexcitation
of NO2beyond the Dissociation Threshold in the Presence of
Water Vapor, J. Phys. Chem. A, 101, 4178–4184, 1997. Daum, P. H., Kleinman, L. I., Springston, S. R., Nunnermacker, L.
J., Lee, Y.-N., Weinstein-Lloyd, J., Zheng, J., and Berkowitz, C. M.: A comparative study of O3formation in the Houston urban
and industrial plumes during the 2000 Texas Air Quality Study, J. Geophys. Res., 108, 4715, doi:10.1029/2003JD003552, 2003. Ensberg, J. J., Carreras-Sospedra, M., and Dabdub, D.: Impacts of electronically photo-excited NO2on air pollution in the South
Coast Air Basin of California, Atmos. Chem. Phys., 10, 1171– 1181, doi:10.5194/acp-10-1171-2010, 2010.
Finlayson-Pitts, B. J., Wingen, L. M., Sumner, A. L., Syomin, D., and Ramazan, K. A.: The heterogeneous hydrolysis of NO2in
laboratory systems and in outdoor and indoor atmospheres: and integrated mechanism, Phys. Chem. Chem. Phys., 5, 223–242, 2003.
Foley, K. M., Roselle, S. J., Appel, K. W., Bhave, P. V., Pleim, J. E., Otte, T. L., Mathur, R., Sarwar, G., Young, J. O., Gilliam, R. C., Nolte, C. G., Kelly, J. T., Gilliland, A. B., and Bash, J. O.: Incremental testing of the Community Multiscale Air Quality (CMAQ) modeling system version 4.7, Geosci. Model Dev., 3, 205–226, doi:10.5194/gmd-3-205-2010, 2010.
George, C., Sterkowski, R. S., Kleffmann, J., Stemmler, K., and Ammann, M.: Photoenhanced uptake of gaseous NO2on solid organic compounds: a photochemical source of HONO?, Fara-day Discuss., 130, 195–210, 2005.
Grell, G. A., Dudhia, J., and Stauffer, D. R.: A description of the Fifth-Generation Penn State/NCAR Mesoscale Model (MM5), NCAR Technical Note, NCAR/TN−398 + STR, 122 pp., avail-able at: http://www.mmm.ucar.edu/mm5/, 1994.
MCNC-ner, A.: Daytime formation of nitrous acid: A major source of OH radicals in a forest, Geophys. Res. Lett., 32, L05818, doi:10.1029/2005GL022524, 2005.
Kurtenbach, R., Becker, K. H., Gomes, J. A. G., Kleffmann, J., L¨orzer, J. C., Spittler, M., Wiesen, P., Ackermann, R., Geyer, A., and Platt, U.: Investigations of emissions and heterogeneous for-mation of HONO in a road traffic tunnel, Atmos. Environ., 35, 3385–3394, 2001.
Lammel, G. and Cape, J. N.: Nitrous acid and nitrate in the atmo-sphere, Chem. Soc. Rev., 25, 361–369, 1996.
Li, S., Matthews, J., and Sinha, A.: Atmospheric Hydroxyl Radical Production from Electronically Excited NO2and H2O, Science,
319, 1657–1660, 2008.
Li, S., Matthews, J., and Sinha, A.: Response to Com-ment on “Atmospheric Hydroxyl Radical Production from Electronically Excited NO2 and H2O”, Science, 324, 336,
doi:10.1126/science.1166877, 2009.
Li, G., Lei, W., Zavala, M., Volkamer, R., Dusanter, S., Stevens, P., and Molina, L. T.: Impacts of HONO sources on the photochem-istry in Mexico City during the MCMA-2006/MILAGO Cam-paign, Atmos. Chem. Phys., 10, 6551–6567, doi:10.5194/acp-10-6551-2010, 2010.
Li, X., Brauers, T., H¨aseler, R., Bohn, B., Fuchs, H., Hofzumahaus, A., Holland, F., Lou, S., Lu, K. D., Rohrer, F., Hu, M., Zeng, L. M., Zhang, Y. H., Garland, R. M., Su, H., Nowak, A., Wieden-sohler, A., Takegawa, N., Shao, M., and Wahner, A.: Explor-ing the atmospheric chemistry of nitrous acid (HONO) at a ru-ral site in Southern China, Atmos. Chem. Phys., 12, 1497–1513, doi:10.5194/acp-12-1497-2012, 2012.
Mao J., Ren X., Chen S., Brune W. H., Chen Z., Martinez M., Harder H., Lefer B., Rappengl¨uck B., Flynn J., and Leuch-ner M.: Atmospheric Oxidation Capacity in the Summer of Houston 2006: Comparison with Summer Measurements in Other Metropolitan Studies, Atmos. Environ., 44, 4107–4115, doi:10.1016/j.atmosenv.2009.01.013, 2010.
Monge, M. E., D’Anna, B., Mazri, L., Giroir-Fendler, A., Ammann, M., Donaldson, D. J., and George, C.: Light changes the atmo-spheric reactivity of soot, P. Natl. Acad. Sci., 107, 6605–6609, 2010.
Ndour, M., D’Anna, B., George, C., Ka, O., Balkanski, Y., Kleffmann, J., Stemmler, K., and Ammann, M.: Photoen-hanced uptake of NO2 on mineral dust: Laboratory
experi-ments and model simulations, Geophys. Res. Lett., 35, L05812, doi:10.1029/2007GL032006, 2008.
Ngan, F., Byun, D. W., Kim, H. C., Rappengl¨uck, B., and Pour-Biazar, A.: Performance Assessment of
Retrospec-Golovko, J., Alvarez, S., Flynn, J., Haman, C., and Grossberg, N.: University of Houston Moody Tower 2010 Ozone Formation Research Monitoring, Report to the Texas Commission on En-vironmental Quality, Project Grant No. 582-5-64594-FY10-14, August 2011, 98 pp., 2011
Rohrer, F., Bohn, B., Brauers, T., Br¨uning, D., Johnen, F.-J., Wah-ner, A., and Kleffmann, J.: Characterisation of the photolytic HONO-source in the atmosphere simulation chamber SAPHIR, Atmos. Chem. Phys., 5, 2189–2201, doi:10.5194/acp-5-2189-2005, 2005.
Sarwar, G., Roselle, S. J., Mathur, R., Appel, W., Dennis, R. L., and Vogel, B.: A comparison of CMAQ HONO predictions with ob-servations from the Northeast Oxidant and Particle Study, Atmos. Environ., 42, 5760–5770, 2008.
S¨orgel, M., Regelin, E., Bozem, H., Diesch, J.-M., Drewnick, F., Fischer, H., Harder, H., Held, A., Hosaynali-Beygi, Z., Martinez, M., and Zetzsch, C.: Quantification of the unknown HONO day-time source and its relation to NO2, Atmos. Chem. Phys., 11,
10433–10447, doi:10.5194/acp-11-10433-2011, 2011.
Stemmler, K., Ammann, M., Donders, C., Kleffmann, J., and George, C.: Photosensitizied reduction of nitrogen dioxide on humic acid as a source of nitrous acid, Nature, 440, 195–198, 2006.
Stemmler, K., Ndour, M., Elshorbany, Y., Kleffmann, J., D’Anna, B., George, C., Bohn, B., and Ammann, M.: Light induced conversion of nitrogen dioxide into nitrous acid on submi-cron humic acid aerosol, Atmos. Chem. Phys., 7, 4237–4248, doi:10.5194/acp-7-4237-2007, 2007.
Stutz, J., Oh, H.-J., Whitlow, S. I., Anderson, C. H., Dibb, J. E., Flynn, J., Rappengl¨uck, B., and Lefer B.: Si-multaneous DOAS and Mist-Chamber IC measurements of HONO in Houston, TX, Atmos. Environ., 44, 4090–4098, doi:10.1016/j.atmosenv.2009.02.003, 2010.
Su, H., Cheng, Y. F., Shao, M., Gao, D. F., Yu, Z. Y., Zeng, L. M., Slanina, J., Zhang, Y. H., and Wiedensohler, A.: Nitrous acid (HONO) and its daytime sources at a rural site during the 2004 PRIDE-PRD experiment in China, J. Geophys. Res., 113, D14312, doi:10.1029/2007JD009060, 2008.
Su, H., Cheng, Y., Oswald, R., Behrendt, T., Trebs, I., Meixner, F. X., Andreae, M. O., Cheng, P., Zhang, Y., and P¨oschl, U.: Soil ni-trite as a source of atmospheric HONO and OH radicals, Science, 333, 1616–1618, 2011.
Wennberg, P. O. and Dabdub, D.: Rethinking Ozone Production, Science, 319, 1624–1625, 2008.
P.: Analysis of regional meteorology and surface ozone during the TexAQS II field program and an evaluation of the NMM-CMAQ and WRF-Chem air quality models, J. Geophys. Res., 114, D00F14, doi:10.1029/2007JD009060, 2009.
Wojtal, P., Halla, J. D., and McLaren, R.: Pseudo steady states of HONO measured in the nocturnal marine boundary layer: a con-ceptual model for HONO formation on aqueous surfaces, At-mos. Chem. Phys., 11, 3243–3261, doi:10.5194/acp-11-3243-2011, 2011.
Wong, K. W., Oh, H.-J., Lefer, B. L., Rappengl¨uck, B., and Stutz, J.: Vertical profiles of nitrous acid in the nocturnal urban atmo-sphere of Houston, TX, Atmos. Chem. Phys., 11, 3595–3609, doi:10.5194/acp-11-3595-2011, 2011.
Wong, K. W., Tsai, C., Lefer, B., Haman, C., Grossberg, N., Brune, W. H., Ren, X., Luke, W., and Stutz, J.: Daytime HONO vertical gradients during SHARP 2009 in Houston, TX, Atmos. Chem. Phys., 12, 635–652, doi:10.5194/acp-12-635-2012, 2012.
Yu, Y., Galle, B., Panday, A., Hodson, E., Prinn, R., and Wang, S.: Observations of high rates of NO2-HONO conversion in the
noc-turnal atmospheric boundary layer in Kathmandu, Nepal, At-mos. Chem. Phys., 9, 6401–6415, doi:10.5194/acp-9-6401-2009, 2009.
Zhou, X. L., He, Y., Huang, G., Thornberry, T. D., Carroll, M. A., and Bertman, S. B.: Photochemical production of nitrous acid on glass sample manifold surfaces, Geophys. Res. Lett., 29, 1681, doi:10.1029/2002GL015080, 2002.
Zhou, X. L., Gao, H. L., He, Y., Huang, G., Bertman, S. B., Civerolo, K., and Schwab, J.: Nitric acid photolysis on surfaces in low-NOxenvironments: significant atmospheric implications,
Geophys. Res. Lett., 30, 2217, doi:10.1029/2003GL018620, 2003.