Distribution of Heavy Metals in the Different Parts of
Cerithidea Obtusa
and the Relationships
between Metal Distribution and Allometric Parameters of the Snail
Chee Kong YAP and Franklin Berandah EDWARD
Department of Biology, Faculty of Science, Universiti Putra Malaysia, UPM, 43400 Serdang, Selangor, Malaysia
Abstract
The intertidal gastropod, Cerithidea obtusa were obtained from Bako and Sematan (Sarawak) and Deralik (Perak).
Besides the shell, the snails were dissected into five different soft tissues. The soft tissues and the shell were then analysed for heavy metals. It was found that the highest concentrations of Cu (112 - 178 μg/g dw) and Zn (117 - 161 μg/g dw) were found in the tentacle; the highest concentrations of Cd (4.41 - 5.37 μg/g dw), Pb (53.2 - 63.8 μg/g dw) and Ni (26.1 - 27.9 μg/g dw) were found in the shell. On the other hand, the highest Fe concentrations (910 - 2921 μg/g dw) were found in the operculum. The Spearman’s correlation coefficient and multiple stepwise linear regression also revealed that the allometric parameters can influence the distribution of heavy metals in some of the different parts. From the present findings indicated that the heavy metals accumulated by the C. obtusa from the environment might affect its physical growth, which was shown by the negative correlations found between the metals in the different parts with the allometric parameters.
Keywords: Cerithidea obtuse; heavy metals; allometric parameters; different parts; cluster analysis; multivariate analysis The international journal published by the Thai Society of Higher Education Institutes on Environment
E
nvironment
A
sia
Available online at www.tshe.org/EAEnvironmentAsia 3(2) (2010) 38-48
1. Introduction
Inputs resulted from human activities often dete-riorate the health of ecosystems, although the effects of these input to the environment and their interac-tions on the individual ecosystem components remain unknown (O’Connor, 1996; Connell et al., 1999). The
stress–effect relationships are difficult to be determined in dynamic environments were natural and/or anthro-pogenic pressures are known to vary in space and time (Wilson, 2003). For example, estuarine systems, exhibit an extreme level of spatio-temporal variability in their physico-chemical characteristics. As a result, estuaries are regarded as highly complex and dynamic environments that are governed by a variety of natural and anthropogenic stress related gradients (O’Connor,
1996; Telesh, 2004; Elsdon and Gillanders, 2006). Mol-luscs that inhabit such an extreme environment must be capable of maintaining normal metabolic function de-spite the constant changes in their external environment (Verslycke et al., 2004). Generally, sublethal stress will induce compensatory changes in the organism’s energy
metabolism (Widdows and Donkin, 1991; De Coen and Janssen, 2003; Smolders et al., 2004b). Owing to the majority of the organism’s energy budget is used for
growth, reproduction and basal metabolism, an increase in energy consumption in the basal metabolism caused by stress will affect the animals’ condition, reducing its growth, reproduction potential and susceptibility to other stressors (De Coen and Janssen, 2003).
The study of heavy metal in the different parts of molluscs and relationships with their growth is therefore important, in order to know the accumulation of metal(s) by which tissue(s) that would influence the growth of the molluscs. It is already known that heavy metals can accumulate in tissues during molluscs growth (bioac-cumulation) and would disturb the normal metabolisms of the organism (Migliarini et al., 2005). For example, toxic effect of Cd can result in the injured cells dying by apoptosis or necrosis (Migliarini et al, 2005). Cells normally undergo apoptosis in response to mildly adverse conditions, while exposure to severe condi-tions (higher doses of the toxin) will result in necrosis (Migliarini et al., 2005). These two processes of cells dying definitely will adversely influence the growth of the molluscs.
Present study aims at determining the relationships between heavy metals in the different parts of C. obtusa
and their allometric parameters. In other words, it is to determine the accumulation of metal by which part(s) that would influence the allometric parameters of the snail.
2. Materials and Methods
A sampling was conducted in February 2006 at De-ralik (Perak) to collect the samples. As for the samples from Bako and Sematan (Sarawak), the snails were obtained on December 2006 from the local fishermen which they collected from the mangrove area nearby.
The sampling map and description of the sampling sites are shown in Fig. 1 and Table 1, respectively. The identification of the species were followed the descriptions by Lim et al. (2001). For the analysis, 30-40 individual of snails with almost a similar-size were randomly taken from the main sample and thawed at room temperature (26-29ºC) on a clean tissue paper. The soft tissues were then separated from the shell by crunching (using a clean pestle) the shell carefully. Due to the fragile characteristic of the shell, a mild force was sufficient to break the shell (strong force might destroy the internal organs of the snail). The soft tissues were then dissected and pooled into six different categories namely ceacum, foot, muscle, operculum, remainder, and tentacle besides the shell. The soft tissues and the shell were dried for 72 hours at 60ºC in an oven to constant dry weights (Yap et al., 2003a; 2003b). The methodology for measuring the shell width and shell height of the gastropod was based on those described by Ghesquiere (2005).
About 0.5 of the C. obtusa tissues were digested in 10 ml of concentrated nitric acid (AnalaR Grade;
69%). They were placed in a hot block digester first at low temperature (40ºC) for one hour and were then fully digested at high temperature (140ºC) for at least three hours. The digested samples were then diluted to a volume of 40ml with double distilled water (DDW). The sample was then filtered through Whatman No.1 filter paper (Dia: 110mm; Schleicher & Schuell, What-man International Ltd Maidstone England), then they were determined for Cd, Cu, Fe, Ni, Pb and Zn by using an air-acetylene flame Atomic Absorption Spectropho-tometer (AAS) Perkin Elmer Model AAnalyst 800. The samples were analyzed in three replicates. The data were presented in μg/g dry weight (dw) basis. Multi-level calibration standards were analysed to generate calibra-tion curves against which sample concentracalibra-tions were calculated. Standard solutions were prepared from 1000 mg/L stock solutions of each metal (Merck Titrisol).
All the glassware and plastic materials used were acid-washed in 10% concentrations of acid in order to minimize external contamination. Quality control samples made from standard solutions of Cu, Cd, Zn, Pb, Ni and Fe were analyzed once in every ten samples
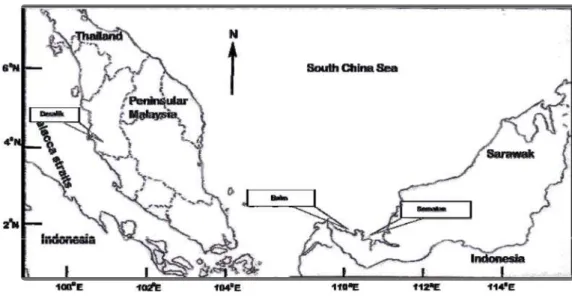
Figure 1. The sampling locations of Cerithidea obtusa from Bako and Sematan (Sarawak) and Deralik (Perak)
Table 1. The descriptions of the sampling locations and information on the Cerithidea obtusa collected.
No Location Sampling date GPS reading Site description
1. Deralik, Perak 25th February2006 N 04º 14’ 53.8”
E 100º 42’09.1”
1. Residental area 2. Mangrove area
3. No direct pollution found
2. Bako, Sarawak 28th December2006 N 01º40’23.36’’
E 110º 25’54.46’’
1. Mangrove areas 2. Fishing village 3. Tourism spot
3. Sematan, Sarawak 28th December2006 N 01º 48’12.61’’
E 109º 46’45.65’’
1. Intertidal area 2. Fishing village 3. Jetty
to check for the metal recoveries. The analytical pro-cedures for the snail samples were checked with the Certified Reference Material (CRM) and the recoveries of all metal were satisfactory (Table 2).
For the statistical analysis, the distributions of heavy metals in the different parts were determined by using cluster analysis. The relationships between the heavy metals in the different parts and allometric parameters were analyzed using Spearman’s correla-tion coefficient. Multiple stepwise linear regression was used to determine the influence of heavy metal in the different parts towards the allometric parameters. All data were log10 (X + 1) transformed prior to the statistical analysis. SPSS 12.0 was used to conduct the correlation and multiple stepwise linear regression analyses while STATISTICA 99 edition was used to conduct the cluster analysis.
3. Results
3.1. Distribution of heavy metal in the different parts
Heavy metal concentrations in the different parts of the C. obtusa collected from the three sampling sites are shown in Table 4. In general, it was found that the tentacle of the gastropods were highly accumulative
of Cu and Zn as shown by the gastropods from all the sites, where they ranged from 112 - 178 μg/g dw and 117 - 161 μg/g dw, respectively. Meanwhile, the oper-culums were mostly accumulative of Fe, as shown by the gastropods from Bako and Sematan, where they ranged from 638 - 2921 μg/g dw. On the other hand, the shell was highly accumulative of Cd (4.41 - 5.37 μg/g dw), Pb (53.2 - 63.8 μg/g dw) and Ni (24.4 - 27.9 μg/g dw). The ranges of the allometric parameters of the C. obtusa are shown in Table 3.
3.2. Relationships between the heavy metals and al-lometric parameters
The correlations between the heavy metal concen-trations between the different parts of the C. obtusa and their allometric parameters are shown by the Spear-man’s correlation coefficients in Table 5. It is found that the accumulation of some metals by the different parts were positively and also negatively correlated with the allometric parameters studied. However, the relationships which were focused upon in the present study were the negative relationships between the metal concentrations in the different parts with the allometric parameters. The outcome of negative correlation coef-ficients formed was due to the fact that any increment in Table 2. Analytical results for the Certified Reference Material (CRM) and its certified values for each metal (μg/g dry weight).
Metal Sample CRM values Measured values Percentage of
recovery
Cd DOLT-3 Dogfish-liver 19.4 ± 0.600 20.5 ± 0.439 106 ± 2.26
Cu DOLT-3 Dogfish-liver 31.2 ± 1.00 26.5 ± 2.58 85.0 ± 8.28
Fe DOLT-3 Dogfish-liver 1484 ± 57.0 1070 72.1
Ni DOLT-3 Dogfish-liver 2.72 ± 0.350 2.77 ± 0.741 102 ± 27.2
Zn DOLT-3 Dogfish-liver 86.6 ± 2.40 80.9 ± 1.94 93.4 ± 2.24
Note: Pb is not available.
Table 3. Ranges of allometric parameters [shell height, shell width, shell volume, soft tissue dry weight (STDW) and Condi-tion index (CI)] of the Cerithidea obtusa.
Site Shell
height, mm
Shell width, mm
Shell
volume, cm3
STDW, g CI, g/cm3
1. Bako, Sarawak 28.5 – 43.8 13.4 – 20.8 1.46 – 4.96 0.117 - 0.571 57.4 - 141
2. Sematan, Sarawak 23.0 – 43.7 12.8 – 23.0 1.36 – 5.92 0.081 – 0.596 46.0 – 125
3. Deralik, Sitiawan 33.3 – 52.0 14.0 – 27.0 1.75 – 9.93 0.160 – 1.21 69.1 - 143
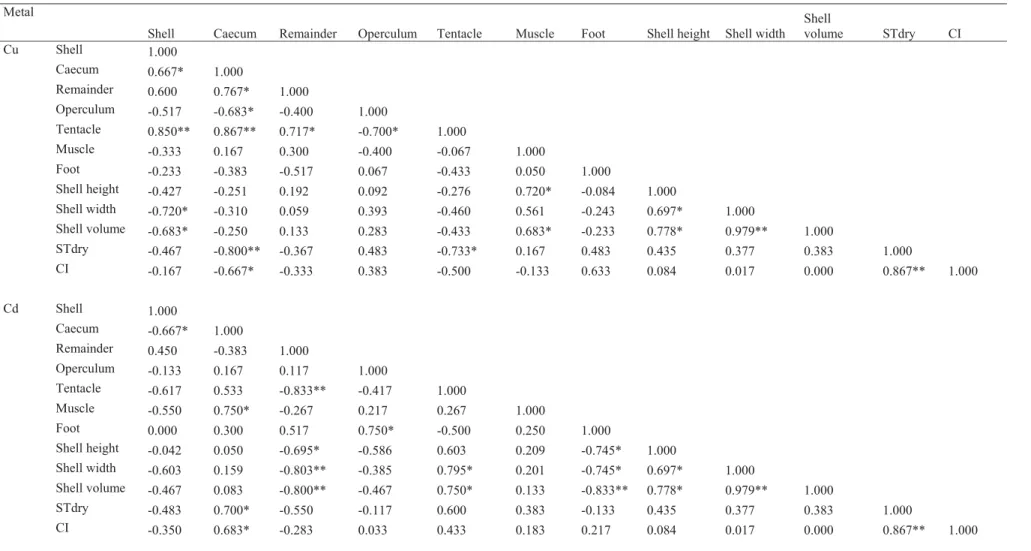
the metal concentrations in the different parts will cause decrement in the values of the allometric parameters. In other words, high metal concentrations accumulated by the gastropod may retard/alter it physical growths. Negative correlations are found between the Cu in the shell with the shell width (P<0.05; R=-0.720) and shell volume (P<0.05; R=-0.683). Negative correlations are also found between Cu-caecum versus (vs) soft tissues (ST) dry weight (P<0.05; R=-0.800); Cu- tentacle vs ST dry weight (P<0.05; R=-0.733). Significant negative correlations are also found between Cd-remainder vs shell height (P<0.05; R=-0.695), shell width (P<0.01; R=-0.803) and shell volume (P < 0.01; R=-0.800).
In the mean time, Cd accumulation by the foot are negatively correlated with the shell height (P<0.05; R=-0.745); shell width (P<0.05; R=-0.745) and shell volume (P<0.01; R=-0.833). In the literature, the re-lationships of heavy metals and growth rate were also being reported in gastropods Nucella lapillus of Loch Fyne, where individuals accumulated relatively high heavy metals have lower growth rates (Leung et al., 2001), therefore, the correlations above are in agreement with those reported in the gastropod, N.lapillus.
Similarly for Ni, significant negative correlations are found between Ni-caecum vs shell width (P<0.05; R=-0.787) and shell volume (P<0.05; R=-0.700).
Table 4. Heavy metal concentrations (μg/g dw, mean±SE) of (Cu, Cd, Zn, Pb, Ni and Fe) in the different soft tissues of Cerithidea obtusa collected from Bako, Sematan and Deralik.
Site Cu Cd Zn Pb Ni Fe
Caecum Bako, 95.3 ± 15.8 1.79 ± 0.185 113 ± 18.3 10.0 ± 0.193 9.44 ± 0.207 782 ± 86.2
Sarawak
Sematan, 94.7 ± 2.61 1.43 ± 0.086 113 ± 10.6 7.94 ± 0.433 9.26 ± 0.530 543 ± 47.9
Sarawak
Deralik, 51.1 ± 1.77 3.45 ± 0.169 318 ± 5.67 6.2 ± 1.00 7.54 ± 0.350 661 ± 71.9
Perak
Foot Bako, 118 ± 4.21 1.48 ± 0.071 74.4 ± 8.77 5.94 ± 0.234 2.80 ± 0.192 177 ± 15.9
Sarawak
Sematan, 113 ± 11.3 0.984 ± 0.096 97.7 ± 2.67 5.10 ± 0.606 3.58 ± 0.269 121 ± 4.07
Sarawak
Deralik, 124 ± 9.36 1.22 ± 0.115 113 ± 0.183 14.0 ± 0.553 5.79 ± 0.615 255 ± 3.47
Perak
Muscle Bako, 64.8 ± 7.72 1.16 ± 0.111 82.4 ± 6.21 5.88 ± 0.434 0.660 ± 0.086 156 ± 12.1
Sarawak
Sematan, 83.4 ± 3.79 0.901 ± 0.141 92.4 ± 3.30 4.12 ± 0.178 3.33 ± 0.539 124 ± 10.0
Sarawak
Deralik, 77.3 ± 0.526 1.39 ± 0.075 79.0 ± 1.57 13.7 ± 0.548 5.08 ± 0.137 254 ± 5.11
Perak
Operculum Bako, 51.7 ± 0.000 2.78 ± 0.000 43.9 ± 0.000 9.45 ± 0.000 0.222 ± 0.000 2921 ± 0.000
Sarawak
Sematan, 44.7 ± 0.000 2.13 ± 0.000 45.0 ± 0.000 7.50 ± 0.000 3.47 ± 0.000 910 ± 0.000
Sarawak
Deralik, 59.1 ± 0.000 2.46 ± 0.000 38.9 ± 0.000 43.0 ± 0.000 7.22 ± 0.000 638 ± 0.000
Perak
Remainder Bako, 136 ± 13.4 1.54 ±0.202 65.0 ± 5.06 10.7 ± 1.86 6.54 ± 0.848 850 ± 60.8
Sarawak
Sematan, 143 ± 3.25 1.35 ± 0.158 77.5 ± 1.89 7.62 ± 0.550 6.37 ± 0.253 406 ± 29.6
Sarawak
Deralik, 133 ± 2.51 1.17 ± 0.144 81.1 ± 5.29 17.2 ± 1.71 6.22 ± 0.052 1137 ± 123
Perak
Shell Bako, 11.9 ± 0.794 5.12 ± 0.047 5.91 ± 0.255 56.2 ± 1.43 26.1 ± 0.909 240 ± 48.9
Sarawak
Sematan, 11.1 ± 0.750 5.37 ± 0.205 7.04 ± 0.647 53.2 ± 0.483 27.9 ± 0.295 66.3 ± 4.95
Sarawak
Deralik, 8.65 ± 0.503 4.41 ± 0.118 6.53 ± 1.39 63.8 ± 0.318 24.4 ± 0.143 52.0 ± 2.35
Perak
Tentacle Bako, 178 ± 0.000 0.962 ± 0.000 117 ± 0.000 5.70 ± 0.000 20.1 ± 0.000 240 ± 0.000
Sarawak
Sematan, 173 ± 0.000 1.36 ± 0.000 130 ± 0.000 4.54 ± 0.000 16.2 ± 0.000 177 ± 0.000
Sarawak
Deralik, 112 ± 0.000 2.32 ± 0.000 161 ± 0.000 34.2 ± 0.000 27.9 ± 0.000 283 ± 0.000
Perak
Table 5. Spearman’s correlation coefficient between Cu concentrations in the different parts of Cerithidea obtusa and their allometric parameter.
Metal
Shell Caecum Remainder Operculum Tentacle Muscle Foot Shell height Shell width
Shell
volume STdry CI
Cu Shell 1.000
Caecum 0.667* 1.000
Remainder 0.600 0.767* 1.000
Operculum -0.517 -0.683* -0.400 1.000
Tentacle 0.850** 0.867** 0.717* -0.700* 1.000
Muscle -0.333 0.167 0.300 -0.400 -0.067 1.000
Foot -0.233 -0.383 -0.517 0.067 -0.433 0.050 1.000
Shell height -0.427 -0.251 0.192 0.092 -0.276 0.720* -0.084 1.000
Shell width -0.720* -0.310 0.059 0.393 -0.460 0.561 -0.243 0.697* 1.000
Shell volume -0.683* -0.250 0.133 0.283 -0.433 0.683* -0.233 0.778* 0.979** 1.000
STdry -0.467 -0.800** -0.367 0.483 -0.733* 0.167 0.483 0.435 0.377 0.383 1.000
CI -0.167 -0.667* -0.333 0.383 -0.500 -0.133 0.633 0.084 0.017 0.000 0.867** 1.000
Cd Shell 1.000
Caecum -0.667* 1.000
Remainder 0.450 -0.383 1.000
Operculum -0.133 0.167 0.117 1.000
Tentacle -0.617 0.533 -0.833** -0.417 1.000
Muscle -0.550 0.750* -0.267 0.217 0.267 1.000
Foot 0.000 0.300 0.517 0.750* -0.500 0.250 1.000
Shell height -0.042 0.050 -0.695* -0.586 0.603 0.209 -0.745* 1.000
Shell width -0.603 0.159 -0.803** -0.385 0.795* 0.201 -0.745* 0.697* 1.000
Shell volume -0.467 0.083 -0.800** -0.467 0.750* 0.133 -0.833** 0.778* 0.979** 1.000
STdry -0.483 0.700* -0.550 -0.117 0.600 0.383 -0.133 0.435 0.377 0.383 1.000
CI -0.350 0.683* -0.283 0.033 0.433 0.183 0.217 0.084 0.017 0.000 0.867** 1.000
C. K. Y
AP
et al. / Envir
Zn Shell 1.000
Caecum -0.450 1.000
Remainder 0.367 0.500 1.000
Operculum 0.333 -0.800** -0.267 1.000
Tentacle 0.050 0.617 0.850** -0.367 1.000
Musscle 0.083 -0.267 -0.200 0.567 -0.267 1.000
Foot 0.033 0.583 0.733* -0.483 0.900** -0.233 1.000
Shell height 0.109 0.326 0.569 -0.159 0.603 -0.209 0.728* 1.000
Shell width 0.109 0.318 0.636 -0.259 0.795* -0.167 0.921** 0.697* 1.000
Shell volume 0.133 0.267 0.583 -0.167 0.750* -0.067 0.900** 0.778* 0.979** 1.000
Stdry -0.550 0.717* 0.300 -0.500 0.600 -0.133 0.633 0.435 0.377 0.383 1.000
CI -0.417 0.550 0.217 -0.350 0.433 -0.100 0.333 0.084 0.017 0.000 0.867** 1.000
Pb Shell 1.000
Caecum 0.949** 1.000
Remainder 0.812** 0.812** 1.000
Operculum 0.602 0.602 0.483 1.000
Tentacle 0.534 0.534 0.449 0.916** 1.000
Muscle 0.402 0.402 0.590 0.788* 0.856** 1.000
Foot 0.436 0.436 0.521 0.720* 0.788* 0.932** 1.000
Shell height 0.369 0.369 0.411 0.290 0.525 0.360 0.191 1.000
Shell width 0.331 0.314 0.449 0.525 0.786* 0.771* 0.670* 0.697* 1.000
Shell volume 0.253 0.253 0.388 0.460 0.728* 0.692* 0.557 0.778* 0.979** 1.000
STdry 0.549 0.430 0.515 0.619 0.552 0.582 0.549 0.435 0.377 0.383 1.000
CI 0.380 0.295 0.262 0.477 0.343 0.397 0.498 0.084 0.017 0.000 0.867** 1.000
C. K. Y
AP
et al. / Envir
Operculum -0.217 -0.783* -0.450 1.000
Tentacle -0.667* -0.733* -0.400 0.550 1.000
Muscle -0.333 -0.700* -0.383 0.900** 0.450 1.000
Foot -0.267 -0.617 -0.383 0.883** 0.433 0.967** 1.000
Shellheight 0.243 -0.310 -0.151 0.770* 0.092 0.636 0.678* 1.000
Shellwidth -0.159 -0.787* -0.360 0.895** 0.393 0.695* 0.695* 0.697* 1.000
Shellvolume -0.017 -.700* -0.317 0.883** 0.283 0.667* 0.650 0.778* 0.979** 1.000
STdry -0.483 -.633 -0.133 0.633 0.483 0.717* 0.583 0.435 0.377 0.383 1.000
CI -0.533 -.433 -0.183 0.333 0.383 0.583 0.433 0.084 0.017 0.000 0.867** 1.000
Fe Shell 1.000
Caecum 0.233 1.000
Remainder -0.517 0.517 1.000
Operculum 0.867** 0.300 -0.417 1.000
Tentacle -0.450 0.350 0.867** -0.417 1.000
Muscle -0.533 0.167 0.800** -0.583 0.833** 1.000
Foot -0.483 0.350 0.900** -0.483 0.833** 0.950** 1.000
Shell height -0.828** -0.310 0.142 -0.603 0.025 0.033 -0.017 1.000
Shell width -0.778* -0.209 0.343 -0.795* 0.310 0.251 0.176 0.697* 1.000
Shell volume -0.767* -0.317 0.217 -0.750* 0.217 0.133 0.033 0.778* 0.979** 1.000
STdry -0.567 0.167 0.383 -0.600 0.550 0.450 0.383 0.435 0.377 0.383 1.000
CI -0.250 0.233 0.283 -0.433 0.417 0.433 0.400 0.084 0.017 0.000 0.867** 1.000
* Correlation is significant at the 0.05 level (2-tailed); ** Correlation is significant at the 0.01 level (2-tailed); N=9; ST dry= soft tissue dry weight; CI=condition index
Ni Shell 1.000
Caecum 0.683* 1.000
Remainder -0.117 0.333 1.000
C. K. Y
AP
et al. / Envir
Accumulation of Fe by some of the different parts too, could cause decrement in some of the allometric parameters as shown by Fe-shell vs shell height (P < 0.01; R=-0.828), shell width (P<0.05; R=-0.778) and shell volume (P<0.05; R=-0.767); and Fe-operculum vs shell width (P<0.05; R=-0.795) and shell volume (P<0.05; R=-0.750). The negative correlation found could also be due to the reasons which were being discussed in the previous paragraph.
4. Discussion
4.1. Distribution of heavy metal in the different parts
The differential affinities of the metals to the bind-ing sites might be associated with the different metal concentrations found in the different tissues. The high level of a metal found in a particular tissue could be due to the metal being tightly bound to the metallothi-onein as was reported by Viarengo et al. (1985) and Roesijadi (1992) in mussel. The formation of a metal-thiolate complex with the cysteine residues inside the lysosomes caused the slower depuration of the metals found in the different tissues (Yap et al., 2003c) which could result in high levels of metals being found in the mentioned tissues. This mechanism would reduce a metal’s toxicity by preventing it from disturbing the cell activities (Webb, 1987).
The accumulation of metals in the different tissues mentioned could also be related to the functions of the organs. The tentacle which are in contact with the external medium and are considered responsible for the metal transfer to the organism. This indicated that the differences in the surface of contact of the differ-ent soft tissues may affect the accumulation of metals by the gastropods tissues (Yap et al., 2003c). Besides, different rates of accumulation and excretion of metals in the different tissues could also result in the different concentrations found in each of the tissues of molluscs analyzed (Yap et al., 2003c).
4.2. Relationships between the heavy metals and al-lometric parameters
It is known that growth performance of marine or-ganisms depends on many environmental factors such as temperature, bottom types (rocks, sands, pebbles, silts, and etc), oxygen availability, salinity, etc (Belcheva
et al., 2006). The growth performance of the marine organisms in the heavy metals polluted area is limited by some of these environmental factors which put the organisms into a lower metabolic state and therefore, affecting their growth rate thus lowering the values of allometric parameters. In the oyster Crassostrea gigas
which has been introduced to two areas with different levels of pollution indicated the reverse relationship between Cd concentration and body size (Boyden and Phillips, 1981; Belcheva et al., 2006), indicated that the Cd accumulation influenced the body size of the oyster.
No significant correlations (P>0.05) were observed between the accumulation of Zn and Pb by the different parts with the allometric parameters. This may indicate that accumulation of the two metals by the different parts would not cause decrement in the allometric pa-rameters which was in contrast with those reported by Gifford et al. (2006) where they reported significant re-ductions in total oyster growth when they were exposed to high concentrations of Zn and Pb. The result could indicate that the C. obtusa were tolerant with Zn and Pb contaminants and have regulative mechanisms for these two metals. However, in normal circumstances, the higher allometric parameters could also influence lower accumulation of heavy metals in the snail (Larger/ adult individual accumulate lower concentrations of metal than smaller/young individual). Therefore, future laboratory study should focus on the levels of metal that would influence the allometric parameter(s).
On the other hand, the relationships between the allometric parameters with the heavy metal concentra-tions in the different soft tissues indicated two different phenomena: 1) The higher metal concentrations in the different tissues could cause a decrement in the values of allometric parameters. 2) The larger allometric pa-rameters could cause a lower metal accumulation in the different tissues of the snails. From ecotoxicologi-cal points of view, the first phenomena seems to be of much concern. This is due to higher metal accumulated in the tissues could cause a lower growth rate and subsequently a lower values of the shell length, shell width and ST dry weight of the gastropods. However, the second phenomena is explainable when the snails are able to grow up to the adult size provided that the heavy metal pollution is not a major factor in influencing the growth rate of the snails. Therefore, the snails can grow to a maximum size range. The second phenom-ena can also be explained by the lower growth rate in the larger sized group and lower total surface area per volume in the larger sized group. These two factors could potentially cause a lower metal accumulation in the larger sized group.
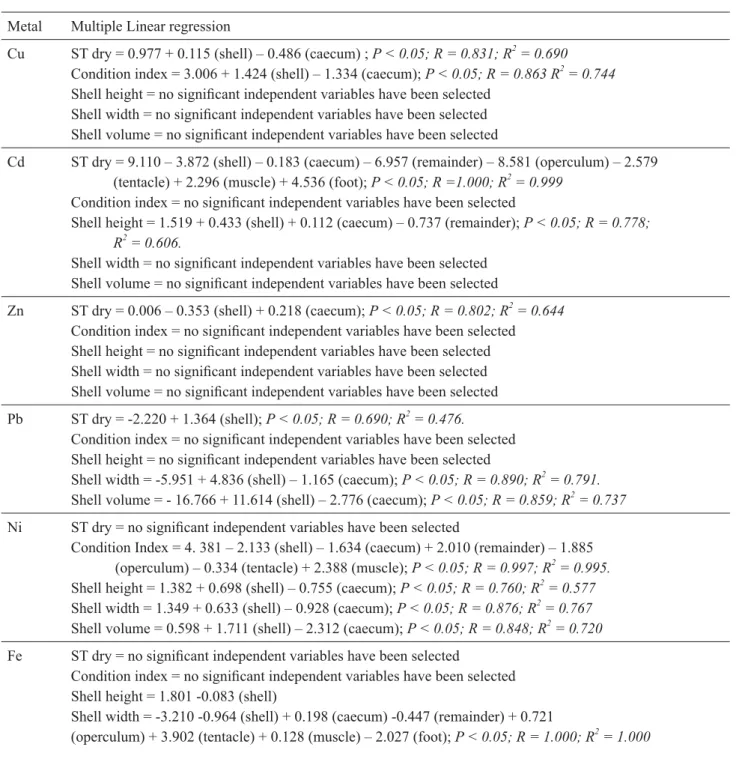
Table 6. Stepwise linear regression between the allometric parameters and heavy metal distributions of the Cerithidea obtusa
Metal Multiple Linear regression
Cu ST dry = 0.977 + 0.115 (shell) – 0.486 (caecum) ; P < 0.05; R = 0.831; R2 = 0.690
Condition index = 3.006 + 1.424 (shell) – 1.334 (caecum); P < 0.05; R = 0.863 R2 = 0.744 Shell height = no significant independent variables have been selected
Shell width = no significant independent variables have been selected Shell volume = no significant independent variables have been selected
Cd ST dry = 9.110 – 3.872 (shell) – 0.183 (caecum) – 6.957 (remainder) – 8.581 (operculum) – 2.579
(tentacle) + 2.296 (muscle) + 4.536 (foot); P < 0.05; R =1.000; R2 = 0.999 Condition index = no significant independent variables have been selected
Shell height = 1.519 + 0.433 (shell) + 0.112 (caecum) – 0.737 (remainder); P < 0.05; R = 0.778; R2 = 0.606.
Shell width = no significant independent variables have been selected Shell volume = no significant independent variables have been selected
Zn ST dry = 0.006 – 0.353 (shell) + 0.218 (caecum); P < 0.05; R = 0.802; R2 = 0.644
Condition index = no significant independent variables have been selected Shell height = no significant independent variables have been selected Shell width = no significant independent variables have been selected Shell volume = no significant independent variables have been selected
Pb ST dry = -2.220 + 1.364 (shell); P < 0.05; R = 0.690; R2 = 0.476.
Condition index = no significant independent variables have been selected Shell height = no significant independent variables have been selected
Shell width = -5.951 + 4.836 (shell) – 1.165 (caecum); P < 0.05; R = 0.890; R2 = 0.791. Shell volume = - 16.766 + 11.614 (shell) – 2.776 (caecum); P < 0.05; R = 0.859; R2 = 0.737
Ni ST dry = no significant independent variables have been selected
Condition Index = 4. 381 – 2.133 (shell) – 1.634 (caecum) + 2.010 (remainder) – 1.885 (operculum) – 0.334 (tentacle) + 2.388 (muscle); P < 0.05; R = 0.997; R2 = 0.995. Shell height = 1.382 + 0.698 (shell) – 0.755 (caecum); P < 0.05; R = 0.760; R2 = 0.577 Shell width = 1.349 + 0.633 (shell) – 0.928 (caecum); P < 0.05; R = 0.876; R2 = 0.767 Shell volume = 0.598 + 1.711 (shell) – 2.312 (caecum); P < 0.05; R = 0.848; R2 = 0.720
Fe ST dry = no significant independent variables have been selected
Condition index = no significant independent variables have been selected Shell height = 1.801 -0.083 (shell)
Shell width = -3.210 -0.964 (shell) + 0.198 (caecum) -0.447 (remainder) + 0.721
(operculum) + 3.902 (tentacle) + 0.128 (muscle) – 2.027 (foot); P < 0.05; R = 1.000; R2 = 1.000
Shell volume = no significant independent variables have been selected Note: ST dry = Soft tissue dry weight
generally, it was found that the accumulation of metals (Cu, Zn, Pb and Ni) by the shells and caecums signifi-cantly influenced most of the allometric parameters such as ST dry weight and condition index for Cu; ST dry weight for Zn; shell width and shell volume for Pb; and shell height, shell width and shell volume for Ni. On the other hand, the accumulations of Cd and Fe by the shell, caecum, remainder, operculum, tentacle, muscle
and foot significantly influenced the ST dry weight and shell width, respectively. In the mean time, the accumu-lation of Ni by the shell, caecum, remainder, operculum, tentacle and muscle significantly (P<0.05) influenced the condition index of gastropods. These relationships indicated that different allometric parameters of C. obtusa are significantly influenced by different metals in the different tissues of the snails.
5. Conclusions
Present study found that the tentacle of C. obtusa was highly accumulative of Cu and Zn; while the operculum was highly accumulative of Fe. The shell meanwhile was accumulative of metals such as Cd, Pb and Ni. From the negative Spearman’s correlation coefficient and stepwise linear regression, it was found that accumulation of heavy metals by the different parts of C. obtusa were significantly influenced most of the allometric parameters. This preliminary study revealed that the metal concentrations in the different parts are important factors that could influence the allometric parameters of the C. obtusa.
Acknowledgement
The authors wish to acknowledge the financial support provided through the Research University Grant Scheme (RUGS), [Vote no.: 91229], by Universiti Putra Malaysia and e-Science Fund [Vote no.: 5450338], by the Ministry of Science, Technology and Innovation, Malaysia.
References
Belcheva NN, Zakhartsev M, Alla V, Silina AV, Slinko EN, Chelomin VP. Relationship between shell weight and cadmium content in whole digestive gland of the Japanese scallop Patinopecten yessoensis (Jay). Marine
Environmental Research 2006; 61: 396–409.
Boyden CR, Phillips DJH. Seasonal variation and inherent variability of trace elements in oysters and their implica- tions for indicator studies. Marine Ecology Progress Series 1981; 5: 29–40.
Connell D, Lam P, Richardson B, Wu R. Introduction to ecotoxicology. Oxford: Blackwell Science; 1999. 170. De Coen WM, Janssen CR. The missing biomarker link:
relationships between effects on the cellular energy allocation biomarker of toxicant-stressed Daphnia magna and corresponding population characteris- tics. Environmental Toxicology and Chemistry 2003;
22: 1632–41.
Elsdon TS, Gillanders BM. Temporal variability in strontium, calcium, barium, and manganese in estuaries: implica- tions for reconstructing environmental histories of fish from chemicals in calcified structures. Estuarine, Coastal and Shelf Science 2006; 66: 147–56.
Gifford SP, Macfarlane GR, O’Connor WA, Dunstan RH. Effect of the pollutants lead, zinc, hexadecane and octocosane on total growth and shell growth in the Akoya
Pearl Oyster, Pinctada imbricata. 2006; 25(1): 159-65.
Leung KMY, Morgan IJ, Rudolf S SW, Lau TC, Svavarsson J, Furness RW. Growth rate as a factor confounding the use of the dogwhelk Nucella lapillus as biomonitor of heavy metal contamination. Marine Ecology Progress Series 2001; 221: 145–59.
Lim KKP, Murphy DH, Morgany T, Sivasothi N, Ng PKL, Soong BC, Tan HTW, Tan KS, Tan TK. Volume 1: The Ecosystem and Plant Diversity and Volume 2: Animal Diversity. In A Guide to angroves of Singapore,
(Eds. P.K.L. Ng, N. Sivasothi). BP Guide to Nature
Series published by the Singapore Science Centre 2001, sponsored by British Petroleum. Singapore: Raffles Museum of Biodiversity Research, The National Uni- versity of Singapore & The Singapore Science Centre. Migliarini B, Campisi AM, Maradonna F, Truzzi C, Annibaldi A, Scarponi G, Carnevali O. Effects of cadmium exposure on testis apoptosis in the marine teleost Gobius niger. General and Comparative Endocrinology 2005;
142: 241-47
O’Connor RJ. Toward the incorporation of spatiotemporal
dynamics into ecotoxicology. In: Rhodes OE, Chesser RK, Smith MH, editors. Population dynamics in eco- logical space and time. Chicago: University of Chicago Press 1996; 281–317.
Roesijadi G. Metallothionein in metal regulation and toxicity in aquatic animals, Aquatic Toxicology 1992; 22: 81–113.
Smolders R, Bervoets L, De Coen W, Blust R. Cellular energy allocation in zebra mussels exposed along a pollution gradient: linking cellular effects to higher levels of biological organization. Environmental Pollu- tion 2004; 129: 99–112.
Ghesquiere SAI. Applesnails. www.applesnail.net. Retrieved
February 2007.
Telesh IV. Plankton of the Baltic estuarine ecosystems with emphasis on Neva Estuary: a review of present know- ledge and research perspectives. Marine Pollution Bul- letin 2004; 49: 206–19.
Verslycke T, Ghekiere A, Janssen CR. Seasonal and spatial patterns in cellular energy allocation in the estuarine mysid Neomysis integer (Crustacea: Mysidacea) of the Scheldt estuary (The Netherlands). Journal of Experi- mental Marine Biology and Ecology 2004; 306: 245–67.
Vierengo A, Palmero S, Zanicchi G, Capelli R, Vaissiere R, Orunesu M. Role of metallothioneins in Cu and Cd accu- mulation and elimination in the gill and digestive gland cells of Mytilus galloprovincialis (Lam.), Marine Envi-
ronmental Research 1985 ; 16: 23-36.
Webb M. Toxicological significance of metallothionein. Experientia Supplement 1987; 52: 109–34.
Widdows J, Donkin P. Role of physiological energetics in ecotoxicology. Comparative Biochemistry and Physi- ology - Part C: Toxicology & Pharmacology 1991; 100: 69–75.
Wilson JG. Evaluation of estuarine quality status at system level with the Biological Quality Index and the Pol- lution Load Index. Biology and Environment 2003;
103B: 49–57.
Yap CK, Ismail A, Omar H, Tan SG. Accumulation, depura- tion and distribution of cadmium and Zinc in the green- lipped mussel Perna viridis (L) under Laboratory condi-
Yap CK, Ismail A, Tan SG. Different soft tissues of the green- lipped mussel Perna viridis (L.). as biomonitoring agent of copper: Field and laboratory studies. Malaysia’s Application in Biology 2003a; 32(2): 9-18.
Yap CK, Ismail A, Tan SG. Background concentrations of
Cd, Cu, Pb and Zn in the green-lipped mussel Perna
viridis (Linnaeus) from Peninsular Malaysia. Marine Pollution Bulletin 2003b; 46: 1035-48.
Received 2 June 2010 Accepted 30 June 2010
Correspondence to
Chee Kong YAP Department of Biology, Faculty of Science, Universiti Putra Malaysia, UPM, 43400 Serdang, Selangor,
Malaysia.
Tel: 603-89466616 Fax: 603-86567454
Email: [email protected]
![Table 3. Ranges of allometric parameters [shell height, shell width, shell volume, soft tissue dry weight (STDW) and Condi- Condi-tion index (CI)] of the Cerithidea obtusa .](https://thumb-eu.123doks.com/thumbv2/123dok_br/16360022.190177/3.892.83.813.149.365/table-ranges-allometric-parameters-condi-condi-cerithidea-obtusa.webp)