International Journal for Quality research UDK- 005.311.6
Original Scientific Paper (1.01)
Prasun Das¹
¹ SQC & OR Division Indian Statistical Institute
203, B. T. Road Kolkata 700 108, West Bengal,
India
SELECTION OF BUSINESS STRATEGIES FOR QUALITY
IMPROVEMENT USING FUZZY ANALYTICAL
HIERARCHY PROCESS
Abstract: Fuzzy linguistic concepts are often used to enhance the traditional analytic hierarchy process (AHP) in capturing the fuzziness and subjectiveness of decision makers’ judgments. In this paper, fuzzy AHP methodology is adopted for selection of the strategies for business improvement in an Indian industry as a decision making problem. Due to simplicity and effectiveness, triangular fuzzy numbers are adopted as a reference to indicate the influence strength of each element in the hierarchy structure. The confidence level and the optimistic levels of multiple decision makers are captured by using -cut based fuzzy number methods. This fuzzy set theory based multi-attribute decision making method is found to be quite useful and effective in industrial environment.
Keywords: Decision making, Analytic hierarchy process, Fuzzy AHP, Fuzzy PCM, Fuzzy extent analysis, -cut-based method, Ranking
1.
INTRODUCTION
In any decision making process, since human perceptions and judgments are involved and are dynamic in nature, it calls for rational and structural approach towards solution (Saaty, 2000). Various techniques are being used for decision making and its improvement out of which the Analytic Hierarchy Process (AHP) is one of the most widely used multi-attribute decision making methods (Chen, 1992; Saaty, 1994, Saaty and Vargas, 2006, Saaty, 2008, Bhusan and Ria, 2004). This technique essentially involves developing of a set of alternatives and a common set of objectives (Saaty, 2000). The selection of the most appropriate alternative depends upon its ability to the maximum fulfillment of the objectives set. However, AHP experiences difficulty in capturing uncertain and imprecise judgment of domain experts. This may be caused by lack of experimental information and other uncontrollable factors. A variant of AHP, called Fuzzy AHP, comes into implementation in order to overcome the compensatory approach and the inability of the AHP in handling linguistic variables.
In one of the earliest works of fuzzy AHP, van Laarhoven and Pedrycz (1983) judge the fuzzy comparison scales represented by triangular fuzzy numbers whereas, in another work, fuzzy priorities of comparison ratios are determined by trapezoidal membership functions (Buckley, 1985). Stam et al. (1996) use artificial intelligence techniques to determine the preference ratings in AHP.Chang (1996) introduces a new approach for handling pair-wise comparison scale based on triangular fuzzy numbers followed by use of extent analysis method for synthetic extent value of the pairwise comparison (Chang, 1992). Cheng (1997) proposes a new algorithm for evaluating naval tactical missile systems by the fuzzy Analytical Hierarchy
Process based on performance score of membership function. Weck et al. (1997) present a method to evaluating different production cycle alternatives using mathematics of fuzzy logic to the classical AHP. Kahraman et al. (1998) use a fuzzy AHP approach to select the best supplier firm providing the most satisfaction for the criteria determined through questionnaire.Zhu et al. (1999) focuses on fuzzy extent analysis and applications of fuzzy AHP process.Cheng et al. (1999) propose a new method for evaluating weapon systems by AHP based on weights of the linguistic variables. Many applications related to food, catering service and related customer satisfaction using fuzzy AHP do exist (Martinez-Tome et al., 2000; Creed, 2001; Jansen et al., 2001; Cebeci, 2001; Cebeci and Kahraman, 2002; Kahraman et al., 2004). Yu (2002) presents a group decision-making fuzzy AHP problem using a linearization and fuzzy rating techniques. Yang (2003) introduces a decision making approach based on fuzzy synthetic evaluation. Tolga et al. (2005) develops fuzzy replacement analysis, based on the economic aspect of technology selection, for creating an operating system selection framework for decision makers. A good amount of literatures on theory and applications of fuzzy multi-criteria decision making is available in Kahraman, 2008.
to fulfill the objective of the study. The outcome of the study is discussed in Section 4 and the paper in concluded inSection 5.
2. FUZZY AHP: GENERAL
DESCRIPTION
As discussed earlier, inabilities of classical AHP to deal with the imprecise and subjective knowledge in the pair-wise comparison process have been rectified and improved in fuzzy-AHP methodology. Instead of a single crisp score, fuzzy-AHP uses a range of values to incorporate decision maker’s uncertainty into the model. The details of fuzzy AHP process are described in many books (Saaty, 2005; Saaty and Vargas, 2000). The following subsections provide a general description of fuzzy numbers and fuzzy AHP methodology in steps.
2.1 Fuzzy Membership Function:
Triangular Fuzzy Number
The Fuzzy AHP presented in this study applies the triangular fuzzy number through symmetric triangular membership function. A triangular fuzzy number ãis the special class of fuzzy number whose membership is
defined by three real numbers, expressed asã= (aL;aM; aU). According toTae-heon Moon (1999), a triangular fuzzy numberã is represented as shown inFigure 1.
Fig-1. Fuzzy triangular number
There are various fuzzy mathematical operations on triangular fuzzy numbers like addition, subtraction, multiplication, division and reciprocity. These operations will be valid provided given the lower bounds of both the triangular fuzzy numbers are positive.
2.2 Process Mapping: fuzzy AHP
The steps in carrying out Fuzzy AHP procedure are shown inFigure 2. The details of basic four stages of fuzzy AHP are described in subsequent subsections.
Fig-2. Steps of Fuzzy AHP analysis
Method/Production/Operation o Number of defective product o Average production cost per item Marketing/Purchase/Store
o Sales growth
o Average inventory cost o Profitability
R&D and Others o Employee survey o Elutriation rate Maintenance and Safety o Overall Plant reliability o Expected rate of failure of
3.1 Qualitative Assessment: Questionnaire
survey
The objective of this qualitative assessment is to find out the crisp PCM necessary for fuzzy conversion and the corresponding fuzzy analysis. On the basis of current organization structure and information flow, ten key decision making personnel, including departmental Heads are identified from various departments for questionnaire survey.
A set of questions were made, first comparing criteria taking two at a time and secondly, for each criteria comparing alternatives taking two at a time.
Each of the ten decision makers is given an opportunity to judge independently about the criterion and alternatives and prescribe their views for improvement of the organization.
3.2 Model development
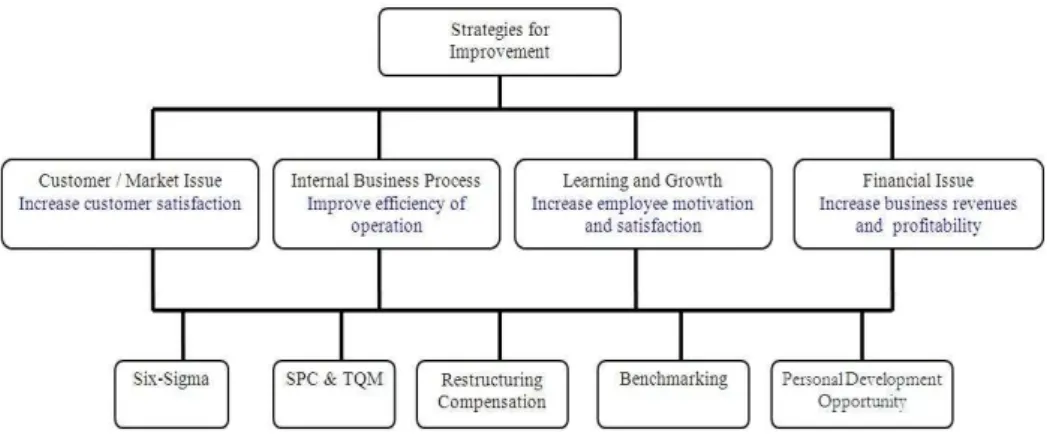
To select the criterion for selecting alternatives, balanced scorecard approach (Kaplan and Norton, 1996) is used. This framework helps to translate the strategy into actions from four perspectives: Customer/Market; Internal business processes; Learning and growth; and Financial. The appropriate AHP model is conceived as follows.
Fig-3.AHP Model under study
The criteria are selected as: (a)IncreaseCustomer Satisfaction (ICS); (b)ImproveEfficiency ofOperation (IEO); (c) Increase Employee Motivation and Satisfaction (IEMS); and (d) Increase Business Revenues and Profitability (IBRP). The alternative business strategies for improvement are decided as (1) SPC-TQM; (2) Six-Sigma; (3) Restructuring of Compensation (RE-COM); (4) Personal Development
Opportunity (PDO); and (5) Benchmarking (BENCH).
3.3 Analysis and Findings
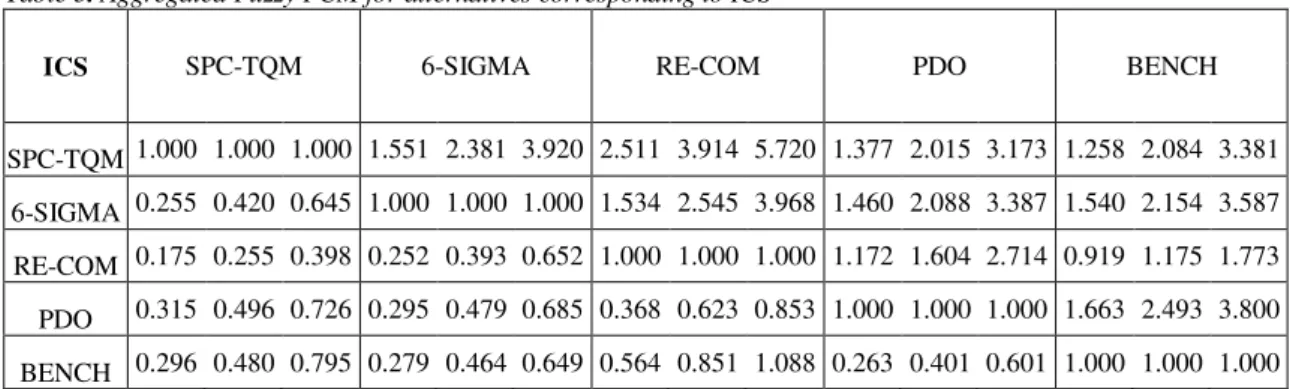
The aggregated fuzzy PCM for the four criteria is (ref. Section 2.2.3) computed and displayed inTable 3
Table 3. Aggregated Fuzzy PCM for four Criteria
ICS IEO IEMS IBRP
ICS 1.000 1.000 1.000 1.251 1.860 3.088 1.054 1.679 2.968 1.854 2.474 3.720 IEO 0.324 0.538 0.799 1.000 1.000 1.000 2.600 3.600 5.600 1.262 1.695 3.040 IEMS 0.337 0.596 0.948 0.179 0.278 0.385 1.000 1.000 1.000 1.543 1.964 3.448 IBRP 0.269 0.404 0.539 0.329 0.590 0.792 0.290 0.509 0.648 1.000 1.000 1.000
Table 4. Fuzzy Weights for four Criteria
Criteria Overall Weight
Left Middle Right
ICS 0.1721 0.3474 0.7046
IEO 0.1730 0.3385 0.6826
IEMS 0.1021 0.1901 0.3780
IBRP 0.0630 0.1240 0.1948
The fuzzy weight matrix obtained by extent analysis of the above PCM (ref. Section 2.2.4) is shown in Table 4.
Table 5.Aggregated Fuzzy PCM for alternatives corresponding to ICS
ICS SPC-TQM 6-SIGMA RE-COM PDO BENCH
SPC-TQM 1.000 1.000 1.000 1.551 2.381 3.920 2.511 3.914 5.720 1.377 2.015 3.173 1.258 2.084 3.381 6-SIGMA 0.255 0.420 0.645 1.000 1.000 1.000 1.534 2.545 3.968 1.460 2.088 3.387 1.540 2.154 3.587 RE-COM 0.175 0.255 0.398 0.252 0.393 0.652 1.000 1.000 1.000 1.172 1.604 2.714 0.919 1.175 1.773 PDO 0.315 0.496 0.726 0.295 0.479 0.685 0.368 0.623 0.853 1.000 1.000 1.000 1.663 2.493 3.800 BENCH 0.296 0.480 0.795 0.279 0.464 0.649 0.564 0.851 1.088 0.263 0.401 0.601 1.000 1.000 1.000
The fuzzy weight matrix for ICS, using extent analysis of the above PCM, is obtained (ref.Table 6) Table 6. Fuzzy Weight Matrix for ICS
ICS Performance Score
Left Middle Right
SPC-TQM 0.1620 0.3526 0.7461
6-SIGMA 0.1218 0.2540 0.5461
RE-COM 0.0740 0.1370 0.2837
PDO 0.0766 0.1576 0.3065
BENCH 0.0505 0.0989 0.1794
Similar calculations have been done for the remaining three criteria under consideration.
Next, the performance score of each alternative strategy after fuzzy extent analysis and the corresponding weighted performance scores are given in Table 7andTable 8respectively.
The total performance score after summation for all the four criteria is given inTable 9.
Table 7. Performance Score of each alternative strategy
Performance Score
ICS IEO IEMS IBRP
Left Middle Right Left Middle Right Left Middle Right Left Middle Right SPC-TQM 0.162 0.353 0.746 0.175 0.397 0.842 0.102 0.229 0.557 0.163 0.379 0.819 6-SIGMA 0.122 0.254 0.546 0.115 0.255 0.543 0.053 0.099 0.261 0.101 0.231 0.532 RE-COM 0.074 0.137 0.284 0.068 0.115 0.250 0.151 0.346 0.776 0.074 0.135 0.324 PDO 0.077 0.158 0.307 0.065 0.128 0.270 0.093 0.214 0.459 0.070 0.143 0.295 BENCH 0.051 0.099 0.179 0.051 0.105 0.204 0.045 0.112 0.203 0.051 0.111 0.211 Table 8. Weighted Performance Score of each alternative strategy
Weighted performance Score
ICS IEO IEMS IBRP
Table 9. Total Performance Score
Total Weighted Performance
Left Middle Right
SPC-TQM 0.079 0.348 1.470
6-SIGMA 0.053 0.222 0.958
RE-COM 0.045 0.169 0.727
PDO 0.038 0.157 0.631
BENCH 0.025 0.105 0.383
After performing -cut analysis, the interval performance matrices is obtained and displayed in Table 10.
Since, it is found that for all -levels, SPC-TQM >6-SIGMA>RE-COM>PDO>BENCH, the result found is thus quite consistent. Applying -function for =0.5 and =0.7, the crisp weight and rank of the alternative strategies are calculated and shown in Table 11. This result is now compared with the results of traditional AHP (ref.Table-12).
Table 10. Interval Performance Matrices
-Level
SPC-TQM 6-SIGMA RE-COM PDO BENCH
-left -right -left -right -left -right -left -right -left -right
0.1 0.106 1.358 0.070 0.885 0.057 0.671 0.050 0.584 0.033 0.355
0.2 0.133 1.246 0.087 0.811 0.069 0.615 0.062 0.536 0.041 0.328
0.3 0.159 1.133 0.104 0.737 0.082 0.560 0.074 0.489 0.049 0.300
0.4 0.186 1.021 0.121 0.664 0.094 0.504 0.086 0.441 0.057 0.272
0.5 0.213 0.909 0.137 0.590 0.107 0.448 0.097 0.394 0.065 0.244
0.6 0.240 0.797 0.154 0.517 0.119 0.392 0.109 0.346 0.073 0.216
0.7 0.267 0.684 0.171 0.443 0.132 0.336 0.121 0.299 0.081 0.188
0.8 0.294 0.572 0.188 0.369 0.144 0.281 0.133 0.251 0.089 0.160
0.9 0.321 0.460 0.205 0.296 0.156 0.225 0.145 0.204 0.097 0.133
Table 11. Crisp Weight and Rank of Strategies
=0.5 After normalization
Rank
-left -right 0.5 0.7 0.5 0.7
SPC-TQM 0.213 0.909 0.561 0.700 0.350 0.351 1
6-SIGMA 0.137 0.590 0.364 0.454 0.227 0.228 2
RE-COM 0.107 0.448 0.277 0.346 0.173 0.173 3
PDO 0.097 0.394 0.246 0.305 0.153 0.153 4
BENCH 0.065 0.244 0.154 0.190 0.096 0.095 5
Table 12 . Ranking of Strategies in traditional AHP
ICS IEO IEMS IBRP
Total Wt. Rank
0.372 0.322 0.174 0.131
SPC-TQM 0.373 0.424 0.224 0.389 0.366 1
6-SIGMA 0.240 0.233 0.115 0.219 0.213 2
RE-COM 0.129 0.111 0.354 0.125 0.162 3
PDO 0.151 0.124 0.205 0.139 0.150 4
BENCH 0.107 0.108 0.103 0.127 0.109 5
4. DISCUSSIONS
In this paper, fuzzy AHP technique is used to synthesize the opinions of the industry experts in order to select the most feasible, implementable and profitable strategies for improvement of the overall business process. Initially, a set of ‘criteria of selection’ and a set of ‘alternative strategies’ are identified. The set of ‘criteria of selection’ is established based on the balanced scorecard technique. The ‘alternative strategies for improvements’ have been fixed on the current
in respect to each of the ‘criteria of selection’. Finally, for each alternative strategy, all the fuzzy scores obtained are aggregated. -cut analysis is carried out to compare the fuzzy score obtained by the strategies. Next, -function analysis is performed to covert fuzzy performance score to crisp performance score. Based on the crisp score, alternative strategies are ranked and it is found that for all the confidence levels and for all types of attitude levels of the decision-making team, SQC-TQM methodology is ranked highest. The results are found to be complying with the result of traditional AHP, the finding is consistent. The findings of the study using fuzzy AHP technique are finally placed to the management of the industry for effective implementation to all the related departments as a successful business strategy.
5. CONCLUDING REMARKS
The principle of finding decision making strategy using fuzzy AHP technique works well in industrial environment. Moreover, the fuzzy extent analysis gives advantage of estimating weights of the criteria and scores for the alternative strategies. The ranking based knowledge extraction for selection of business strategies shows a relatively easy direction for improvement of any business process. However, in industrial environment, the root cause analysis is a necessity for relatively lower ranked alternatives, eventually to improve employee motivation and satisfaction.
REFERENCES:
[1] Saaty, T.L. (2000)Decision Making for Leaders; The Analytical Hierarchy Process for Decisions in a Complex World, Pittsburgh: RWS Publications.
[2] Chen, S.J., Hwang, C.L. and Hwang, F.P. (1992),Fuzzy multiple attribute decision making. Lecture Notes in Economics and Math. Syst., 375, Springer-Verlag, Berlin – Heidelberg.
[3] Saaty, T.L. (1994) ‘How to make a decision: the analytic hierarchy process’,Interfaces, 24(6), 19–43. [4] Saaty, T.L. and Vargas, L.G. (2006)Decision Making with the Analytic Network Process: Economic,
Political, Social and Technological Applications with Benefits, Opportunities,Costs and Risks, New York: Springer.
[5] Saaty, T. L. (2008), Decision making with theAnalytic Hierarchy Process, Int. J. of Services Sciences, 1(1), 83-97.
[6] Bhushan, N. and Ria, K. (2004)Strategic Decision Making: Applying the Analytic Hierarchy Process, London: Springer-Verlag London Limited.
[7] Saaty, T. L. (2000),The Analytic Hierarchy Process, Pittsburgh, RWS Publications.
[8] Van Laarhoven, P.J.M., and Pedrycz, W. (1983), A fuzzy extension of Saaty’s priority theory, Fuzzy Sets and Systems, 11(3), 229-241.
[9] Buckley, J.J. (1985), Fuzzy hierarchical analysis,Fuzzy Sets and Systems, 17(3), 233-247.
[10] Stam, A., Minghe, S. and Haines, M. (1996), Artificial neural network representations for hierarchical preference structures,Computers and Operations Research, 23(12), 1191-1201.
[11] Chang, D.Y. (1996), Applications of the extent analysis method on fuzzy AHP,European Journal of Operational Research, 95(3), 649–655.
[12] Chang, D.Y. (1992), Extent Analysis and Synthetic Decision, Optimization Techniques and Applications,World Scientific, Singapore, 1, 352.
[13] Cheng, Ching-Hsue (1997), Evaluating naval tactical missile systems by fuzzy AHP based on the grade value of membership function,European Journal of Operational Research, 96(2), 343-350.
[14] Weck, M., Klocke, F., Schell, H. and Rüenauver, E. (1997), Evaluating alternative production cycles using the extended fuzzy AHP method,European Journal of Operational Research, 100(2), 351-366. [15] Kahraman, C., Ulukan, Z. and Tolga, E. (1998), A fuzzy weighted evaluation method using objective
and subjective measures, Proceedings of the International ICSC Symposium on Engineering of Intelligent Systems, 1, Univ. of La Laguna Tenerife, Spain, 57-63.
[16] Zhu, K.J., Jing, Y. and Chang D.Y. (1999), A discussion of extent analysis method and applications of fuzzy AHP,European Journal of Operational Research, 116, 450-456.
[18] Martinez-Tome, M., Vera, A.M. and Murcia, M.A. (2000), Improving the control of ffod production in catering establishments with particular reference to the safety of salads,Food Control, 11(6), 437-445. [19] Creed, P.G. (2001), The potential of food service systems for satisfying consumer needs,Innovative
Food Science and Emerging Technologies, 2, 219-227.
[20] Jansen, D.R., Weert, A., Beulens, A.J.M. and Huirne, R.B.M. (2001), Simulation model of multi-component distribution in the catering supply chain,European Journal of Operations Research, 133, 210-224.
[21] Cebeci, U. (2001), Customer satisfaction of catering service companies in Turkey,Proceedings of the Sixth International Conference on ISO 9000 and TQM, Glasgow, 519-524.
[22] Cebeci, U. and Kahraman, C. (2002), Measuring customer satisfaction of catering service companies using fuzzy AHP: the case of Turkey,Proceedings of International Conference on Fuzzy Systems and Soft Computational Intelligence in Management and Industrial Engineering, Istanbul, 315-325. [23] Kahraman, C., Cebeci, U. and Ruan, D. (2004), Multi-attribute comparison of catering service
companies using fuzzy AHP: The case of Turkey,International Journal of Production Economics, 87, 171-184.
[24] Yu, C.S. (2002), A GP-AHP method for solving group-decision making AHP problems,Computers and Operations Research, 29, 1969-2001.
[25] Yang, Z.Y., Chen, Y. H. and Sze, W.S. (2003), Using AHP and Fuzzy Sets to Determine the Build Orientation in Layer-based Machining, International Journal Computer Integrated Manufacturing, 16(6), 398-408.
[26] Tolga, E., Demirean, M.L. and Kahraman, C. (2005), Operating system selection using fuzzy replacement analysis and analytic hierarchy process,International Journal of Production Economics, 97, 89-117.
[27] Kahraman, C. (2008),Fuzzy Multi-Criteria Decision Making:Theory and Applications with Recent Developments, 16, (Springer Optimization and Its Applications), Springer.
[28] Saaty, T.L. (2005)Theory and Applications of the Analytic Network Process, Pittsburgh, PA: RWS Publications.
[29] Saaty, T.L. and Vargas, L.G. (2000) Models, Methods, Concepts and Applications of the Analytic Hierarchy Process, Boston: Kluwer Academic Publishers.
[30] Moon, Tae-heon and Lee, Woo-bae (1999),Construction of Supporting System for Decision Making Process ff Zoning Designation and Change that has Fuzziness, The 6th International Conference Computers in Urban Planning and Urban Management, Venice, Italy.
[31] Aczél, J. and Roberts, F.S. (1989), On the possible merging functions,Mathematical Social Science,17, 205–243.
[32] Forman, E. and Peniwati, K. (1998), Aggregating individual judgments and priorities with the analytic hierarchy process,European Journal of Operational Research, 108(1), 165-169.
[33] Wu, Wen-Hsiang., Chiang, Chang-Tzu., and Lin, Chin-Tsai (2008), Comparing the Aggregation Methods in the Analytic Hierarchy Process when Uniform Distribution, WSEAS Transactions on Business and Economics, 1. (EI)
[34] Wang, Li-Xin. (1997),A Course in Fuzzy Systems and Control, Prentice-Hall, USA.
[35] Saaty, T. L. (2003), Rank, Normalization and Idealization in the Analytic Hierarchy Process,The 7th International Symposium on Analytic Hierarchy Process, Bali, Indonesia.
[36] Kaplan, R. S. and Norton, D. P. (1996), Using the balanced scorecard as a strategic management system,Harvard Business Review, 76.