www.atmos-chem-phys.net/16/11991/2016/ doi:10.5194/acp-16-11991-2016
© Author(s) 2016. CC Attribution 3.0 License.
Arabian Red Sea coastal soils as potential mineral dust sources
P. Jish Prakash1, Georgiy Stenchikov1, Weichun Tao1, Tahir Yapici1, Bashir Warsama1, and Johann P. Engelbrecht1,2
1King Abdullah University of Science and Technology (KAUST), Physical Science and Engineering Division (PSE), Thuwal,
23955-6900, Saudi Arabia
2Desert Research Institute (DRI), Reno, Nevada 89512-1095, USA
Correspondence to:P. Jish Prakash (jishprakash@gmail.com)
Received: 3 February 2016 – Published in Atmos. Chem. Phys. Discuss.: 23 March 2016 Revised: 15 August 2016 – Accepted: 5 September 2016 – Published: 26 September 2016
Abstract. Both Moderate Resolution Imaging Spectrora-diometer (MODIS) and Spinning Enhanced Visible and In-fraRed Imager (SEVIRI) satellite observations suggest that the narrow heterogeneous Red Sea coastal region is a fre-quent source of airborne dust that, because of its proximity, directly affects the Red Sea and coastal urban centers. The potential of soils to be suspended as airborne mineral dust depends largely on soil texture, moisture content and par-ticle size distributions. Airborne dust inevitably carries the mineralogical and chemical signature of a parent soil. The existing soil databases are too coarse to resolve the small but important coastal region. The purpose of this study is to better characterize the mineralogical, chemical and physical properties of soils from the Arabian Red Sea coastal plain, which in turn will help to improve assessment of dust ef-fects on the Red Sea, land environmental systems and ur-ban centers. Thirteen surface soils from the hot-spot areas of windblown mineral dust along the Red Sea coastal plain were sampled for analysis. Analytical methods included op-tical microscopy, X-ray diffraction (XRD), inductively cou-pled plasma optical emission spectrometry (ICP-OES), ion chromatography (IC), scanning electron microscopy (SEM) and laser particle size analysis (LPSA). We found that the Red Sea coastal soils contain major components of quartz and feldspar, as well as lesser but variable amounts of am-phibole, pyroxene, carbonate, clays and micas, with traces of gypsum, halite, chlorite, epidote and oxides. The range of minerals in the soil samples was ascribed to the variety of igneous and metamorphic provenance rocks of the Arabian Shield forming the escarpment to the east of the Red Sea coastal plain. The analysis revealed that the samples contain compounds of nitrogen, phosphorus and iron that are essen-tial nutrients to marine life. The analytical results from this
study will provide a valuable input into dust emission models used in climate, marine ecology and air quality studies.
1 Introduction
Mineral dust is the most abundant atmospheric aerosol, pri-marily suspended from soils in arid and semiarid regions of the globe (Buseck et al., 1999; Washington and Todd, 2005; Goudie and Middleton, 2006; Muhs et al., 2014), includ-ing deserts of the Arabian Peninsula (Edgell, 2006). Dust aerosols profoundly affect climate, biogeochemical cycles in the ocean and overland, air quality, atmospheric chem-istry, cloud formation, visibility and human activities (Pros-pero et al., 2002; Haywood and Boucher, 2000; Hsu et al., 2004; Sokolik and Toon, 1999; Kumar et al., 2014; De Longueville et al., 2010; Jickells et al., 2005; Mahowald, 2009; Huang et al., 2006, 2014; Fryrear, 1981; Nihlen and Lund, 1995; Hagen and Woodruff, 1973; Bennett et al., 2006; Bennion et al., 2007; Twomey et al., 2011; Wang et al., 2010). The Arabian Peninsula is one of Earth’s ma-jor sources of atmospheric dust, which contributes as much as 11.8 % (22–500 Mt a−1) of the total (1877–4000 Mt a−1)
areas in this region, hosting the major industrial and urban centers.
Both Moderate Resolution Imaging Spectroradiometer (MODIS) and Spinning Enhanced Visible and InfraRed Im-ager (SEVIRI) satellite observations suggest that the narrow Red Sea coastal belt is an important dust source region, aug-mented by the fine-scale sediment accumulations, scattered vegetation and variable terrain. Dust hot spots are located within the narrow coastal region and, because of their prox-imity to the Red Sea, contribute to the dust–nutrient balance of the sea, during both dusty- and fair-weather conditions.
Dust emission rates from soils and sites of airborne par-ticles strongly depend on the soil particle size distributions. Optical properties such as scattering, absorption and refrac-tive indices vary by mineralogical content and particle size of the dust in the atmosphere. Dust reactivity in the seawa-ter also depends on their mineralogy; for example carbon-ates (calcite, dolomite), evaporites (gypsum) and some ox-ides (hematite, goethite) are generally more soluble in water than, for example, most silicates (quartz, feldspars, micas, clays, amphiboles, pyroxenes). Soils in arid regions, where particles are only loosely bound to the surface by the low soil moisture, are most susceptible to wind erosion or being phys-ically disturbed by agriculture or traffic. Dust uplifting oc-curs in a source region when the surface wind speed exceeds a threshold velocity (Gillette and Walker, 1977), which is a function of surface roughness elements, grain size and soil moisture (Marticorena and Bergametti, 1995; Wang et al., 2000). Fine soil particles that can be transported over large distances are released by saltating coarse silt and sand parti-cles (Caquineau et al., 1997). Soil morphology, mineralogy and chemical composition define the abundance and compo-sition of airborne dust, however, not directly but through the series of complex fine-scale nonlinear processes.
From preliminary observations it is estimated that five to six major dust storms per year impact the coastal region of Saudi Arabia, depositing about 6 Mt of mineral dust into the Red Sea (Jish Prakash et al., 2015). Simulations and satel-lite observations suggest that the coastal dust contribution to the total deposition flux into the Red Sea could be signifi-cant even during fair-weather conditions (Jiang et al., 2009). However, the mineralogy, physical properties and chemical composition of dust generated from the Red Sea coastal re-gion remain uncertain. The coastal plain is a narrow ge-ographically and petrge-ographically heterogeneous piedmont area and existing soil databases do not provide the spatial res-olution for the region to be adequately described (Nickovic et al., 2012). The importance of keeping track of dust min-eralogy during the atmospheric transport was recently rec-ognized and implemented in models (Perlwitz et al., 2015b, a). Equation (1) relates the size-dependent soil dust proper-ties with that emitted into the atmosphere, where dust-size distribution and compositional characteristics are further ad-justed as the atmospheric residence time of dust particles de-pends on their particle size distribution and particle mass. To
explain the connection between soil properties and airborne dust abundance and composition we discuss the physically based dust generation parameterizations currently used in the advanced modeling systems (Grell et al., 2005; Zender et al., 2003). The vertical mass fluxFj(kg m−2s−1), with dust-size componentj, generated from the ground to the atmosphere can be assessed as follows:
Fj=T SfmαQs I X
i=1
Mij, (1)
whereT is a tuning constant for adjusting to different hor-izontal and temporal resolutions. The parameter S is the erodibility factor that accounts for the susceptibility of a landscape to wind erosion controlled by the non-erodible roughness elements and the erodibility of soils within the erodible area of a landscape (Webb and Strong, 2011). This parameter is often defined via the so-called “source function” that accounts for the spatial distribution of dust source inten-sities based on a variety of algorithms (Menut et al., 2013). The parameterfmis a grid cell fraction of exposed bare soil
suitable for dust mobilization. The coefficientαis the sand-blasting mass efficiency determined by the mass fraction of clay particles in the soil. The parameterQs is the total
hor-izontally saltation mass flux (kg m−1s−1), which is propor-tional to the third power of friction velocity (u∗s)when it ex-ceeds a threshold velocityu∗t (Oleson et al., 2010; Zender et al., 2003). In dust emission models, the soil erodibility is represented through the effects of soil texture and moisture content on the threshold friction velocityu∗t and the aerody-namic roughness lengthfz (Oleson et al., 2010; Webb and Strong, 2011).Mij is the mass fraction of each source mode
i, carried in each transport binj.
The sample area in this study lies within the approxi-mately 60–70 km wide Tih¯amah coastal plain, comprised of the Tih¯amat ‘As¯ır in the south and the Tih¯amat Al-Hejaz to the north. The plain is bounded by the Red Sea in the west, with the mountains of Midyan, Ash Shifa and Asir forming an escarpment to the east (Edgell, 2006), with few breaks in the mountains in the northwest. The mountains form a 1000–3000 m elevation Red Sea escarpment, comprised of igneous, metamorphic and volcanic rocks of variable age, from the Precambrian (1000–545 Ma) to less than 30 My in age (Grainger, 2007). The Red Sea rift basin itself is over-lain by the much younger sediments of the Quaternary age (<2.6 Ma).
dom-inate soils in the central region. The soils in the west con-tain mainly quartz, feldspars, hornblende and mica. Paly-gorskite was found to be the main clay mineral in soils in the eastern region; kaolinite in the central region; and kaoli-nite, smectite and mica in the western region. Aba-Husayn et al. (1980) mineralogically analyzed soils from the south-western region of Saudi Arabia, along the mountainous Asir region between Mecca and Abha. They found large amounts of quartz, feldspars and micaceous minerals in the silt frac-tions, with the clay-size fractions of kaolinite, smectite and vermiculite, and with kaolinite in the well-drained highland areas. Viani et al. (1983) studied 14 soils from alluvial basins in the W¯ad¯ı ad Daw¯asir and W¯ad¯ı Najr¯an areas of south-western Saudi Arabia. Due to the fact that the alluvial clay-size fractions were from weathered igneous rocks of the sur-rounding mountains, they were found to be composed largely of smectite, mica, kaolinite, chlorite, palygorskite and ver-miculite. With the exception of the area around J¯ız¯an in the south, which is impacted by the Indian Ocean monsoon, the Red Sea coastal region has a desert climate characterized by extreme heat, reaching 39◦C during the summer days, with a drop in nighttime temperatures by approximately 10◦C. Although the extreme temperatures are moderated by the proximity of the Red Sea, in summer the humidity is often 85 % or higher during periods of the northwesterly shamal winds. Annual rainfall decreases in a northwardly direction; from an annual average of 133 mm at J¯ız¯an in the south, to 56 mm at Jeddah in central Saudi Arabia, and 24 mm at Tab¯uk in the north. Vegetation is sparse, being restricted to semidesert shrubs and acacia trees along the ephemeral rivers (wadis), and provides forage for small herds of goats, sheep and dromedary camels.
During infrequent but severe rainstorms, run-off from the escarpment along wadis often produces flash floods. With such events, fine silt and clays are deposited on the coastal plain, which are transformed into dust sources dur-ing dry and windy periods of the year. The resultant dust is transported and deposited on the coastal plain and adja-cent Red Sea by prevailing northwesterly to southwesterly winds, with moderate breezes (wind speed>5.5 m s−1)from the north (http://www.windfinder.com/weather-maps/report/ saudiarabia#6/22.999/34.980).
2 Objectives
The assumption is that at least part of the dust in the ambi-ent atmosphere in the coastal region is from windblown and otherwise disturbed soils along the Red Sea coast. Jiang et al. (2009) and Kalenderski et al. (2013) found that the coastal area emits about 5–6 Mt of dust annually. Due to its close proximity, a significant portion of this dust is likely to be deposited into the Red Sea, and this amount could be com-parable to the estimated annual deposition rate from remote sources during major dust storms (Jish Prakash et al., 2015).
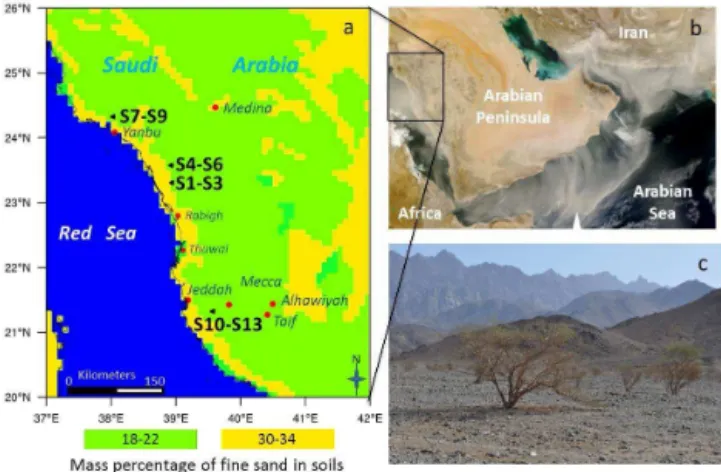
Figure 1. (a)Map showing the mass percentage of fine sand in soils, based on STATSGO-FAO soil-texture data (Nickovic et al., 2012; Menut et al., 2013), in the Arabian Peninsula, as well as the four lo-calities and 13 (S1–S13) sampling sites.(b)MODIS satellite image of dust storm over the Arabian Peninsula captured on 22 Febru-ary 2008 (NASA MODIS web site).(c)Sampling site S1 showing the typical acacia trees growing along the wadi in the foreground, with the Hijaz mountain range and escarpment in the distance.
Due to the limited compositional information of soils along the Red Sea coastal region, this study aims to provide mineralogical, chemical and morphological information on soils (Scheuvens and Kandler, 2014) within the central part of the Red Sea coastal plain of Saudi Arabia (Fig. 1).
This information will help to better quantify the ecolog-ical impacts, health effects, damage to property and opti-cal effects of dust blown from these areas (Engelbrecht et al., 2009a, b; Weese and Abraham, 2009). The mineralog-ical compositions of the soils tie into that of the parental rocks, weathering conditions and time. This research will also complement soil and dust studies performed in the Ara-bian Peninsula as well as globally (Engelbrecht and Moos-müller, 2014; Engelbrecht et al., 2009b). Knowledge of the mineralogy of the soils will provide data on refractive in-dices, particle size and shape parameters, which can be used to calibrate dust transport models and help to assess the im-pact of dust events on the coastal plain and the Red Sea.
3 Sampling and analysis
collected at 28 km southwest of Mecca near W¯ad¯ı An Nu-man, located 45 km from the Red Sea. The coordinates of the sample sites are provided in Table 1. All 13 samples can be classed as Leptosols (Regosols) (http://www.fao.org/ag/ agl/agll/wrb/soilres.stm).
The grab soil samples collected in the field were sieved to<1 mm to remove pebbles, plant material and other de-tritus. Where necessary, they were air-dried in the labora-tory before being labeled, catalogued and stored in capped plastic bottles. Subsets of these samples were screened to
<38 µm for mineral analysis by powder X-ray diffraction (XRD), chemical analysis and scanning electron microscopy (SEM)-based individual particle analysis. Further samples of
>75,<125 µm were sieved for mineralogical investigation by optical microscopy and <600 µm for laser particle size analysis (LPSA).
Petrographic microscopy is particularly suited to the opti-cal identification of mineral grains larger than approximately 10 µm (Kerr, 1959). It remains a cost-effective and accurate technique to obtain mineralogical information which is oth-erwise difficult to obtain, e.g. the identification of feldspars, amphiboles and pyroxenes. The>75,<125 µm sieved soil fraction grains were mounted on epoxy on a glass slide and ground to a thickness of approximately 30 µm for transmit-ted light optical microscopy. Minerals with distinctive opti-cal properties – including refractive indices, birefringence, extinction angles, pleochroism and optical interference pat-terns, or those showing twinning, distinctive cleavage and diagnostic extinction angles – can be readily be identified by optical microscopy (Kerr, 1959). Minerals readily iden-tified in these samples by this method include quartz, vari-ous feldspars, amphiboles, pyroxenes, micas and carbonates. However, depending on the mineral type, particles<10 µm in diameter are often difficult to identify by this method, in-cluding clay minerals and other layered silicates. The method is biased towards easily identifiable and coarser minerals, es-pecially those with twinning, such as feldspars, and show-ing color and pleochroism, such as hornblende and biotite. The method, although one of the most practical for qualita-tive mineral analysis, does require mineralogical expertise.
X-ray diffraction is a nondestructive technique for charac-terization of minerals. Powder XRD is particularly suited for fine-grained crystalline mineral mixtures<10 µm in diame-ter. The procedure measures the crystallinity of a sample, i.e. excludes amorphous phases such as clay-like colloids (For-menti et al., 2011; Leinen et al., 1994; Engelbrecht et al., 2016; Kandler et al., 2009), partly crystalline layered sili-cates such as some clays, and hydroxides. If an amorphous phase is present, it will not be fingerprinted by XRD. The as-sessment of mineral content of a powder sample by the rela-tive intensity ratio (RIR) method suggested by Chung (1974), and as applied in our measurements, does not account for amorphous content. Dust reactivity in seawater, as well as its optical properties, depends on its mineralogy, for example, carbonates and some silicates are generally more soluble in
Table 1.Localities of soil sampling sites along the Red Sea coastal plain.
Site Locality Latitude Longitude Elevation (m)
S1 SE of Al Nasaif 23.3322◦N 38.9481◦E 94
S2 SE of Al Nasaif 23.2961◦N 38.9385◦E 68
S3 SE of Al Nasaif 23.2920◦N 38.9100◦E 46
S4 E of Ar R¯ayis 23.5876◦N 38.9243◦E 128
S5 E of Ar R¯ayis 23.5746◦N 38.9213◦E 118
S6 E of Ar R¯ayis 23.5656◦N 38.9193◦E 115
S7 N of Yanbu 24.3334◦N 38.0205◦E 113
S8 N of Yanbu 24.3239◦N 38.0254◦E 60
S9 N of Yanbu 24.3195◦N 38.0245◦E 56
S10 SW of Mecca 21.3197◦N 39.5763◦E 128
S11 SW of Mecca 21.3232◦N 39.5711◦E 124
S12 SW of Mecca 21.3211◦N 39.5593◦E 133
S13 SW of Mecca 21.3253◦N 39.5508◦E 118
water than, for example, feldspars, amphiboles, pyroxenes or quartz. A Bruker D8®powder XRD system was used to ana-lyze the mineral content of the soil samples. The diffractome-ter was operated at 40 kV and 40 mA, with Cu Kαradiation, scanning over a range of 4◦to 50◦2θ. The Bruker TOPAS® software using the RIR method was applied for semiquan-titative XRD analyses of the<38 µm screened dust samples (Rietveld, 1969; Chung, 1974; Esteve et al., 1997; Caquineau et al., 1997; Sturges et al., 1989).
Laser particle size analysis (LPSA) was performed on the 13 soil samples. The LPSA system measures the size-class fractions of a soil or sediment sample in an aqueous sus-pension, based on the principle that light scatters at angles inversely proportional to, and with intensity directly propor-tional to, particle size (Gee and Or, 2002). The grab sam-ples were sieved to<600 µm before being introduced to the laser analyzer (Micromeritics Saturn DigiSizer 5200®) in an aqueous solution of 0.005 % surfactant (sodium metaphos-phate). The suspensions were internally dispersed by apply-ing ultra-sonication, before beapply-ing circulated through the path of the laser light beam. The measured size-class fractions were grouped as clay (<2 µm), silt (>2, <62.5 µm) and sand (>62.5,<600 µm) (Engelbrecht et al., 2012). This an-alytical method disperses soil aggregates which are poten-tial dust particles, thus shifting the particle size distribution curves towards the smaller particle sizes. This may introduce a bias to the actual size distribution of wind-generated dust particles in the field.
The<38 µm sieved samples were chemically analyzed for elemental composition by inductively coupled plasma optical emission spectrometry (ICP-OES) and their water-soluble ions by ion chromatography (IC). For ICP-OES, splits of 0.1 g of each of the samples were digested in a 1 : 3 : 1 mix-ture of concentrated HF, HCl and HNO3 in a microwave
Ni, Cu, Zn, Sr, Cd, Ba and Pb. The accuracy of the analyses was monitored by analyzing the National Institute of Stan-dards and Technology (NIST) standard reference material 1646a with each batch of soil samples. The elemental com-position of dust per se does not provide adequate informa-tion on its mineral content. However, with a priori knowledge of the mineral composition of the samples, from optical and XRD measurements, “normative” mineral compositions can be calculated. This provides a method for inter-comparing chemically analyzed samples with each other.
Further splits (∼0.01 g) of the <38 µm sieved samples were sonicated in 15 mL deionized, distilled water, the sus-pension left to settle overnight and the extractions analyzed by IC (DIONEX ICS-3000®). The water-soluble cations of sodium (Na+), potassium (K+), calcium (Ca2+)and
magne-sium (Mg2+)and anions of sulfate (SO2−
4 ), chloride (Cl
−),
phosphate (PO34−)and nitrate (NO−3)were analyzed by this method.
Electron microscopy provides information on the individ-ual particle size, shape, chemical composition and mineral-ogy of micron-size particles, which is important for deter-mining the optical parameters for modeling of dust (Moos-müller et al., 2012). The individual particle chemistry, es-pecially of the soluble minerals such as carbonates, is of-ten of importance in medical geology and to marine life. The SEM-based individual particle analysis was performed on the<38 µm sieved sample splits. A dual approach was followed, the first being the computer-controlled scanning electron microscopy (CCSEM) and the second being sec-ondary electron imaging by high-resolution SEM. For each sample, a portion of soil was suspended in isopropanol and dispersed by sonication. The suspension was vacuum-filtered onto a 0.2 µm pore-size polycarbonate substrate. A section of the substrate was mounted onto a metal SEM stub with col-loidal graphite adhesive. The sample mounts were sputter-coated with carbon to dissipate the negative charge induced on the sample by the electron beam. The automated CCSEM analysis was conducted on a Tescan MIRA3®field emission scanning electron microscope (FE-SEM). The CCSEM anal-ysis was performed by rastering the electron beam over the sample while monitoring the resultant combined backscat-tered electron (BE) and secondary electron (SE) signals. The BE intensities were applied to set grayscale levels in or-der to distinguish particles of interest from the background. The system was configured to automatically measure the size and the elemental composition for approximately 2000 indi-vidual particles of>0.5,<38 µm sizes. Individual particles were classified into particle types according to their elemen-tal compositions. A digielemen-tal image was acquired of each parti-cle, for measurement, and stored for subsequent review. Size measurements were based on diameters obtained from the projected area of each particle by tracing their outer edges. Compositional information was determined through collec-tion and processing of characteristic X-rays by energy
dis-Table 2.The volume particle size fraction (%) of the <600 µm sieved soil samples.
Sand Silt Clay
Sample (600–62.5 µm) (62.5–2 µm) (<2 µm)
S1 78.0 19.2 2.8
S2 77.2 20.5 2.3
S3 93.3 5.7 1.0
S4 96.3 3.0 0.7
S5 88.4 10.0 1.7
S6 88.5 9.8 1.6
S7 94.3 5.2 0.5
S8 93.5 6.0 0.5
S9 87.1 12.1 0.9
S10 87.8 10.6 1.6
S11 86.6 11.4 1.9
S12 91.1 7.6 1.2
S13 92.7 6.1 1.2
persive spectroscopy (EDS) using a silicon drift detector. The elements identified in the spectrum were processed to ob-tain their relative concentrations. The particles were grouped into “bins” by their particle size and chemical ratios. From the chemical measurements and a priori knowledge of the sample mineralogy (from optical microscopy and XRD), the mineralogy of individual particles can often be inferred, e.g. Si particles being quartz, Ca particles being calcite, and Ca plus S particles being gypsum. Due to the attenuation of the electron beam as it impinges the particle surface and loss of energy, the analysis is physically limited to an electron interaction volume of 2–5 µm below the mineral surface de-pending on the primary beam voltage and the mineral density (Goldstein et al., 2003). Most of the investigated mineral dust particles have coatings of clay minerals and oxides, which results in an overestimation of the amounts of these miner-als when analyzed by CCSEM (Engelbrecht et al., 2009a, b, 2016).
The field emission electron source allows for high magni-fications and sharp secondary electron images (SEIs). This technique allows for the detailed study of particle shape, sur-face features and chemical compositions. Approximately five SEIs with energy dispersive spectra (EDS) for each of the 13 samples were collected. Supplement S03 shows a few SEM, SEIs and EDS spectra of the<38 µm soil particles from the sampling site.
4 Results
4.1 Particle size analysis
Figure 2.US Department of Agriculture (USDA) soil-texture trian-gle showing the grain size plot of the 13 samples collected for this study. Volume size-class fractions grouped as clay (<2 µm), silt (2– 62.5 µm) and sand (62.5–600 µm).
fractions. Also, the silt makes up approximately 10 % and the clay on average less than 1.5 % of the sample volume.
Field and laboratory measurements of dust from the west-ern USA carried out by Engelbrecht et al. (2012) showed that dust emissions are largely controlled by their soil parti-cle size distributions (Kok, 2011a, b). It was established that surface soils with a silt content greater than approximately 50 % and a clay content of less than approximately 10 % – i.e. samples in the “silt loam” field (Fig. 2) – have the great-est potential to become resuspended in the air and to generate airborne mineral dust. This particle size criterion provides an important measure for whether a site or region has the poten-tial to be a significant dust source (Greely and Iversen, 1985). These include soils from previously identified dust sources such as; the Bodélé Depression (Washington et al., 2003); loess along the Danube River valley, Kuwait and China (En-gelbrecht and Moosmüller, 2014); silt deposits collected on the island of Fuerteventura assumed to contain dust from the western Sahara (Menéndez et al., 2014); and one diatoma-ceous silt sample from Reno, USA. Besides the particle size distribution, it was shown that moisture content and surface roughness play important roles in the saltation and deseg-regation of soil particles (Marticorena, 2014). Judging from their particle size distributions alone, soil samples collected from the coastal zone of Saudi Arabia are not considered to contain enough silt-size particles to be efficient emitters of dust. However, the satellite images show that these coastal dust sources are activated quite frequently.
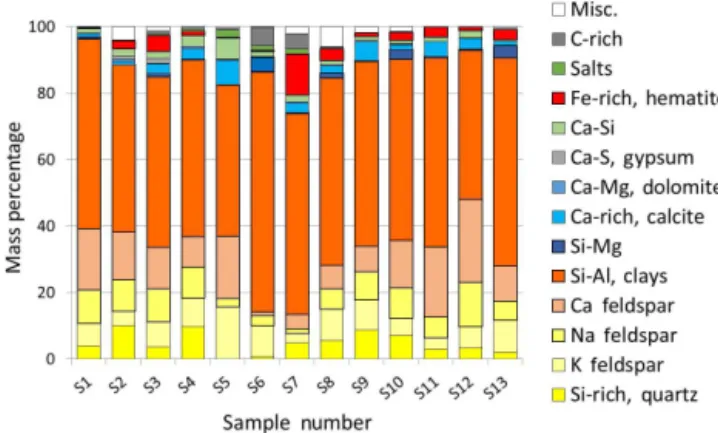
Figure 3.Normalized mineral compositions by percentage of mass of 13 sieved soil samples<38 µm collected at four localities along the Red Sea coastal area, as measured by XRD.
4.2 Optical microscopy
Mineralogical investigation by optical microscopy of three
>75, <125 µm sieved samples showed them to consist of partially weathered angular mineral grains in sediments probably eroded from the Precambrian basement and Ter-tiary volcanic rocks of the Arabian Shield, approximately 50 km east of the Red Sea coastline (Edgell, 2006). The ma-jor minerals identified in this size range are feldspar (mainly plagioclase), quartz, pyroxene (aegirine-augite), amphibole and mica (biotite, muscovite). Lesser amounts of potas-sium feldspar (orthoclase, microcline), carbonates (calcite, dolomite), chlorite, epidote and oxides were identified by op-tical microscopy.
4.3 XRD mineral analysis
Figure 4.Compositional plot showing major oxide percentages by mass from ICP-OES analysis of<38 µm sieved soils.
4.4 Chemistry (ICP-OES and IC)
Chemical analysis of the <38 µm sieved bulk samples by ICP-OES and IC is presented in Appendix A, Tables A1 and A2, and a plot of the major elements expressed as oxides, shown in Fig. 4. The soils are of reasonably consistent chem-ical composition throughout the sampled region.
The sedimentary samples all contain major mass percent-ages of SiO2, which varies between 63 and 78 % in the
13 samples, mostly as the mineral quartz, and lesser mass percentages of Al2O3, CaO, Na2O, and K2O in plagioclase
and potassium feldspars. SiO2together with Al2O3, Fe2O3,
TiO2, MnO, MgO and some K2O is also contained in the
previously identified clays, micas and amphiboles. Small amounts of CaO (0.9–1.7 %) are contained in gypsum and calcite, and are found together with MgO (2.3–3.1 %) in dolomite.
The water-soluble ions account for a small percentage of the total mass of the soils, varying between 0.1 and 0.7 % for the total cations and 0.03 and 0.8 % for the total anions. These account primarily for calcite and dolomite (∼0.3 %) and gypsum (∼0.2 %), with even lesser amounts of halite and other chlorides from sea salt. The unexpectedly low con-centration of halite and other soluble salts in the soils of the coastal plains can be ascribed to the fact that all the samples were collected at distances varying between 21 and 42 km from the Red Sea coast, and also the absence of local playas or other saline soils close to the four sampled areas. It is also expected that the salts had been leached from the soil samples collected from the surface. Also of importance to dust-borne nutrients that are likely to be deposited in the Red Sea is the low concentration of water-soluble PO34− (avg. 0.003 %) in comparison to the total P2O5 (avg. 0.4 %) in the soils. The
phosphorus is largely bound in the low-solubility mineral ap-atite (francolite), commonly found in the sediments through-out the Arabian Peninsula.
Figure 5.CCSEM-based individual particle analysis for the 0.5– 38 µm chemical set, with the chemical bins labeled as minerals, ar-ranged by normalized mass percentage.
The Fe/Al mass ratios for the suite of 13 samples from the Red Sea coastal plain vary between 1.26 and 3.59, with a geometric mean of 2.41 (Appendix A). These measurements partly overlap with the Fe/Al ratios of 0.53–1.71 measured for dust samples from the Bodélé Depression in Chad (Bris-tow et al., 2010) and are included in the range of 0.41–3.78 for resuspended soil samples from global dust sources (En-gelbrecht et al., 2016). In contrast, soil samples collected from ferricretes along the southern Sahel in northern Africa have Fe/Al ratios in the range of 2.95 to 3.43 (Roquin et al., 1990).
4.5 SEM chemical analysis
Approximately 2000 individual dust particles per sample in the 0.5–38 µm size range were analyzed automatically by CCSEM for chemical composition, particle morphol-ogy and size. The particles were classed into 14 bins as per their chemical compositions. Mineral labels were as-signed to these chemical bins, e.g. Fe-rich as hematite (Fe2O3)(also possibly goethite, magnetite or ferrihydrite),
CaS-rich as gypsum (CaSO4.2H2O), CaMg-rich as dolomite
(CaMg(CO3)2), Ca-rich as calcite (CaCO3), CaAlSi-rich as anorthite (CaAl2Si2O8), NaAlSi-rich as albite (NaAlSi3O8),
KAlSi-rich as K-feldspar (KAlSi3O8)and Si-rich as quartz
(SiO2). The CCSEM results for the 0.5–38 µm analyzed set as well as the 0.5–2.5 µm (fine) subset are presented in Figs. 5 and 6.
Figure 6.CCSEM-based individual particle analysis for 0.5–2.5 µm (fine) subset, with the chemical bins labeled as minerals, arranged by normalized mass percentage.
subsets of the three samples (S7, S8 and S9) are different from the others in their higher Fe-rich (goethite, hematite) and carbon (carbonates) components, as well as their corre-sponding smaller amounts of clay (Fig. 6). This can be as-cribed to a local difference in the mineralogical composition of the undifferentiated source rocks (Edgell, 2006), as well as weathering conditions.
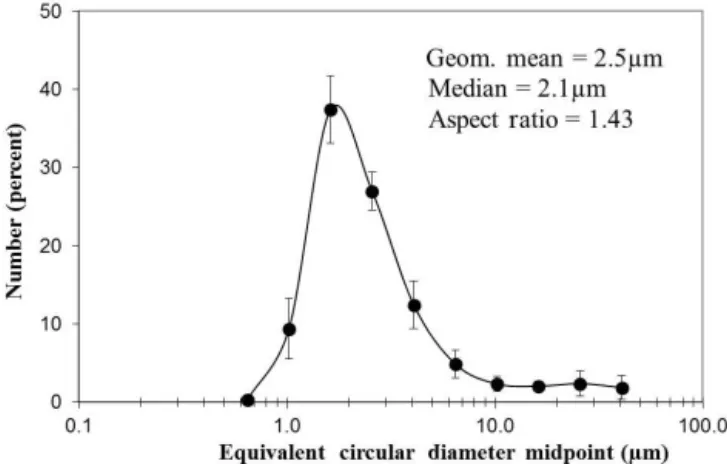
The size and shapes of the 13 sieved samples <38 µm are given in Appendix A and Tables A1 and A2, with the average size distributions graphically displayed in Fig. 7. For individual samples, the particle sizes are approximately log-normally distributed (skewness 2.3–5.5), often showing a slight bimodality, with a small maximum (approx. 12 µm) on the high end of the distributions. The latter can be ascribed to harder and larger silt size particles of quartz and feldspars. The greatest number of particles are tightly clustered about their mean diameters, resulting in high but variable kurto-sis values (4.6–44.0). The geometric mean diameters for the particles lie in the small range of 2.1–3.7 µm, implying sim-ilar mineralogy and hardness. The mean aspect ratios of the particles also fall in a tight range of 1.40–1.48, with a mean value of 1.43.
5 Summary and conclusions
The impact of soil dust from natural and anthropogenic sources on climate and air quality has been recognized on a global scale (Sokolik and Toon, 1996; Tegen and Fung, 1995). However, the regional fine-scale processes of min-eral dust emissions and their effect on environmental pro-cesses and human health are poorly quantified in the study region because of the spatial distribution of detailed miner-alogical, physical and chemical properties of the surface soils at coastal dust source regions (“hot spots”) that were previ-ously not available.
The application of a range of techniques for the analysis of properties of soil samples allows for a better
understand-Figure 7.Average and standard deviations of particle sizes, as well as size and shape statistics for 13 sieved samples<38 µm as mea-sured by CCSEM.
ing of mineral dust. However, the different analytical meth-ods often provide different results, as seen by comparing the XRD, electron microscopy and chemistry of the soils. In this study, the results from the XRD analysis gives a quartz per-centage of between approximately 19 and 44 % and sheet sil-icates (clays, micas) of between approximately 3 and 8 %. In contrast, the single particle analysis by CCSEM gives a quartz fraction of only up to approximately 10 %, whereas the sheet silicates always have the largest mineral percent-age, of up to approximately 72 %. This can lead to ambiguity in the interpretation of the mineralogical composition of the samples, which is evident even where the mineral compo-sition is investigated for the same size range, i.e.<38 µm particle diameter. Biases in XRD results can be related to the presence of partly amorphous sheet silicates with poor crys-tallization (Leinen et al., 1994; Formenti et al., 2011; Kan-dler et al., 2009; Engelbrecht et al., 2016) and a subsequent overestimation of the quartz fractions. Knowing the answers to such questions would be necessary for properly using the data to constrain or evaluate simulations with dust models. Similarly, the individual particle analysis by CCSEM pro-vides an overestimation of the clay fraction which can be attributed to surface coatings on the quartz and its under-estimation (Engelbrecht et al., 2009a, b, 2016). What is of importance when considering the application of these results in models, health studies and remote sensing is not only the mineralogical composition of the dust but also their miner-alogical interrelationships such as mineral clusters, mineral coatings and intergrowths.
quartz and feldspar (plagioclase, orthoclase), as well as lesser but variable amounts of amphibole (hornblende), pyroxene (aegirine-augite), carbonate (calcite, dolomite), clays (illite, palygorskite, kaolinite, smectite), and micas (muscovite, bi-otite), with traces of gypsum, halite, chlorite, epidote and ox-ides. The range of identified minerals is ascribed to the vari-ety of igneous and metamorphic provenance rocks along the escarpment to the east of the Red Sea coastal plain (Edgell, 2006). Similarly high fractions of quartz and feldspars were reported for Kuwait (Engelbrecht et al., 2009b) and to a lesser extent for Tallil, Tikr¯ıt and At T¯aj¯ı in Iraq. The samples from the Red Sea coastal region of Saudi Arabia differ sub-stantially from those from Afghanistan, Qatar, the UAE, Iraq and Kuwait because they contain substantially less calcite. They also contain much less dolomite than the sample from Al Asad in Iraq. These deviations in composition could be as-cribed to differences in provenance and geology. The coastal plain is bounded by the Red Sea in the west, with the moun-tains of Midyan, Ash Shifa and Asir forming an escarpment to the east and the provenance for water-borne sediments to the wadis along the coastal plain. Since the igneous and metamorphic source rocks are composed of a wide range of minerals including quartz, feldspars, amphiboles, pyroxenes and micas, it can be assumed that the partially weathered sed-iments transported to the coastal plain during flash floods will contain similar minerals, which can in turn be suspended as mineral dust. In contrast, the samples collected in Kuwait, Iraq and Afghanistan are from extensive flat-lying areas and contain minerals such as quartz, calcite and dolomite from local sedimentary rocks.
Djibouti lies along the Great Rift Valley along the west coast of the Gulf of Aden and close to igneous and metamor-phic rock formations of the Nubian Plate, separated from the petrographically similar Arabian Plate by the Red Sea. Both regions contain rock formations with substantial amounts of pyroxene, amphibole and plagioclase. This at least in part explains the similarity of soils and dust at Djibouti to those along the coastal plain of Saudi Arabia. The mineralogical content of the soils was found to be closely related to the regional geology.
Particle size analysis on the sampled soils showed them to contain too much sand and too little silt to be considered major globally important sources of airborne dust, compared
to renowned global sources such as the Bodélé Depression and silt-covered regions of the northwest USA (Engelbrecht et al., 2012; Engelbrecht and Moosmüller, 2014). The low silt content in the investigated samples suggests that the dust plume generated from the Red Sea coastal region is enriched by the coarse dust fraction that deposits quickly. As seen from atmospheric observations, the coastal region is the ori-gin of frequent dust plumes over the Red Sea, probably due to frequent strong wind gusts. This mostly coarse dust could not be transported the vast distances to the Red Sea and di-rectly deposited there, thus affecting marine life. Our analy-sis revealed that the samples contain compounds of nitrogen, phosphorus and iron, which are essential nutrients to marine life (Guerzoni et al., 1997; Migon et al., 2001). The integra-tion of analytical informaintegra-tion on dust mineralogy and min-eralogical interrelationships, chemistry, and physical proper-ties of soils provides a better understanding of their potential impact on the communities living along the Red Sea (Edgell, 2006; UCAR/NCAR, 2003; Washington et al., 2003). The results from this study can also provide improvements to the input of climate forecasting and dust emission models. The 13 chemical source profiles of this study will complement those of soil samples in source attribution studies collected in other regions of the Middle East (Engelbrecht et al., 2009b). Analytical methods developed in this phase of the dust program will be applied for analysis of dust samples de-posited from the atmosphere for aerosol characterization studies in the Red Sea coastal region. These will allow for further assessment of the impact of elevated dust concen-trations on regional climate, marine ecology, air quality and health.
6 Data availability
Appendix A
Table A1.Major, minor and trace element concentrations (Conc.) and analytical uncertainties (Unc.) of grab samples S1 to S3 collected near Al Nasaif and S4 to S6 collected near Ar R¯ayis, all along the Red Sea coastal region. Also tabulated are elemental mass ratios, statistics of the individual particle sizes and morphology as measured by CCSEM.
Sample no. S1 S2 S3 S4 S5 S6
Conc. Unc. Conc. Unc. Conc. Unc. Conc. Unc. Conc. Unc. Conc. Unc.
Major and minor elements as oxides (%)
SiO2 63.795 ± 3.190 70.302 ± 3.515 74.337 ± 3.717 65.436 ± 3.272 74.872 ± 3.744 77.668 ± 3.883
TiO2 1.577 ± 0.079 1.700 ± 0.085 2.536 ± 0.127 1.300 ± 0.065 1.237 ± 0.062 1.511 ± 0.076
Al2O3 6.768 ± 0.338 5.195 ± 0.260 4.664 ± 0.233 4.367 ± 0.218 7.260 ± 0.363 4.710 ± 0.236
Fe2O3 8.195 ± 0.410 7.777 ± 0.389 10.497 ± 0.525 6.535 ± 0.327 6.936 ± 0.347 7.584 ± 0.379
MnO 0.112 ± 0.006 0.119 ± 0.006 0.135 ± 0.007 0.109 ± 0.005 0.123 ± 0.006 0.144 ± 0.007
MgO 2.903 ± 0.145 3.137 ± 0.157 2.478 ± 0.124 2.741 ± 0.137 2.824 ± 0.141 2.767 ± 0.138
CaO 1.723 ± 0.086 1.200 ± 0.060 0.895 ± 0.045 0.900 ± 0.045 1.249 ± 0.062 0.909 ± 0.045
Na2O 1.695 ± 0.085 1.577 ± 0.079 1.657 ± 0.083 1.494 ± 0.075 1.248 ± 0.062 1.659 ± 0.083
K2O 1.473 ± 0.074 1.372 ± 0.069 1.269 ± 0.063 1.198 ± 0.060 1.579 ± 0.079 1.484 ± 0.074
P2O5 0.406 ± 0.048 0.353 ± 0.047 0.400 ± 0.048 0.364 ± 0.048 0.291 ± 0.046 0.403 ± 0.048
Total 88.649 92.734 98.867 84.444 97.620 98.838
Trace elements (ppm)
Li 17 ± 1 21 ± 1 15 ± 1 19 ± 1 24 ± 1 22 ± 1
V 183 ± 9 182 ± 9 242 ± 12 161 ± 8 166 ± 8 191 ± 10
Cr 114 ± 6 103 ± 5 150 ± 8 83 ± 4 91 ± 5 98 ± 5
Co 30 ± 1 27 ± 1 26 ± 1 29 ± 1 28 ± 1 29 ± 1
Ni 55 ± 3 52 ± 3 46 ± 2 45 ± 2 48 ± 2 50 ± 3
Cu 29 ± 1 33 ± 2 24 ± 1 42 ± 2 40 ± 2 42 ± 2
Zn 39 ± 2 39 ± 2 40 ± 2 39 ± 2 47 ± 2 90 ± 5
Sr 294 ± 16 333 ± 18 358 ± 19 288 ± 15 285 ± 15 306 ± 16
Ba 318 ± 16 426 ± 21 342 ± 17 408 ± 20 502 ± 25 610 ± 30
Water-soluble ions (%)
Mg2+ 0.046 ± 0.001 0.038 ± 0.001 0.027 ± 0.001 0.036 ± 0.001 0.044 ± 0.001 0.143 ± 0.004
Ca2+ 0.171 ± 0.022 0.106 ± 0.014 0.071 ± 0.009 0.107 ± 0.014 0.162 ± 0.021 0.455 ± 0.058
Na+ 0.024 ± 0.001 0.005 ± 0.001 0.007 ± 0.001 0.005 ± 0.001 0.008 ± 0.001 0.025 ± 0.003
K+ 0.020
± 0.002 0.010 ± 0.001 0.008 ± 0.001 0.011 ± 0.001 0.025 ± 0.002 0.037 ± 0.004
Cl− 0.092 ± 0.004 0.000 ± 0.001 0.000 ± 0.001 0.000 ± 0.001 0.040 ± 0.002 0.222 ± 0.010
SO24− 0.078 ± 0.001 0.031 ± 0.001 0.017 ± 0.001 0.126 ± 0.002 0.131 ± 0.002 0.466 ± 0.007
PO34− 0.002 ± 0.001 0.002 ± 0.001 0.000 ± 0.001 0.000 ± 0.001 0.002 ± 0.001 0.006 ± 0.004
NO−3 0.018 ± 0.002 0.006 ± 0.001 0.011 ± 0.001 0.016 ± 0.002 0.019 ± 0.002 0.076 ± 0.007
Mass ratios
Si/Al 8.321 11.946 14.071 13.227 9.105 14.558
Ca/Al 0.344 0.312 0.259 0.279 0.233 0.261
Fe/Al 1.600 1.978 2.974 1.977 1.262 2.128
Particle diameter from CCSEM measurements (approx. 2000 particles) (µm)
Geom. mean (µm) 2.81 2.12 3.50 2.24 2.53 2.35
Arith. mean (µm) 3.66 2.72 6.75 3.25 3.29 3.00
Skewness 4.57 4.32 2.34 5.04 5.44 5.51
Kurtosis 28.85 25.20 4.63 29.43 40.11 44.00
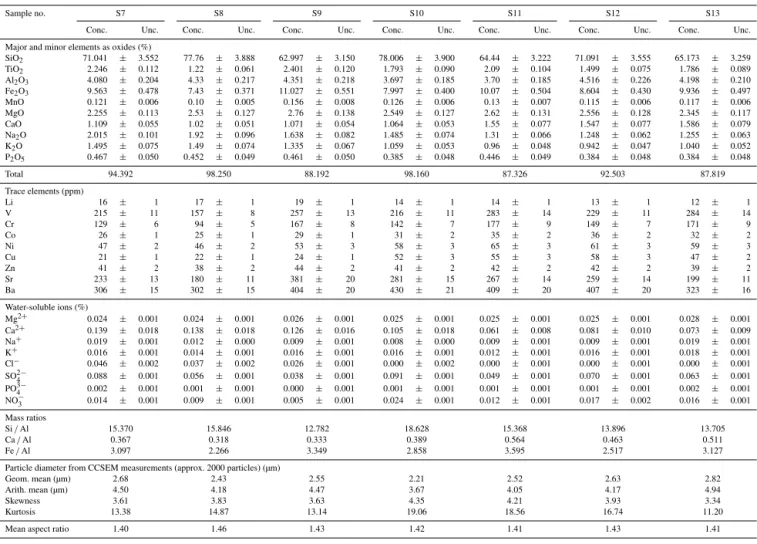
Table A2.Major, minor and trace element concentrations (Conc.) and analytical uncertainties (Unc.) of grab samples S7 to S9 collected near Yanbu and S10 to S13 near Mecca, all along the Red Sea coastal region. Also tabulated are elemental mass ratios, statistics of the individual particle size and morphology as measured by CCSEM.
Sample no. S7 S8 S9 S10 S11 S12 S13
Conc. Unc. Conc. Unc. Conc. Unc. Conc. Unc. Conc. Unc. Conc. Unc. Conc. Unc. Major and minor elements as oxides (%)
SiO2 71.041 ± 3.552 77.76 ± 3.888 62.997 ± 3.150 78.006 ± 3.900 64.44 ± 3.222 71.091 ± 3.555 65.173 ± 3.259 TiO2 2.246 ± 0.112 1.22 ± 0.061 2.401 ± 0.120 1.793 ± 0.090 2.09 ± 0.104 1.499 ± 0.075 1.786 ± 0.089 Al2O3 4.080 ± 0.204 4.33 ± 0.217 4.351 ± 0.218 3.697 ± 0.185 3.70 ± 0.185 4.516 ± 0.226 4.198 ± 0.210 Fe2O3 9.563 ± 0.478 7.43 ± 0.371 11.027 ± 0.551 7.997 ± 0.400 10.07 ± 0.504 8.604 ± 0.430 9.936 ± 0.497 MnO 0.121 ± 0.006 0.10 ± 0.005 0.156 ± 0.008 0.126 ± 0.006 0.13 ± 0.007 0.115 ± 0.006 0.117 ± 0.006 MgO 2.255 ± 0.113 2.53 ± 0.127 2.76 ± 0.138 2.549 ± 0.127 2.62 ± 0.131 2.556 ± 0.128 2.345 ± 0.117 CaO 1.109 ± 0.055 1.02 ± 0.051 1.071 ± 0.054 1.064 ± 0.053 1.55 ± 0.077 1.547 ± 0.077 1.586 ± 0.079 Na2O 2.015 ± 0.101 1.92 ± 0.096 1.638 ± 0.082 1.485 ± 0.074 1.31 ± 0.066 1.248 ± 0.062 1.255 ± 0.063 K2O 1.495 ± 0.075 1.49 ± 0.074 1.335 ± 0.067 1.059 ± 0.053 0.96 ± 0.048 0.942 ± 0.047 1.040 ± 0.052 P2O5 0.467 ± 0.050 0.452 ± 0.049 0.461 ± 0.050 0.385 ± 0.048 0.446 ± 0.049 0.384 ± 0.048 0.384 ± 0.048
Total 94.392 98.250 88.192 98.160 87.326 92.503 87.819
Trace elements (ppm)
Li 16 ± 1 17 ± 1 19 ± 1 14 ± 1 14 ± 1 13 ± 1 12 ± 1
V 215 ± 11 157 ± 8 257 ± 13 216 ± 11 283 ± 14 229 ± 11 284 ± 14
Cr 129 ± 6 94 ± 5 167 ± 8 142 ± 7 177 ± 9 149 ± 7 171 ± 9
Co 26 ± 1 25 ± 1 29 ± 1 31 ± 2 35 ± 2 36 ± 2 32 ± 2
Ni 47 ± 2 46 ± 2 53 ± 3 58 ± 3 65 ± 3 61 ± 3 59 ± 3
Cu 21 ± 1 22 ± 1 24 ± 1 52 ± 3 55 ± 3 58 ± 3 47 ± 2
Zn 41 ± 2 38 ± 2 44 ± 2 41 ± 2 42 ± 2 42 ± 2 39 ± 2
Sr 233 ± 13 180 ± 11 381 ± 20 281 ± 15 267 ± 14 259 ± 14 199 ± 11
Ba 306 ± 15 302 ± 15 404 ± 20 430 ± 21 409 ± 20 407 ± 20 323 ± 16
Water-soluble ions (%)
Mg2+ 0.024 ± 0.001 0.024 ± 0.001 0.026 ± 0.001 0.025 ± 0.001 0.025 ± 0.001 0.025 ± 0.001 0.028 ± 0.001 Ca2+ 0.139 ± 0.018 0.138 ± 0.018 0.126 ± 0.016 0.105 ± 0.018 0.061 ± 0.008 0.081 ± 0.010 0.073 ± 0.009 Na+ 0.019 ± 0.001 0.012 ± 0.000 0.009 ± 0.001 0.008 ± 0.000 0.009 ± 0.001 0.009 ± 0.001 0.019 ± 0.001 K+ 0.016 ± 0.001 0.014 ± 0.001 0.016 ± 0.001 0.016 ± 0.001 0.012 ± 0.001 0.016 ± 0.001 0.018 ± 0.001 Cl− 0.046 ± 0.002 0.037 ± 0.002 0.026 ± 0.001 0.000 ± 0.002 0.000 ± 0.001 0.000 ± 0.001 0.000 ± 0.001 SO24− 0.088 ± 0.001 0.056 ± 0.001 0.038 ± 0.001 0.091 ± 0.001 0.049 ± 0.001 0.070 ± 0.001 0.063 ± 0.001 PO34− 0.002 ± 0.001 0.001 ± 0.001 0.000 ± 0.001 0.001 ± 0.001 0.001 ± 0.001 0.001 ± 0.001 0.002 ± 0.001 NO−3 0.014 ± 0.001 0.009 ± 0.001 0.005 ± 0.001 0.024 ± 0.001 0.012 ± 0.001 0.017 ± 0.002 0.016 ± 0.001 Mass ratios
Si/Al 15.370 15.846 12.782 18.628 15.368 13.896 13.705
Ca/Al 0.367 0.318 0.333 0.389 0.564 0.463 0.511
Fe/Al 3.097 2.266 3.349 2.858 3.595 2.517 3.127
Particle diameter from CCSEM measurements (approx. 2000 particles) (µm)
Geom. mean (µm) 2.68 2.43 2.55 2.21 2.52 2.63 2.82
Arith. mean (µm) 4.50 4.18 4.47 3.67 4.05 4.17 4.94
Skewness 3.61 3.83 3.63 4.35 4.21 3.93 3.34
Kurtosis 13.38 14.87 13.14 19.06 18.56 16.74 11.20
The Supplement related to this article is available online at doi:10.5194/acp-16-11991-2016-supplement.
Author contributions. Georgiy Stenchikov formulated the problem, designed the research project and supported experimental activities; Johann P. Engelbrecht advised on aerosol analysis and instrumenta-tion; Weichun Tao defined the dust source areas using satellite ob-servations; P. Jish Prakash conducted measurements, analyzed and combined results; Tahir Yapici and Bashir Warsama helped with in-strumentation in the Kaust Core Lab. P. Jish Prakash, Johann P. En-gelbrecht and Georgiy Stenchikov wrote different parts of the paper.
Acknowledgements. This research, including the chemical and mineralogical analysis, is supported by internal funding from the King Abdullah University of Science and Technology (KAUST). For chemical analyses, this research used the resources of the KAUST core lab. We acknowledge the contribution from the collaborating laboratories of the RJ Lee Group and Desert Research Institute.
Edited by: P. Formenti
Reviewed by: K. Kandler and one anonymous referee
References
Aba-Husayn, M. M., Dixon, J. B., and Lee, S. Y.: Mineralogy of Saudi Arabian Soils: Southwestern Region, Soil Sci. Soc. Am. J., 44, 643–649, doi:10.2136/sssaj1980.03615995004400030043x, 1980.
Acosta, F., Ngugi, D. K., and Stingl, U.: Diversity of picoeukaryotes at an oligotrophic site off the Northeastern Red Sea Coast, Aquat. Biosyst., 9, 16, doi:10.1186/2046-9063-9-16, 2013.
Al-Farraj, A. S.: The mineralogy of clay fractions in the soils of the southern region of Jazan, Saudi Arabia, J. Agron., 7, 115–126, 2008.
Bennett, C. M., McKendry, I. G., Kelly, S., Denike, K., and Koch, T.: Impact of the 1998 Gobi dust event on hospital admissions in the Lower Fraser Valley, British Columbia, Sci. Total Environ., 366, 918–925, doi:10.1016/j.scitotenv.2005.12.025, 2006. Bennion, P., Hubbard, R., O’Hara, S., Wiggs, G., Wegerdt, J.,
Lewis, S., Small, I., van der Meer, J., and Upshur, R.: The impact of airborne dust on respiratory health in children liv-ing in the Aral Sea region, Int. J. Epidemiol., 36, 1103–1110, doi:10.1093/ije/dym195, 2007.
Brindley, H., Osipov, S., Bantges, R., Smirnov, A., Banks, J., Levy, R., Jish Prakash, P., and Stenchikov, G.: An assessment of the quality of aerosol retrievals over the Red Sea and eval-uation of the climatological cloud-free dust direct radiative ef-fect in the region, J. Geophys. Res.-Atmos., 120, 2015JD023282, doi:10.1002/2015JD023282, 2015.
Bristow, C. S., Hudson-Edwards, K. A., and Chappell, A.: Fertiliz-ing the Amazon and equatorial Atlantic with West African dust, Geophys. Res. Lett., 37, L14807, doi:10.1029/2010GL043486, 2010.
Buseck, P. R., Jacob, D. J., Pósfai, M., Li, J., and Anderson, J. R.: Minerals in the air: An environmental perspective, International Geology Review, Symposium, Stanford, California, 1999. Caquineau, S., Magonthier, M.-C., Gaudichet, A., and Gomes, L.:
An improved procedure for the X-ray diffraction analysis of low-mass atmospheric dust samples, Eur. J. Mineral., 9, 157–166, 1997.
Chung, F. H.: Quantitative interpretation of X-ray diffraction pat-terns of mixtures. I. Matrix-flushing method for quantitative multicomponent analysis, J. Appl. Crystallogr., 7, 519–525, doi:10.1107/S0021889874010375, 1974.
De Longueville, F., Hountondji, Y. C., Henry, S., and Ozer, P.: What do we know about effects of desert dust on air quality and human health in West Africa compared to other regions?, Sci. Total En-viron., 409, 1–8, 2010.
Edgell, H. S.: Arabian Deserts, Nature, Origin and Evolution, Springer, Dordrecht, the Netherlands, 592 pp., 2006.
Engelbrecht, J. P. and Moosmüller, H.: Mobile Aerosol Monitor-ing System for Department of Defense – Continuous Aerosol and Aerosol Optics Measurement in Theater, U.S. Army Med-ical Research and Materiel Command, Fort Detrick, Maryland Report W81XWH-11-2-0220, 1–229, 2014.
Engelbrecht, J. P., McDonald, E. V., Gillies, J. A., Jayanty, R. K. M., Casuccio, G., and Gertler, A. W.: Characterizing mineral dusts and other aerosols from the Middle East – Part 1: Ambient sam-pling, Inhalation Toxicol., 21, 297–326, 2009a.
Engelbrecht, J. P., McDonald, E. V., Gillies, J. A., Jayanty, R. K. M., Casuccio, G., and Gertler, A. W.: Characterizing mineral dusts and other aerosols from the Middle East – Part 2: Grab samples and re-suspensions, Inhalation Toxicol., 21, 327–336, 2009b. Engelbrecht, J. P., Gillies, J. A., Etyemezian, V., Kuhns, H., Baker,
S. E., Zhu, D., Nikolich, G., and Kohl, S. D.: Controls on mineral dust emissions at four arid locations in the western USA, Aeolian Res., 6, 41–54, 2012.
Engelbrecht, J. P., Moosmüller, H., Pincock, S., Jayanty, R. K. M., Lersch, T., and Casuccio, G.: Technical note: Mineralogical, chemical, morphological, and optical interrelationships of min-eral dust re-suspensions, Atmos. Chem. Phys., 16, 10809–10830, doi:10.5194/acp-16-10809-2016, 2016.
Esteve, V., Rius, J., Ochando, L. E., and Amigó, J. M.: Quantita-tive x-ray diffraction phase analysis of coarse airborne particu-late collected by cascade impactor sampling, Atmos. Environ., 31, 3963–3967, doi:10.1016/S1352-2310(97)00257-4, 1997. Formenti, P., Rajot, J. L., Desboeufs, K., Saïd, F., Grand, N.,
Chevaillier, S., and Schmechtig, C.: Airborne observations of mineral dust over western Africa in the summer Monsoon season: spatial and vertical variability of physico-chemical and optical properties, Atmos. Chem. Phys., 11, 6387–6410, doi:10.5194/acp-11-6387-2011, 2011.
Fryrear, D. W.: Long-term effect of erosion and cropping on soil productivity, Spec. Pap.-Geol. Soc. Am., 186, 253–260, doi:10.1130/SPE186-p253, 1981.
Gee, G. W. and Or, D.: Particle-size analysis, in: Methods of Soil Analysis: Part 4 – Physical Methods, No. 5, edited by: Dane, J. H. and Topp, G. C., Soil Science Society of America, Madison, WI, 255–293, 2002.
Goldstein, J., Newbury, D., Joy, D., Lyman, C., Echlin, P., Lifshin, E., Sawyer, L., and Michael, J.: Scanning Electron Microscopy and X-Ray Microanalysis, 3rd Edn., Springer, 689 pp., 2003. Goudie, A. S. and Middleton, N. J.: Desert Dust in the Global
Sys-tem, Springer, Germany, 287 pp., 2006.
Grainger, D.: The Geological Evolution of Saudi Arabia, a Voyage through Space and Time Saudi Geological Survey, Jeddah, Saudi Arabia, ISBNS 9781905755073, 264 pp., 2007.
Greely, R. and Iversen, J. D.: Wind as a geological process on Earth, Mars, and Venus, Cambridge University Press, Cam-bridge, 333 pp., 1985.
Grell, G. A., Peckham, S. E., Schmitz, R., McKeen, S. A., Frost, G., Skamarock, W. C., and Eder, B.: Fully coupled “online” chem-istry within the WRF model, Atmos. Environ., 39, 6957–6975, doi:10.1016/j.atmosenv.2005.04.027, 2005.
Guerzoni, S., Molinaroli, E., and Chester, R.: Saharan dust inputs to the western Mediterranean Sea: depositional patterns, geochem-istry and sedimentological implications, Deep-Sea Res. Pt. II, 44, 631–654, 1997.
Hagen, L. J. and Woodruff, N. P.: Air pollution from dust storms in the Great Plains, Atmos. Environ., 7, 323–332, 1973.
Haywood, J. and Boucher, O.: Estimates of the direct and indirect radiative forcing due to tropospheric aerosols: A review, Rev. Geophys., 38, 513–543, doi:10.1029/1999RG000078, 2000. Hsu, N. C., Tsay, S. C., King, M. D., and Herman, J. R.: Aerosol
properties over bright-reflecting source regions, IEEE T. Geosci., 42, 557–569, 2004.
Huang, J., Minnis, P., Lin, B., Wang, T., Yi, Y., Hu, Y., Sun-Mack, S., and Ayers, K.: Possible influences of Asian dust aerosols on cloud properties and radiative forcing observed from MODIS and CERES, Geophys. Res. Lett., 33, L06824, doi:10.1029/2005GL024724, 2006.
Huang, J., Wang, T., Wang, W., Li, Z., and Yan, H.: Cli-mate effects of dust aerosols over East Asian arid and semi-arid regions, J. Geophys. Res.-Atmos., 119, 11398–11416, doi:10.1002/2014JD021796, 2014.
Jiang, H., Farrar, J. T., Beardsley, R. C., Chen, R., and Chen, C.: Zonal surface wind jets across the Red Sea due to mountain gap forcing along both sides of the Red Sea, Geophys. Res. Lett., 36, L19605, doi:10.1029/2009GL040008, 2009.
Jickells, T. D., An, Z. S., Andersen, K. K., Baker, A. R., Bergametti, G., Brooks, N., Cao, J. J., Boyd, P. W., Duce, R. A., Hunter, K. A., Kawahata, H., Kubilay, N., laRoche, J., Liss, P. S., Mahowald, N., Prospero, J. M., Ridgwell, A. J., Tegen, I., and Torres, R.: Global iron connections between desert dust, ocean biogeochem-istry, and climate, Science, 308, 67–71, 2005.
Jish Prakash, P., Stenchikov, G., Kalenderski, S., Osipov, S., and Bangalath, H.: The impact of dust storms on the Arabian Penin-sula and the Red Sea, Atmos. Chem. Phys., 15, 199–222, doi:10.5194/acp-15-199-2015, 2015.
Kalenderski, S., Stenchikov, G., and Zhao, C.: Modeling a typical winter-time dust event over the Arabian Peninsula and the Red Sea, Atmos. Chem. Phys., 13, 1999–2014, doi:10.5194/acp-13-1999-2013, 2013.
Kandler, K., Schütz, L., Deutscher, C., Ebert, M., Hofmann, H., Jäckel, S., Jaenicke, R., Knippertz, P., Lieke, K., Massling, A., Petzold, A., Schladitz, A., Weinzierl, B., Wiedensohler, A., Zorn, S., and Weinbruch, S.: Size distribution, mass concentration, chemical and mineralogical composition and derived optical
pa-rameters of the boundary layer aerosol at Tinfou, Morocco, dur-ing SAMUM 2006, Tellus B, 61, 32–50, 2009.
Kerr, P. F.: Optical Mineralogy, 3rd Edn., McGraw-Hill Book Com-pany, Inc., USA, 442 pp., 1959.
Kok, J. F.: A scaling theory for the size distribution of emitted dust aerosols suggests climate models underestimate the size of the global dust cycle, P. Natl. Acad. Sci. USA, 108, 1016–1021, 2011a.
Kok, J. F.: Does the size distribution of mineral dust aerosols depend on the wind speed at emission?, Atmos. Chem. Phys., 11, 10149– 10156, doi:10.5194/acp-11-10149-2011, 2011b.
Kumar, R., Barth, M. C., Pfister, G. G., Naja, M., and Brasseur, G. P.: WRF-Chem simulations of a typical pre-monsoon dust storm in northern India: influences on aerosol optical proper-ties and radiation budget, Atmos. Chem. Phys., 14, 2431–2446, doi:10.5194/acp-14-2431-2014, 2014.
Leinen, M., Prospero, J. M., Arnold, E., and Blank, M.: Mineralogy of aeolian dust reaching the North Pacific Ocean 1. Sampling and analysis, J. Geophys. Res., 99, 21017–21023, 1994.
Mahowald, N., Engelstaedter, S., Luo, C., Sealy, A., Artaxo, P., Benitez-Nelson, C., Bonnet, S., Chen, Y., Chuang, P. Y., Cohen, D. D., Dulac, F., Herut, B., Johansen, A. M., Kubilay, N., Losno, R., Maenhaut, W., Paytan, A., Prospero, J. M., Shank, L. M., and Siefert, R. L.: Atmospheric iron deposition: Global distribution, variability and human perturbations, Ann. Rev. Mar. Sci., 1, 245– 278, 2009.
Marticorena, B.: Dust production mechanisms, in: Mineral Dust: A Key Player in the Earth System, edited by: Knippertz, P. and Stuut, J.-B. W., Springer Science+Business Media, Dordrecht, 93–120, 2014.
Marticorena, B. and Bergametti, G.: Modeling the atmospheric dust cycle: 1. Design of a soil-derived dust emission scheme, J. Geo-phys. Res.-Atmos., 100, 16415–16430, doi:10.1029/95JD00690, 1995.
Menéndez, I., Pérez-Chacón, E., Mangas, J., Tauler, E., Engel-brecht, J. P., Derbyshire, E., Cana, L., and Alonso, I.: Dust de-posits on La Graciosa Island (Canary Islands, Spain): Texture, mineralogy and a case study of recent dust plume transport, Catena, 117, 133–144, 2014.
Menut, L., Pérez, C., Haustein, K., Bessagnet, B., Prigent, C., and Alfaro, S.: Impact of surface roughness and soil texture on min-eral dust emission fluxes modeling, J. Geophys. Res.-Atmos., 118, 6505–6520, doi:10.1002/jgrd.50313, 2013.
Migon, C., Sandroni, V., and Béthoux, J. P.: Atmospheric input of anthropogenic phosphorus to the northwest Mediterranean under oligotrophic conditions, Mar. Environ. Res., 7, 1–14, 2001. Moosmüller, H., Engelbrecht, J. P., Skiba, M., Frey, G.,
Chakrabarty, R. K., and Arnott, W. P.: Single scattering albedo of fine mineral dust aerosols controlled by iron concentration, J. Geophys. Res., 117, D11210, doi:10.1029/2011JD016909, 2012. Muhs, D. R., Prospero, J. M., Baddock, M. C., and Gill, T. E.: Iden-tifying sources of aeolian mineral dust: Present and past, in: Min-eral Dust, A Key Player in the Earth System, edited by: Knip-pertz, P. and Stuut, J.-B. W., Springer Science+Business Media, Dordrecht, 51–74, 2014.
model-ing, Atmos. Chem. Phys., 12, 845–855, doi:10.5194/acp-12-845-2012, 2012.
Nihlen, T. and Lund, S. O.: Influence of Aeolian Dust on Soil Formation in the Aegean Area, Z. Geomorphol., 393, 341–361, 1995.
Oleson, K. W., Lawrence, D. M., Bonan, G. B., Flanner, M. G., Kluzek, E., Lawrence, P. J., Levis, S., Swenson, S. C., Thornton, P. E., Dai, A., Decker, M., Dickinson, R., Feddema, J., Heald, C. L., Hoffman, F., Lamarque, J., Mahowald, N., Niu, G., Qian, T., Randerson, J., Running, S., Sakaguchi, K., Slater, A., Stockli, R., Wang, A., Yang, Z., Zeng, X., and Zeng, X.: Technical De-scription of version 4.0 of the Community Land Model (CLM), NCAR Technical Note NCAR/TN-478+STR, 2010.
Osipov, S., Stenchikov, G., Brindley, H., and Banks, J.: Diurnal cycle of the dust instantaneous direct radiative forcing over the Arabian Peninsula, Atmos. Chem. Phys., 15, 9537–9553, doi:10.5194/acp-15-9537-2015, 2015.
Perlwitz, J. P., Pérez García-Pando, C., and Miller, R. L.: Predict-ing the mineral composition of dust aerosols – Part 2: Model evaluation and identification of key processes with observa-tions, Atmos. Chem. Phys., 15, 11629–11652, doi:10.5194/acp-15-11629-2015, 2015a.
Perlwitz, J. P., Pérez García-Pando, C., and Miller, R. L.: Predict-ing the mineral composition of dust aerosols – Part 1: Repre-senting key processes, Atmos. Chem. Phys., 15, 11593–11627, doi:10.5194/acp-15-11593-2015, 2015b.
Prospero, J. M., Ginoux, P., Torres, O., Nicholson, S. E., and Gill, T. E.: Environmental characterization of global sources of at-mospheric soil dust indentified with the NIMBUS 7 total ozone mapping spectrometer (TOMS) absorbing aerosol product, Rev. Geophys., 40, 1002, doi:10.1029/2000RG000095, 2002. Roquin, C., Freyssinet, P., Zeegers, H., and Tardy, Y.: Element
distribution patterns in laterites of southern Mali: Consequence for geochemical prospecting and mineral exploration, Appl. Geochem., 5, 303–315, 1990.
Rietveld, H. M.: A profile refinement method for nuclear and magnetic structures, J. Appl. Crystallogr., 2, 65–71, doi:10.1107/S0021889869006558, 1969.
Scheuvens, D. and Kandler, K.: On composition, morphology, and size distribution of airborne mineral dust, in: Mineral Dust, a Key Player in the Earth System, edited by: Knippertz, P. and Stuut, J.-B. W., Springer Science+Business Media, Dordrecht, 15–49, 2014.
Shadfan, H., Mashhady, A., Eter, A., and Hussen, A. A.: Mineral composition of selected soils in Saudi Arabia, J. Plant Nutr. Soil Sc., 147, 657–668, doi:10.1002/jpln.19841470603, 1984. Sokolik, I. N. and Toon, O. B.: Direct radiative forcing by
anthro-pogenic airborne mineral aerosols, Nature, 381, 681–683, 1996. Sokolik, I. N. and Toon, O. B.: Incorporation of mineralogical composition into models of the radiative properties of mineral aerosol from UV to IR wavelengths, J. Geophys. Res.-Atmos., 104, 9423–9444, doi:10.1029/1998JD200048, 1999.
Sturges, W. T., Harrison, R. M., and Barrie, L. A.: Semi-quantitative X-ray diffraction analysis of size fractionated atmospheric parti-cles, Atmos. Environ., 23, 1083–1098, 1989.
Tanaka, T. Y. and Chiba, M.: A numerical study of the contributions of dust source regions to the global dust budget, Global Planet. Change, 52, 88–104, 2006.
Tegen, I. and Fung, I.: Contribution to the atmospheric mineral aerosol load from land surface modification, J. Geophys. Res., 100, 18707–18726, 1995.
Twomey, S. A., Piepgrass, M., and Wolfe, T. L.: An assessment of the impact of pollution on global cloud albedo, Tellus B, 36, 5, doi:10.3402/tellusb.v36i5.14916, 2011.
UCAR/NCAR: Forecasting Dust Storms, National Center for At-mospheric Research, Boulder, National Center for AtAt-mospheric Research, Boulder, 1–67, 2003.
Viani, B. E., Al-Mashhady, A. S., and Dixon, J. B.: Mineralogy of Saudi Arabian Soils: Central Allu-vial Basins, Soil Sci. Soc. Am. J., 47, 149–157, doi:10.2136/sssaj1983.03615995004700010030x, 1983. Wang, W., Huang, J., Minnis, P., Hu, Y., Li, J., Huang, Z.,
Ay-ers, J. K., and Wang, T.: Dusty cloud properties and radiative forcing over dust source and downwind regions derived from A-Train data during the Pacific Dust Experiment, J. Geophys. Res.-Atmos., 115, D00H35, doi:10.1029/2010JD014109, 2010. Wang, Z., Ueda, H., and Huang, M.: A deflation module
for use in modeling long-range transport of yellow sand over East Asia, J. Geophys. Res.-Atmos., 105, 26947–26959, doi:10.1029/2000JD900370, 2000.
Washington, R. and Todd, M. C.: Atmospheric controls on min-eral dust emission from the Bodélé depression, Chad: The role of the low level jet, Geophys. Res. Lett., 32, L17701, doi:10.1029/2005GL023597, 2005.
Washington, R., Todd, M. C., Middleton, N. J., and Goudie, A. S.: Dust-storm source areas determined by the total ozone monitor-ing spectrometer and surface observations, Ann. Assoc. Am. Ge-ogr., 93, 297–313, 2003.
Webb, N. P. and Strong, C. L.: Soil erodibility dynamics and its rep-resentation for wind erosion and dust emission models, Aeolian Res., 3, 165–179, doi:10.1016/j.aeolia.2011.03.002, 2011. Weese, C. B. and Abraham, J. H.: Potential health implications
as-sociated with particulate matter exposure in deployed settings in Southwest Asia, Inhalation Toxicol., 21, 291–296, 2009. Zender, C. S., Bian, H., and Newman, D.: Mineral Dust