BGD
6, 4829–4863, 2009Influence of hydrological fluxes on bio-geochemical
processes
N. Bougon et al.
Title Page
Abstract Introduction
Conclusions References
Tables Figures
◭ ◮
◭ ◮
Back Close
Full Screen / Esc
Printer-friendly Version
Interactive Discussion Biogeosciences Discuss., 6, 4829–4863, 2009
www.biogeosciences-discuss.net/6/4829/2009/ © Author(s) 2009. This work is distributed under the Creative Commons Attribution 3.0 License.
Biogeosciences Discussions
Biogeosciences Discussionsis the access reviewed discussion forum ofBiogeosciences
Influence of hydrological fluxes on
bio-geochemical processes in a peatland
N. Bougon1,2,3, L. Aquilina1,3, C. Auterives1,3, and P. Vandenkoornhuyse2,3
1
CAREN Research federation – UMR 6118 G ´eosciences, Universit ´e Rennes 1-CNRS, Campus de Beaulieu, Avenue Leclerc, Rennes, France
2
CAREN Research federation – UMR 6553 EcoBio, Universit ´e Rennes 1-CNRS, Campus de Beaulieu, Avenue Leclerc, Rennes, France
3
Universit ´e Europ ´eenne de Bretagne, UEB (European University of Brittany), France
Received: 19 March 2009 – Accepted: 6 April 2009 – Published: 6 May 2009
Correspondence to: L. Aquilina ([email protected])
BGD
6, 4829–4863, 2009Influence of hydrological fluxes on bio-geochemical
processes
N. Bougon et al.
Title Page
Abstract Introduction
Conclusions References
Tables Figures
◭ ◮
◭ ◮
Back Close
Full Screen / Esc
Printer-friendly Version
Interactive Discussion
Abstract
Factors influencing the dynamics of nitrate and sulphate concentration observed in a south Normandy peatland were determined experimentally. The effects of high or low nitrate input, and oxic or anoxic conditions on microbial activity were investigated in bioreactors, using peat samples from field sites influenced by different hydrologic 5
regimes. Site S, unlike site G, was characterized by the presence of hydrogeological gradients inducing water fluxes from river to peat during most of the hydrological cycle. Peat samples from both sites were subjected to similar experimental conditions to dis-tinguish between the chemical effects (NO−3, O2) and the physical effects (hydrologic regimes).
10
[Cl−], [SO2−
4 ] and [NO−3]were monitored for 240 h. Nitrate was significantly reduced
in most experiments: (1) Removal of 70% of the initial nitrate content after 51 h under anoxic conditions; (2) Complete nitrate reduction after 240 h in soil from the S site. This reduction was interpreted as heterotrophic denitrification. Sulphate monitoring re-vealed that 400 mg/L were produced in peat from site S under aerobic conditions. Sul-15
phate changes under anaerobiosis were not significant or, for samples from G, under any conditions. Clear differences in chloride content (deviance analysis,P <0.05), sul-phate concentration and nitrate consumption dynamics (deviance analysis,P <0.0001) were observed between the G and S sites. Our results demonstrate that the rates of nitrate removal and sulphate production differ between peat samples from sites sub-20
jected to different hydrological regimes, even under similar redox and nitrate conditions. This experimental approach highlights the effect of hydrological fluxes leading to mod-ifications of microbial activity which are likely related to changes in microbial diversity.
1 Introduction
In wetlands, biologically active components (O, N, S, and Fe) are controlled by micro-25
BGD
6, 4829–4863, 2009Influence of hydrological fluxes on bio-geochemical
processes
N. Bougon et al.
Title Page
Abstract Introduction
Conclusions References
Tables Figures
◭ ◮
◭ ◮
Back Close
Full Screen / Esc
Printer-friendly Version
Interactive Discussion et al., 1999; Ostrom et al., 2002; Cannavo et al., 2004). Chemical conditions and
the composition of microbial communities are thus intimately linked (Dassonville and Renault, 2002; Stumm and Morgan, 1996; Torsvik and Øvre ˚as, 2002). Abiotic fac-tors such as pH, organic carbon and N-oxides content, temperature, bulk density, and soil textures can affect the activity and population dynamics of soil microorganisms 5
(Cl ´ement et al., 2002; Cavigelli and Robertson, 2000; Dommergues and Mangenot, 1970; Knowles, 1982; Nannipieri et al., 2003). The metabolic capabilities and inter-actions of microorganisms greatly influence biogeochemical processes. However, the complex interactions between microbial population ecology and abiotic factors are little understood at present.
10
Relationships between chemical conditions, microbial processes and physical pa-rameters such as water fluxes have been addressed only recently (e.g. Chapelle, 2000; Cl ´ement et al., 2002, 2003; Ginn et al., 2002; Vidon and Hill, 2004). Such parameters are related to landscape physical structure and appear to be determinant in controlling the spatial variability of these biogeochemical processes (Hedin et al., 1998; Hill et al., 15
2000; Cl ´ement et al., 2002, 2003; Packman et al., 2004; Sabater et al., 2003). Several hydrological models, focusing on the prediction of microbial transport and the effect of microbial mats on water fluxes in natural porous and high nutrient media, have been proposed (e.g. Harvey et al., 1993; Murphy and Ginn, 2000; Ginn et al., 2002; Rock-hold et al., 2004). However, few studies deal with unsaturated or variably saturated 20
systems (Rockhold et al., 2004). To date, the effect of water fluxes on biological ac-tivities, independently of redox conditions, has not been simultaneously addressed in both laboratory and field comprehensive studies.
Peatlands are specific ecosystems in which biological and chemical functioning is essentially maintained by hydrological aspects. Limited hydrological fluctuations can 25
BGD
6, 4829–4863, 2009Influence of hydrological fluxes on bio-geochemical
processes
N. Bougon et al.
Title Page
Abstract Introduction
Conclusions References
Tables Figures
◭ ◮
◭ ◮
Back Close
Full Screen / Esc
Printer-friendly Version
Interactive Discussion peatland as a carbon sink. Before the vulnerability of such wetlands can be assessed,
the effects of hydrological fluctuations on the biogeochemical processes occurring in these environments need to be more thoroughly understood.
Field observations in peatlands in western France (Auterives et al., 2008; Auterives, 2007) revealed the sensitivity of biogeochemical cycles to hydrological fluxes and high-5
lighted the potential influence of water fluxes on microbial activity. The aim of this study was thus to distinguish between physical and chemical effects (water fluxes and nu-trient availability, respectively) on microbial activity and was focused on the activity of denitrifiers in peat soils. An experimental approach was used to determine the factors influencing spatiotemporal variability and the dynamics of nitrate and sulphate concen-10
trations observed in the field. The overall reactivity of peat samples from field sites under distinct hydrologic regimes and different chemical dynamics was tested experi-mentally by subjecting these samples to similar nitrate and redox conditions.
2 Material and methods
Our aim in the batch experiments was to reproduce the field observations, as regards S 15
and N changes, and to isolate the physical and chemical factors which might influence the chemical trends. Our hypothesis, based on hydrological monitoring in the field, was that the peat samples from different sites corresponded to different hydrological condi-tions, especially water fluxes and peat moisture which were both higher in the S site. Peat samples from the three different sites were subjected to similar chemical condi-20
BGD
6, 4829–4863, 2009Influence of hydrological fluxes on bio-geochemical
processes
N. Bougon et al.
Title Page
Abstract Introduction
Conclusions References
Tables Figures
◭ ◮
◭ ◮
Back Close
Full Screen / Esc
Printer-friendly Version
Interactive Discussion
2.1 Field description
2.1.1 Geological setting
The peatland site, which developed after the last glacial period, is located in south Normandy, 49◦15′N, 1◦20′W, in the “Marais du Cotentin et du Bessin” regional
natu-ral park. Peat thickness varies from 1 m close to the stream to 10 m in the center of 5
the peatland. This latter has developed in relation to an aquifer discharge zone and is mainly covered by herbaceous plant communities. The aquifer consists of a sandy geological formation (Mio – Pliocene) filling an 80 m thick graben. This sand aquifer is highly permeable and the basin is pumped to supply drinking water. The hydrolog-ical conditions in the peat aquifer are locally modified by the wells used for pumping. 10
The influence of hydrological conditions on peatland functioning was investigated by comparing the modified and non-modified zones.
2.1.2 Field equipment
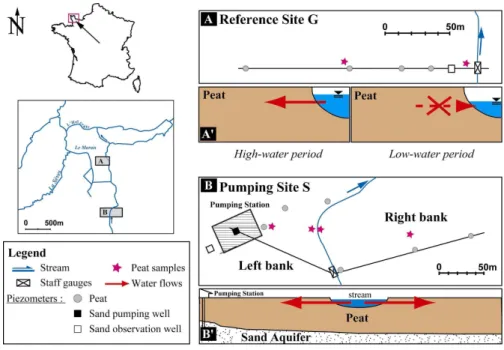
Hydrogeological and water chemistry parameters were monitored from 2002 to 2005 (Auterives, 2007). Two study sites were set up (Fig. 1). The first corresponded to a 15
pumped site (site S), in front of a pumping station. The second was located one kilo-meter downstream, beyond the influence of the pumping station, and was used as a reference site (G site). The hydrological fluxes in the two sites were determined by monitoring the river level by staffgauges and PVC piezometers which were set up at different depths (1.5 to 5 m) in the deep sand aquifer and in the actual peat. In this 20
latter, the piezometers were set up along a river-peat transect. The sand piezometric monitoring was made with deep boreholes (80–100 m) from the DDAF (RegionalDirec-tion of Agriculture and Forest) which intersect the sandy aquifer in pumping site S – left bank and in reference site G (Fig. 1). The stream water levels and the piezometric levels of the clay-rich layer, sand layer, and peat layer were monitored during the same 25
BGD
6, 4829–4863, 2009Influence of hydrological fluxes on bio-geochemical
processes
N. Bougon et al.
Title Page
Abstract Introduction
Conclusions References
Tables Figures
◭ ◮
◭ ◮
Back Close
Full Screen / Esc
Printer-friendly Version
Interactive Discussion 2005 (Auterives, 2007).
The hydraulic conductivity of the saturated peat was estimated using field tests. In the clay piezometers Slug tests were used. In the peat, two piezometer types were used: the previously described rigid PVC piezometers and mini-piezometers. Mini-piezometers were screened at the bottom (20 cm long) and were put into the peat 5
by hammering with a steel T-bar down to a depth of 1 m. 18 large permanent PVC pipes, 1.5 to 5 m depth, were tested once, 6 were tested twice and 26 temporary mini-piezometers covering the three sites were tested twice.
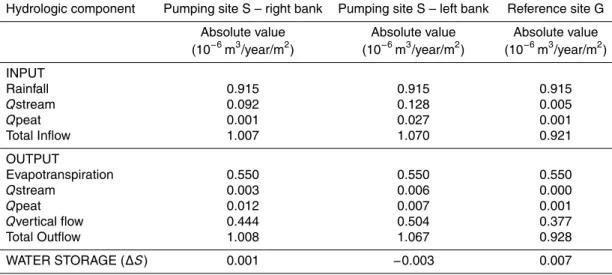
2.1.3 Hydrologic budget
A mass balance was used to describe and quantify the peatland hydrological budget 10
(Eq. 1) (Auterives, 2007). The mass balance was calculated on a peat section, from the stream and a more internal zone of the peatland. Precipitation (P) is an input and evapotranspiration (E) an output in the peatland water budget. QStream and QPeat are horizontal groundwater exchanged flows with the stream and the peatland respec-tively. QSand is the vertical groundwater exchanged flow with the underlying aquifer 15
through the basal clay layer. In the investigated sites, the water table remained below the ground surface, which limits runoffproduction Thus, Runoffwas neglected and all effective rainfall were considered as input in the peat groundwater. The canopy inter-ception was considered as negligible.
∆S =P −E±Qstream±Qsand±Qpeat (1)
20
where∆S (mm) is the variation in water storage of the peatland; P (mm) is precipitation;
E (mm) is the actual evapotranspiration;
QStream (mm) is the exchanged groundwater flow between the stream and the peat groundwater as estimated from Darcy’s law;
25
BGD
6, 4829–4863, 2009Influence of hydrological fluxes on bio-geochemical
processes
N. Bougon et al.
Title Page
Abstract Introduction
Conclusions References
Tables Figures
◭ ◮
◭ ◮
Back Close
Full Screen / Esc
Printer-friendly Version
Interactive Discussion QPeat (mm) is the exchanged peat groundwater flow of the investigated area with the
rest of the peatland as estimated from Darcy’s law.
Groundwater flows, direction and rate, were calculated using Darcy’s law. QStream andQPeat, horizontal groundwater flow, were calculated with the hydraulic conductiv-ity KPeat measured on field and the horizontal hydraulic gradient deduced from the 5
piezometric monitoring. Qsand, vertical groundwater flow throw the clay layer, was calculated with the hydraulic conductivity of the clay-rich layer KClay from the field measurements and the vertical hydraulic gradient deduced from the monitoring. The variation water storage (∆S) is reflected by the height of the water table (h) and the specific yield (Sy) as:
10
∆S = ∆h Sy (2)
where∆h(mm) is the head difference between the beginning and the end of the con-sidered period.
Hydrologic budget was quantified for the year 2004 was quantified (Table 1) on each site in a peat section from the middle to the stream of 3150 m2, 7320 m2and 3360 m2 15
on the pumping site S – left bank, pumping site S – right bank and reference site G respectively.
Meteorological data, precipitation and potential evapotranspiration were provided by M ´et ´eoFrance. Precipitation data from Meteofrance are 914.6 mm in 2004 at the local meteorological station. Potential evapotranspiration from Meteofrance data in 2004 is 20
722.8 mm. According to the Turc formula, the actual E equals to 549.5 mm which is 76% of the potentialE. Evapotranspiration dominates the outputs of the budget and represents more than 55% of the total outputs (Table 1).
2.1.4 Field chemical monitoring
Water chemistry parameters were carried out every two months from 2002 to 2005. 25
BGD
6, 4829–4863, 2009Influence of hydrological fluxes on bio-geochemical
processes
N. Bougon et al.
Title Page
Abstract Introduction
Conclusions References
Tables Figures
◭ ◮
◭ ◮
Back Close
Full Screen / Esc
Printer-friendly Version
Interactive Discussion sampled, filtered (0.22µm cellulose acetate filter capsule Sartorius) and analysed for
Cl−, SO2−
4 , and NO3through ionic chromatography Dionex DX-120) in the Geosciences
chemical laboratory with an uncertainty below 5% (Auterives, 2007).
2.2 Experimental batch design
Peat samples were collected with an auger in March 2004 at the 2 sites, close to (2 m) 5
and distant from (100 m) the stream (Fig. 1). Samples were collected on both sides of the stream (left and right banks) at pumping site S. The sampling depth varied from 50 to 80 cm. The 3 sites present different hydrologic characteristics. The left bank of site S is influenced by a permanent water influx (river to peat). Influx from the stream to site G only occurs during very high water periods. The right bank of site S represents 10
an intermediate situation.
The chemical composition of the water used in the experiments was similar to that of the stream. Stream water, because of potential microbial content, was not used. The soil to water ratio ranged from 1/10 to 1/20. The soil samples were stored at 4◦C for 2
days before the experiment. 15
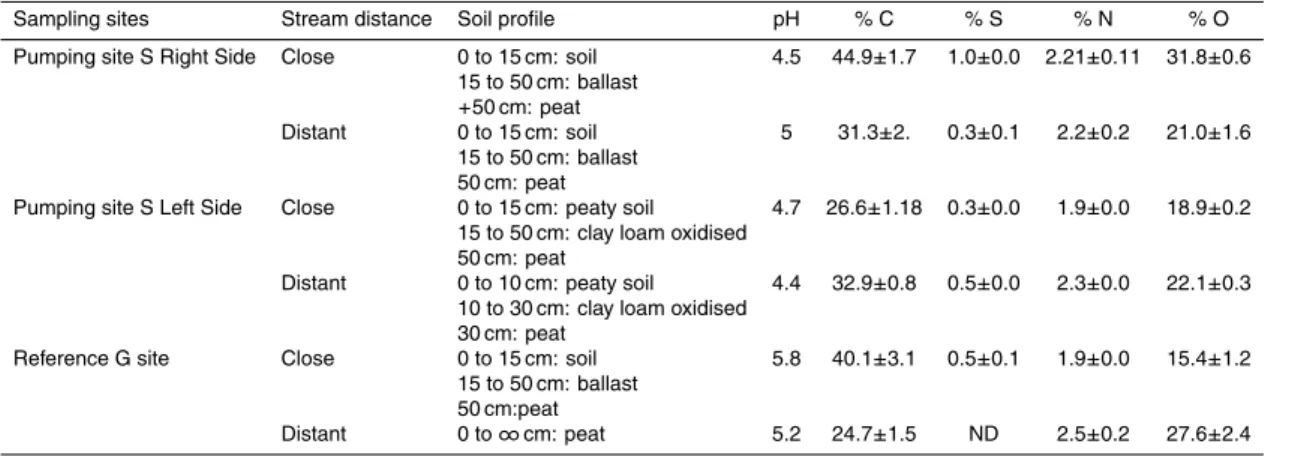
2.2.1 Peat sample characteristics
The soil chemical profile shows that the variation in redox conditions was dependent on the distance to the stream (Table 2). During sampling, large roots were removed and the soil was homogenized but not sieved in order to preserve soil microbial het-erogeneity. pH was determined by AFNOR NF X 31-103 method (Table 2). C-N-S-O 20
values were obtained with a CHNSO EA1108 Carlo-Erba apparatus.
2.2.2 Experimental procedure
BGD
6, 4829–4863, 2009Influence of hydrological fluxes on bio-geochemical
processes
N. Bougon et al.
Title Page
Abstract Introduction
Conclusions References
Tables Figures
◭ ◮
◭ ◮
Back Close
Full Screen / Esc
Printer-friendly Version
Interactive Discussion solution (40 mg/L of Cl− as NaCl). No nitrate was added to the low nitrate samples.
High nitrate concentrations were obtained by adding 30 mg/L of NO−3 (as NaNO3). The incubation conditions were either oxic (in an oxygen atmosphere) or anoxic (under a nitrogen atmosphere). Anaerobic conditions were ensured by flushing the ambient air in flasks 3 times with nitrogen. The flasks were shaken continuously throughout the 5
experiment to ensure moderate homogeneity. One hour before sampling, the flasks were stirred to homogenize the water content and then left still for the particles to settle. Abiotic controls consisted of sterilized peat samples in which the bacterial enzymes had been metabolically inhibited by gamma ray irradiation so that the soil physical structure remained unaltered. Ionization, involving a 60 kGray or 6 mrads treatment, was carried 10
out at the “Commissariat `a l’Energie Atomique” (CEA, Cadarache). The average dose of ionizing radiation required to inactivate a single colony forming unit is 30 Gray for Escherichia coli and around 6–7 kGray for Deinococcus radiodurans (Battista et al., 1999). Vegetative cells ofBacillus spp. cannot grow at 60 Gray andBacillus spores show a 5-order-of-magnitude decrease in viability following acute exposure to 200 to 15
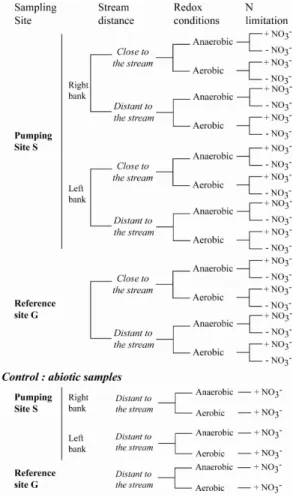
1000 Gray (Thornley et al., 1965). All abiotic control samples were subjected to the same procedures as the other sample series (Fig. 3). Potential variability related to peat heterogeneity was taken into account by performing triplicates for each experimental condition (nitrate addition, oxic or anoxic, sterilized. . . ). All figures and tables indicate the mean of the triplicate value and its standard error.
20
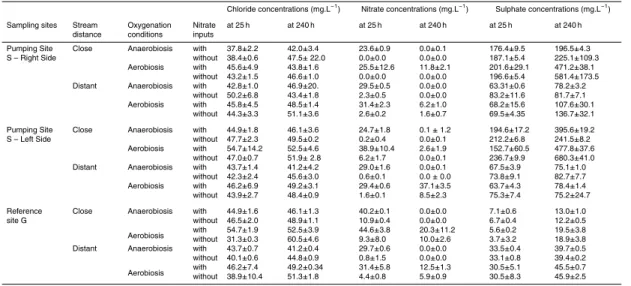
2.3 Chemical batch analyses
5 mL of solution was sampled from the flasks after 1, 9, 25, 76 and 240 h of incu-bation. Three mL, sieved through 0.22µm cellulose-acetate filters (Sartorius Minis-art) were analyzed for major anions (Cl−, SO24− and NO−3) by ionic chromatography
(Dionex©DX120) at the Caren-Geosciences Rennes laboratory. Uncertainty was less 25
BGD
6, 4829–4863, 2009Influence of hydrological fluxes on bio-geochemical
processes
N. Bougon et al.
Title Page
Abstract Introduction
Conclusions References
Tables Figures
◭ ◮
◭ ◮
Back Close
Full Screen / Esc
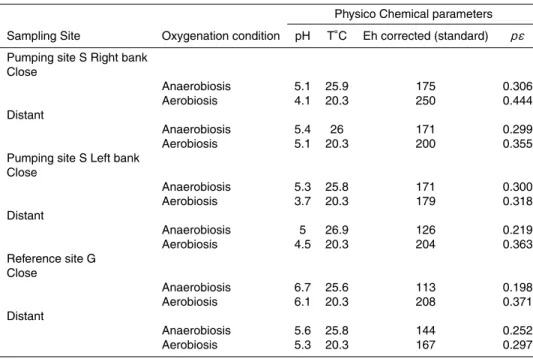
Printer-friendly Version
Interactive Discussion the end of each experiment (Table 3). pH was measured with a precision of+/−0.05
unit using a Sentix 50 electrode, calibrated with WTW standard solutions of known pH (4.01 and 7.00 at 25◦C). Redox potential was determined using a platinum electrode (Mettler Pt 4805).
2.4 Statistical analysis
5
Nitrate, chloride and sulphate concentrations increased slightly in each bioreactor over the first 25 h. Variation was related to soil pore water and added water equilibration (solubilization effect). As the variations in nitrate and sulphate concentration were con-comitant with those of chloride, biogeochemical mechanisms could be ruled out. This equilibration stage was therefore ignored in the following kinetic analyses and the zero 10
time is henceforth defined as beginning after 25 h, i.e. after equilibration. Furthermore, to permit comparison of the different experiments, which presented various concentra-tions after the first 25 h, the variation of concentration is presented as the ratio to “zero” concentration (∆=Ct/C0in %, withC0the concentration at hour 25) in all the figures.
The chloride, nitrate and sulphate concentrations for each site (reference site G and 15
the S sites, near to and distant from the stream), for each set of conditions (added NO−3 or not, oxic or anoxic), and for each time (25, 76 and 240 h), were subjected to statis-tical analysis. As family-wise errors rate in the dataset followed a Poisson distribution, the linking function used was the log transformation. Then, the data were analyzed us-ing a Generalized Linear Model (GLM) implemented inR. A deviance analysis (effect 20
on GLM when one term was removed) was performed to test (i) differences between the sites for each variable (Cl−, SO2−
4 and NO
−
3 concentrations) at each time; (ii) the
possible effect of NO−3 addition on the other variables, and (iii) the effect of oxic and anoxic conditions on the measured parameters. Statistical analyses were performed using the chi-square test. When a term was significant, the contrasts (mean compar-25
BGD
6, 4829–4863, 2009Influence of hydrological fluxes on bio-geochemical
processes
N. Bougon et al.
Title Page
Abstract Introduction
Conclusions References
Tables Figures
◭ ◮
◭ ◮
Back Close
Full Screen / Esc
Printer-friendly Version
Interactive Discussion The significance of the results was confirmed by applying a Bonferroni correction.
All these analyses were implemented usingR (http://www.r-project.org/).
3 Results
3.1 Field observations
3.1.1 Hydrological results
5
The hydrogeological conditions exhibited by the two areas are clearly distinct (Au-terives, 2007).
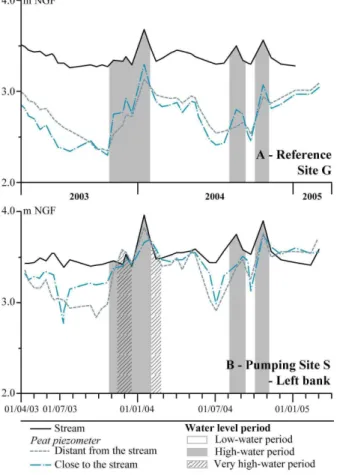
Reference site G: The water table close to the river and further into the peatland is compared in Fig. 2. Piezometric monitoring revealed that the water table was lower throughout the peat aquifer in site G during the dry period. It also shows that those 10
periods, during which the water table was higher close to the river than in the peat, were very short (in grey in Fig. 2, summarized in Fig. 1). The hydrogeological gradients inducing river fluxes towards the peat were therefore of limited duration.
Pumping site S:the water table fell much less (less than 50 cm) in the S site, es-pecially on the left bank (where pumping occurred) (Fig. 2). In contrast to site G, hy-15
drogeological gradients inducing water fluxes from river to peat were observed during most of the hydrological cycle (Fig. 1).
Pumping in the sand aquifer resulted in lowering of the water table (almost 1.5 m). This decrease led to higher water fluxes from the peat to the sand aquifer especially on the left bank of pumping site S. The water budget for the peat in both sites, based 20
on hydrogeological monitoring, was computed (Table 1). The peatland water inflow at pumping site S is related to precipitations (0.915×10⁻⁶m3/year/m2) and to a
perma-nent water inflow (0.128×10⁻⁶m3/year/m2), induced by vertical fluxes from the peat to the sand aquifer. In contrast, the peatland water inflow at reference site G is mainly controlled by precipitations (0.915×10⁻⁶m3/year/m2). It was apparent from
BGD
6, 4829–4863, 2009Influence of hydrological fluxes on bio-geochemical
processes
N. Bougon et al.
Title Page
Abstract Introduction
Conclusions References
Tables Figures
◭ ◮
◭ ◮
Back Close
Full Screen / Esc
Printer-friendly Version
Interactive Discussion ical monitoring that the main differences in hydrological conditions were related to (i)
large fluxes from the river through the peat at site S which maintain high peat water lev-els, and (ii) limited fluxes from the river which create long and considerable downward water movement and peat drying at site G.
3.1.2 Geochemical results
5
A two-year hydrogeological and hydrochemical monitoring programme (Auterives, 2007; Auterives et al., 2008) revealed that the peat groundwater was slightly acid (pH 5.5–7.5) and conductivity ranged from 200 to 600µS cm−1. Redox potential var-ied according to the hydrological period, values exceeding 400 mV/ESH throughout the high-water periods and indicating oxidized conditions. Oxygenation of peat groundwa-10
ter is promoted by deeper groundwater flow into the sand, and water renewal. During the low-water periods, Eh fell below 200–300 mV/ESH and indicated moderately re-duced conditions due to the slow flow of groundwater limiting oxygen renewal in the peat groundwater.
Chloride concentrations ranged from 15 to 40 mg/L. A concentration gradient, de-15
pendent on the distance from the stream, was observed in site G.
Nitrate dynamics were dependent on hydrological conditions, NO−3 concentrations being higher during high-water periods (5 to 35 mg L−1) than during low-water periods
(0 to 10 mg L−1). A clear decrease in NO−
3 concentration was observed during
low-water periods. 20
SO2−
4 concentrations showed extremely high variations from 0 to 1200 mg L− 1
. Pulses of SO2−
4 related to pulses of H
+ (pH<5) are observed after a
desatura-tion/resaturation cycle. An increase in sulphate concentration was apparent after an increase in peat groundwater level. Such increases were located in two areas: on the left bank near the pumping well in site S and near the stream in reference site G. These 25
areas correspond to maximum drying of the peat during low water. The SO2−
4 pulses
Au-BGD
6, 4829–4863, 2009Influence of hydrological fluxes on bio-geochemical
processes
N. Bougon et al.
Title Page
Abstract Introduction
Conclusions References
Tables Figures
◭ ◮
◭ ◮
Back Close
Full Screen / Esc
Printer-friendly Version
Interactive Discussion terives, 2007). During washing out, the formerly reduced species which were oxidized
during resaturation are again brought into solution.
The changes in nitrate and sulphate concentrations were clearly related to water ta-ble dynamics and reflected various redox conditions related to water saturation. How-ever, the field results also showed an obvious variation between sites and with respect 5
to the distance from the stream within each site:
– efficient nitrate removal in reference site G and pumping site S – right bank, – more limited nitrate removal in pumping site S – left bank, above the abstraction
well,
– sulphate production (SO24−>100 mg/L) throughout pumping site S – left bank, 10
above the abstraction well, and in reference site G, close to the stream,
– high sulphate concentrations (SO2−
4 =20–50 mg/L) close to the stream on the right
bank of pumping site S.
3.2 Batch results
3.2.1 Nitrate
15
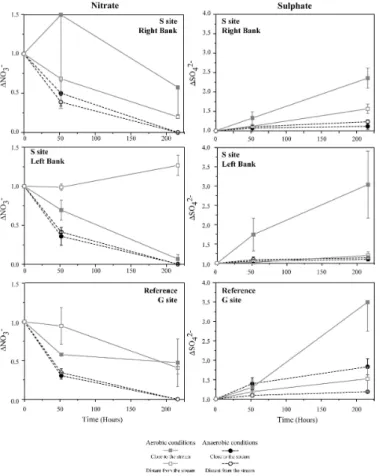
A systematic decrease in nitrate concentration was observed under anaerobiosis (Fig. 4). Nitrate reduction was complete at the end of the experiments in the S site samples. Maximal nitrate consumption occurred during the first 50 h, reaching 70% of the initial concentration under anaerobiosis. Nitrate consumption was more lim-ited in samples from site G under aerobic conditions. Pumping site S (left bank – 20
BGD
6, 4829–4863, 2009Influence of hydrological fluxes on bio-geochemical
processes
N. Bougon et al.
Title Page
Abstract Introduction
Conclusions References
Tables Figures
◭ ◮
◭ ◮
Back Close
Full Screen / Esc
Printer-friendly Version
Interactive Discussion 0.61±0.02 mg L−1h−1 compared to 0.04
±0.02 mg L−1h−1 in the same soil without ni-trate enrichment (Fig. 4). This is representative of the mean of the difference observed between “with” and “without nitrate enrichment” in all the batches.
3.2.2 Sulphate
Increases in sulphate concentration were observed during several batch experiments 5
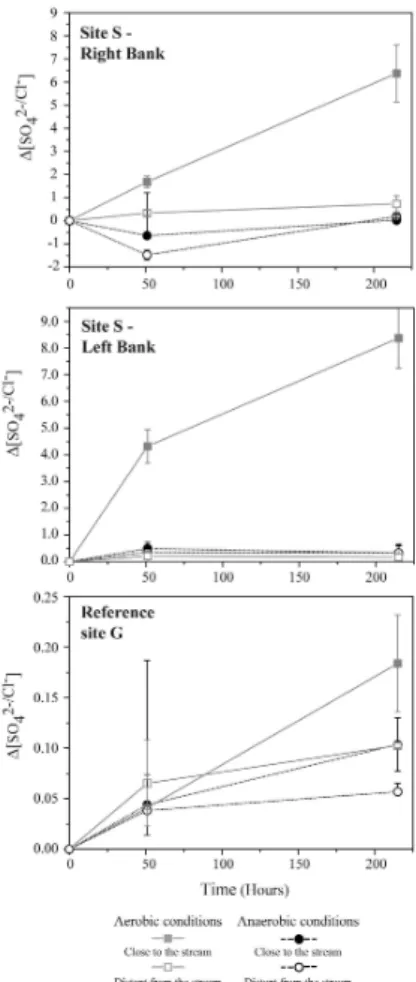
(Fig. 4). However, some of these increases were related to chloride increases. The linear correlation between the S and Cl increases was interpreted as resulting from the diffusion of highly concentrated pore water during the experiments. Peat con-stitutes an excellent reservoir for chloride- and sulphate-enriched pore water. The effect of evapotranspiration on water derived from precipitation leads to higher con-10
centrations in the pore water of the peat, especially in the upper layers. Further-more, the drying-rewetting process (Devito and Hill, 1999; Eimers et al., 2003) re-sults in oxidation of the sulfur molecule and the accumulation of a sulphate pool within the peat matrix. The sulphate produced during the experiment and that dif-fused from the highly concentrated pore water, were distinguished by correcting 15
the sulphate concentration for pore water sulphate content according to the chlo-ride variations in Fig. 5. The ∆SO2−
4 /Cl
− was obtained by the following equation:
∆=[((SO2−
4 t−SO24− t0)/SO24− t0)/((Cl− t−Cl− t0)/Cl− t0)]; with [SO42−] t0 and [Cl−] t0
the concentrations at hour 25. The sulphate increase was greater in samples col-lected close to the stream (Table 4, deviance analysis, P <0.0001) and in samples 20
subjected to aerobic conditions (deviance analysis, P <0.0001; Figs. 4 and 5). Sul-phate production in site S – left bank under aerobic conditions was 300% (correspond-ing to∆(SO2−
4 t240 h−SO24− t0)=400 mg/L). This represents a sulphate concentration of
600 mg/L at the end of the experiment. No significant sulphate production was ob-served during the same period under anaerobic conditions (Fig. 5).
BGD
6, 4829–4863, 2009Influence of hydrological fluxes on bio-geochemical
processes
N. Bougon et al.
Title Page
Abstract Introduction
Conclusions References
Tables Figures
◭ ◮
◭ ◮
Back Close
Full Screen / Esc
Printer-friendly Version
Interactive Discussion
3.2.3 Site comparison
A large increase in chloride concentration was observed at site G under aerobic con-ditions (deviance analysis, P <0.0001). More limited (from z coeff, P=0.03) and sim-ilar chloride concentration variations were respectively observed on the right and left banks of site S. Nitrate concentrations differed significantly between the S and G sites 5
(deviance analysis,P <0.001; Table 5). Assuming that similar soil reactivities lead to similar reductions in nitrate concentration, the bacterial reaction kinetics at the S and G sites were different (Fig. 4). Without oxygen, the samples from the left and right banks of site S reacted more rapidly than those from site G. Although the observed variation during the experiment was not directly dependent on the peat sampling site (Table 5), 10
the sulphate content also differed considerably between sites, the initial contents at reference site G being one order of magnitude lower than at pumping site S (Table 4).
3.2.4 Distance from the stream
Differences in chloride content between peat sampled close to and distant from the stream were significant regardless of the site (Table 4). This was also true for the 15
nitrate and sulphate contents. Samples “close to” and “distant from” the stream had a high sulphate concentration. Moreover, at the beginning of the experiments, the concentrations in samples obtained “close to” the stream were 3 times higher than in those “distant from” the stream (Table 4). This was mainly apparent in site S. The sulphate concentrations in samples distant from the stream in reference site G, were 20
higher than in those close to the stream.
3.3 Comparison of batch/field results
BGD
6, 4829–4863, 2009Influence of hydrological fluxes on bio-geochemical
processes
N. Bougon et al.
Title Page
Abstract Introduction
Conclusions References
Tables Figures
◭ ◮
◭ ◮
Back Close
Full Screen / Esc
Printer-friendly Version
Interactive Discussion was mainly expected under anaerobic conditions; 3) High sulphate concentrations
were produced during some experiments; 4) Clear differences in chloride content (de-viance analysis, P <0.05), sulphate concentration and nitrate consumption dynamics (deviance analysis, P <0.0001) were observed between samples from the G and S sites; 5) Reactivity differed as a function of distance from the stream, as observed for 5
chloride and sulphate concentrations; 6) Even under similar redox conditions and ni-trate concentrations, nini-trate removal and sulphate production rates differed between peat samples from sites subjected to different hydrological regimes.
4 Discussion
4.1 Nitrate removal
10
The observed reduction of nitrate concentration during batch experiments has already been reported in several studies. This phenomenon results from microbiological con-sumption, nitrate serving as electron acceptor (Correl, 1997). The microbiological re-duction of nitrates involves 3 types of processes: dissimilatory rere-duction, autotrophic and heterotrophic denitrification. Although nitrate-reducing microorganisms display 15
a great plasticity to oxygen availability, most denitrifiers use nitrate as final electron donor under anoxic conditions (Florinski et al., 2004). The presence here of available dissolved organic carbon (>30 mg/L), moderately reduced redox conditions (<200– 300 mV) (Table 3), anoxic conditions and nitrate nutrients suggests a heterotrophic reduction process (Ingersoll and Baker, 1998; Hedin et al., 1998; Hill et al., 2000; Vi-20
don and Hill, 2004). The comparison of biotic and abiotic conditions (Fig. 6) indicates the importance of biological mediation in nitrate removal (deviance analysis, e.g. G site aerobic conditions: P <0.0001). Although nitrate reduction cannot be assigned solely to biological activity, most can be attributed to heterotrophic denitrification.
Denitrification was also observed under aerobic conditions. Various bacteria may 25
BGD
6, 4829–4863, 2009Influence of hydrological fluxes on bio-geochemical
processes
N. Bougon et al.
Title Page
Abstract Introduction
Conclusions References
Tables Figures
◭ ◮
◭ ◮
Back Close
Full Screen / Esc
Printer-friendly Version
Interactive Discussion as aerobic respiration in terms of energy produced. This phenomenon should be
in-terpreted as an electron accepting mechanism that competes with aerobic respiration, providing an advantage in terms of fitness in a changing environment. Alternatively, the denitrification observed under aerobic conditions could be due to localized devel-opment of micro-anaerobiosis even though the flasks were shaken.
5
4.2 Sulphates
Considerable sulphate production was observed (Fig. 4), especially under aerobic con-ditions. Sulphate concentrations were extremely high (close to 600 mg/L at the end of the experiment, i.e. variation of 400 mg/L; Figs. 4 and 5) in peat samples collected from pumping site S close to the stream. Such concentration are in good agreement with 10
the concentration observed in situ (up to 1200 mg/L). Although a process of mixing with highly concentrated pore-water provided an important source of sulphate at the begin-ning of the batch experiments (Fig. 4), it is also apparent from Fig. 5 that sulphate production occurred independently of pore water diffusion. The observed sulphate re-lease in peat samples from site S close to the stream can result from (i) mineral and/or 15
(ii) organic processes. Sulphates released during the experiments were derived from the dissolution of mineral phases since the experiments performed under abiotic condi-tions indicated an important, non-biological sulphate-releasing process (Fig. 6). These results agree with other reports of sulphate release under oxidized conditions (Devito and Hill, 1999; Eimers et al., 2003; Fenner et al., 2005). However, differences between 20
the abiotic and biotic experiments could also be related to a mediation of mineral sulfur dissolution by microorganisms, which could in turn affect the type of sulphates pro-duced.
We conclude from the biotic/abiotic comparison that the release of sulphates cannot be attributed to a single process. The high sulphate concentrations result from the 25
BGD
6, 4829–4863, 2009Influence of hydrological fluxes on bio-geochemical
processes
N. Bougon et al.
Title Page
Abstract Introduction
Conclusions References
Tables Figures
◭ ◮
◭ ◮
Back Close
Full Screen / Esc
Printer-friendly Version
Interactive Discussion
4.3 Spatial variability
The inter- and intra-site variability observed in the field was reproduced in the labo-ratory under different experimental conditions. The importance of parameters such as the sampling site and distance from the stream was demonstrated statistically (Table 5). Peat from reference site G showed slower nitrate removal due to bacterial activity than 5
peat from pumping site S. Peat from site G also had a lower initial sulphate content and lower release rates than site S (Tables 3 and 4). Differences in nitrate removal and sulphate release rates, particularly at site S – left bank, were related to the distance from the stream.
The different hydrological regimes induced different water fluxes in the investigated 10
sites. Pumping in the underlying aquifer resulted in a permanent flow from the stream into the peat at site S. The amplitude of water table fluctuation and peat drying were also controlled by the underlying aquifer and exchanges with the stream. High water tables were maintained in site S for much of the year, (Auterives, 2007; Auterives et al., 2008). The observed differences in sulphate release within and between sites 15
highlight the importance of hydrological fluxes in controlling sulphate dynamics through the introduction of oxygen and emphasis of biological processes. These results agree with previous reports (Devito 1995; Devito and Hill, 1999, Warren et al., 2001; Eimers et al., 2003) that sulphate release can be predicted from hydrologic heterogeneity, especially during periods of drought.
20
The influence of the distance from the stream on the biological productivity and the observed lower biological productivity in reference site G may be explained by the temporary nature of the stream – peat connection. This zone, between terrestrial and aquatic ecosystems, represents a major mixing point for nutrients (Hedin et al., 1998; Hill et al., 2000; Mc Clain et al., 2003) which allows the production of dissolved organic 25
BGD
6, 4829–4863, 2009Influence of hydrological fluxes on bio-geochemical
processes
N. Bougon et al.
Title Page
Abstract Introduction
Conclusions References
Tables Figures
◭ ◮
◭ ◮
Back Close
Full Screen / Esc
Printer-friendly Version
Interactive Discussion
4.4 Potential mechanisms for physical influence on biological activity
The batch experiments indicated potential differences that were independent of the nutrient availability (nitrate and/or oxygen supply). The potential effect of hydrological regime on the ecosystem is based on soil moisture and diffusion/advection processes. Water fluxes and high moisture might influence microbial activity by creating an open 5
ecological ecosystem. An ecosystem includes a high degree of variation under condi-tions such as shallow fluxes, for example, and different soil structures. Potential inter-actions between micro-organisms could be increased by diffusion and advection pro-cesses. The ecosystem, by integrating a wide range of conditions, might increase the structural complexity of microbial communities. Through these processes, hydrological 10
fluxes also influence microbial activity in terms of substrate availability (Ostrom et al., 2002; Sabater et al., 2003; S ´anchez-P ´erez and Tr ´emoli `eres, 2003). The differences in the microbial ecosystem might be induced directly by the effects of “physical parame-ters” such as water fluxes. This study highlights the considerable effect of hydrological conditions on biological activity in peat. Hydrological fluxes, in addition to providing 15
stimulating physico-chemical conditions for biotic activity, may also provide more di-verse substrate availability which may also benefit from favorable physico-chemical conditions. The biochemical conditions created by a hydrological flow structure will fa-cilitate the development of hot spots (Hill et al., 2000; Mc Clain et al., 2003). Thus the observed differences between sites and the spatial variability within sites may reflect 20
the heterogeneous richness and diversity of microbial species in the ecosystem (Mar-tin et al., 1999). Indeed, it can be seen from the experimental design that the observed differences between sites are not entirely controlled by variations in redox conditions and nutrient supply and that reactivity is also a result of the actual biological community structure. The observed differences between sites, even under similar redox and nutri-25
ent conditions, indicate that the distinct hydrological fluxes can control the structure of the associated microflora.
BGD
6, 4829–4863, 2009Influence of hydrological fluxes on bio-geochemical
processes
N. Bougon et al.
Title Page
Abstract Introduction
Conclusions References
Tables Figures
◭ ◮
◭ ◮
Back Close
Full Screen / Esc
Printer-friendly Version
Interactive Discussion permanently influenced the structure, heterogeneity and diversity of microbial
commu-nities. A complementary survey of the narG gene by T-RFLP (Terminal Restriction Fragment Length Polymorphism) analyses, a method generating diversity signatures from environmental DNA samples (e.g. Liu et al., 1997; Vandenkoornhuyse et al., 2003), was also undertaken during the batch experiments. It has shown very clear 5
differences in bacterial community structure which confirm the biogeochemical inter-pretation (Bougon et al., 2009). Physical conditions such as hydrological fluxes should thus be considered as having a direct effect on biological communities and biological activities.
5 Conclusions
10
Monitoring of field peat presenting variable hydrological conditions revealed distinctly different chemical concentrations. The influence of hydrological factors on biogeo-chemical reactivity was investigated by experimental reproduction of various redox and nitrate concentrations in soil sampled from sites under different hydrological conditions. The experimental results confirmed the field observations. Comparisons performed 15
under abiotic and biotic conditions to determine the origin of the observed processes, showed that nitrate reduction was related to heterotrophic denitrification. Extremely high sulphate concentrations (close to 600 mg/L) observed in some experiments re-sulted from a combination of biological (peat mineralization) and chemical (mineral sulfur oxidation) processes.
20
The clear differences between the samples from the selected sites highlighted the effects of hydrological regime which likely impacted the development of specific ecosys-tem structures and diversity. The chemical variations observed in the field are not only controlled by physico-chemical conditions. Microbial reactivity also suggests changes within the microbial community structure which have been deeply modified by perma-25
BGD
6, 4829–4863, 2009Influence of hydrological fluxes on bio-geochemical
processes
N. Bougon et al.
Title Page
Abstract Introduction
Conclusions References
Tables Figures
◭ ◮
◭ ◮
Back Close
Full Screen / Esc
Printer-friendly Version
Interactive Discussion Acknowledgements. This work is supported by the ‘Marais du Cotentin et du Bessin’ regional
natural park and by grants from the General council of the “Manche” department, the Re-gional council of Normandy, the Water Agency of Seine Normandy and the CNRS “programme de recherche ECCO-PNBC”. The authors are grateful to Pierre Marmonier and Andr ´e-Jean Francez for helpful discussions; Odile H ´enin for analytical work; Diana Warwick for English
5
editing of the manuscript.
The publication of this article is financed by CNRS-INSU.
References
10
Auterives, C.: Influence des flux d’eau souterraine entre une zone humide superficielle et un aquif `ere profond sur le fonctionnement hydrochimique des tourbi `eres, Ph.D., M ´emoires du CAREN, 17, 261 pp., http://tel.archives-ouvertes.fr/docs/00/13/77/57/PDF/Auterives PhD. pdf, 2007.
Battista, J. R., Earl, A. M. and Prak, M.-J.: Why is Deinococcus radiodurans so resistant to
15
ionizing radiation?, Trends Microbiol., 7, 362–365, 1999.
Bilanovic, D., Battistoni, P., Cecchi, F., Pavan, P., and Mata-Alvare, J.: Denitrification under high nitrate concentration and alternating anoxic conditions, Water Res., 3, 3311–3320, 1999. Cannavo, P., Richaume, A., and Lafolie, F.: Fate of nitrogen and carbon in the vadose zone: in
situ and laboratory measurements of seasonal variations in aerobic respiratory and
denitri-20
fying activities, Soil Biol. Biochem., 36, 463–478, 2004.
Cavigelli, M. A. and Robertson, G. P.: The functional significance of denitrifier community com-position in a terrestrial ecosystem, Ecology, 81, 229–241, 2000.
Chapelle, F. H.: The significance of microbial processes in hydrogeology and geochemistry, Hydrogeol. J., 8, 41–46, 2000.
BGD
6, 4829–4863, 2009Influence of hydrological fluxes on bio-geochemical
processes
N. Bougon et al.
Title Page
Abstract Introduction
Conclusions References
Tables Figures
◭ ◮
◭ ◮
Back Close
Full Screen / Esc
Printer-friendly Version
Interactive Discussion
Chen, F., Xia, F., and Ju, L.K.: Aerobic denitrification ofPseudomonas aeruginosamonitored by online NAD(P)H Fluorescence, Appl. Environ. Microb., 69, 6715–6722, 2003.
Cl ´ement, J. C., Pinay, G., and Marmonier, P.: Seasonal dynamics of denitrification along topo-hydrosequences in three different riparian wetlands, J. Environ. Qual., 31, 1025–1037, 2002. Cl ´ement, J. C., Aquilina, L., Bour, O., Plaine, K., Burt, T. P., and Pinay, G.: Hydrological
flow-5
paths and nitrate removal rates within a riparian floodplain along a fourth-order stream in Brittany (France), Hydrol. Process., 17, 1177–1195, 2003.
Correl, D. L.: Buffer zones and water quality protection: General principles, in: Buffer Zones: Their Processes and Potential in Water Protection, edited by: Naycock, N. E., Burt, T. P., Goulding, K. W., Pinay, G., Quest Environment, Hertfordshire, 7–20, 1997.
10
Dassonville, F. and Renault, P.: Interactions between microbial processes and geochemical transformations under anaerobic conditions: a review, Agronomie, 22, 51–68, 2002.
Devito, K. J.: Sulphate mass balances of Precambrian Shield wetlands: The influence of catch-ment hydrogeology, Can. J. Fish. Aqua. Sci., 52, 1750–1760, 1995.
Devito, K. J. and Hill, A. R.: Sulphate Mobilization and Pore Water Chemistry in Relation to
15
Groundwater Hydrology and Summer Drought in two Conifer Swamps on the Canadian Shield, Water Air Soil Poll., 113, 97–114, 1999.
Dommergues, Y. and Mangenot, F.: Ecologie microbienne du sol, Masson ´editeur, Paris, 1970. Eimers, M. C., Dillon, P. J., Schiff, S. L., and Jeffries, D. S.: The effects of drying and re-wetting
and increased temperature on sulphate release from upland and wetland material, Soil Biol.
20
Biochem., 35, 1663–1673, 2003.
Fenner, N., Freeman, C., and Reynolds, B.: Hydrological effects on the diversity of phenolic degrading bacteria in a peatland: implications for carbon cycling, Soil Biol. Biochem., 37, 1277–1287, 2005.
Ginn, T. R., Wood, B. D., Nelson, K. E., Scheibe T. D., Murphy, E. M., and Clement, T. P.:
25
Processes in microbial transport in the natural subsurface, Adv. Water Resour., 25, 1017– 1042, 2002.
Harvey, R. W., Kinner, N. E., MacDonald, D., Metge, D. W., and Bunn, A.: Role of physical het-erogeneity in the interpretation of small-scale laboratory and field observations of bacteria, microbial-sized microsphere, and bromide transport through aquifer sediments, Adv. Water
30
Resour., 29, 2713–2721, 1993.
BGD
6, 4829–4863, 2009Influence of hydrological fluxes on bio-geochemical
processes
N. Bougon et al.
Title Page
Abstract Introduction
Conclusions References
Tables Figures
◭ ◮
◭ ◮
Back Close
Full Screen / Esc
Printer-friendly Version
Interactive Discussion
processes at soil – stream interfaces, Ecology, 79, 684–703, 1998.
Hill, A. R., Devito, K. J., Campagnolo, S., and Sanmugadas, K.: Subsurface denitrification in a forest riparian zone: interactions between hydrology and supplies of nitrate and organic carbon, Biogeochemistry, 51, 193–223, 2000.
Ingersoll, T. L. and Baker, L. A.: Nitrate removal in wetland microcosms, Water Res., 32, 677–
5
684, 1998.
Knowles, R.: Denitrification, Microbiol. Mol. Biol. R., 46, 43–70, 1982.
Liu, W. T., Marsh, T. L., Cheng, H., and Forney, L. J.: Characterization of microbial diversity by determining terminal restriction fragment length polymorphisms of genes encoding 16S rDNA, Appl. Environ. Microb., 63, 4516–4522, 1997.
10
Martin, T. L., Trevors, J. T., and Kaushik, N. K.: Soil microbial diversity, community structure and denitrification in a temperate riparian zone, Biodivers. Conserv., 8, 1057–1078, 1999. McClain, M. E., Boyer, E. W., Dent, C. L., Gergel, S. E., Grimm, N. B., Groffman, P. M., Hart,
S. C., Harvey, J. H., Johnston, C. A., Mayorga, E., McDowell, W. H., and Pinay, G.: Biogeo-chemical Hot Spots and Hot Moments at the Interface of Terrestrial and Aquatic Ecosystems,
15
Ecosystems, 6, 301–312, 2003.
McGill, W.B. and Cole, C.V.: Comparative aspects of cycling of organic C, N, S and P through soil organic matter, Geoderma, 26, 267–286, 1981.
Mitchell, C. P. J. and Branfireun, B. A.: Hydrogeomorphic Controls on Reduction– Oxidation Conditions across Boreal Upland – Peatland Interfaces, Ecosystems, 8, 731–747, 2005.
20
Murphy, E. M. and Ginn, T. R.: Modeling microbial processes in porous media, Hydrogeol. J., 8, 142–158, 2000.
Nannipieri, P., Ascher, J., Ceccherini, M. T., Landi, L., Pietramellara, G., and Renella, G.: Microbial diversity and soil functions, Eur. J. Soil Sci., 54, 655–670, 2003.
Ostrom, N. E., Hedin, L. O., von Fischer, J. C., and Robertson G. P.: Nitrogen transformations
25
and NO3- removal at a soil stream interface: A stable isotope approach, Ecol. Appl., 12, 1027–1043, 2002.
Owen, C. R.: Water budget and flow patterns in an urban wetland, J. Hydrol., 169, 171–187, 1995.
Packman, A. I., Salehin, M., and Zaramella, M.: Hyporheic exchange with gravel beds: basic
30
hydrodynamic interactions and bedform-induced advective flows, J. Hydraul. Eng., 130, 647– 656, 2004.
BGD
6, 4829–4863, 2009Influence of hydrological fluxes on bio-geochemical
processes
N. Bougon et al.
Title Page
Abstract Introduction
Conclusions References
Tables Figures
◭ ◮
◭ ◮
Back Close
Full Screen / Esc
Printer-friendly Version
Interactive Discussion
in soil, Vadose Zone J., 3, 368–383, 2004.
Sabater, S., Butturini, A., Clement, J. C., Burt, T., Dowrick, D., Hefting, M., Maˆıtre, V., Pinay, G., Postolache, C., Rzepecki, M., and Sabater, F.: Nitrogen Removal by Riparian Buffers along a European Climatic Gradient: Patterns and Factors of Variation, Ecosystems, 6, 20–30, 2003.
5
S ´anchez-P ´erez, J. M. and Tr ´emoli `eres, M.: Change in groundwater chemistry as a conse-quence of suppression of floods: the case of the Rhine floodplain, J. Hydrol., 270, 89–104, 2003.
Stumm, W. and Morgan, J. J.: Aquatic chemistry, Chemical equilibria and rates in natural waters, John Wiley and sons, New York, USA, 1996.
10
Thornley, M. J., Horne, R. W., and Glauert, A. M.: The fine structure ofMicrococcus radiodu-rans, Arch. Mikrobiol., 51, 267–289, 1965.
Torsvik, V. and Øvre ˚as, L.: Microbial diversity and function in soil: from genes to ecosystems, Curr. Opin. Microbiol., 5, 240–245, 2002.
Vandenkoornhuyse, P., Ridgeway, K., Watson, I. J., Fitter, A. H., and Young, J. P. W.:
Co-15
existing grass species have distinctive arbuscular mycorrhizal communities, Mol. Ecol., 12, 3085–3095, 2003.
Vidon, P. G. F. and Hill, A. R.: Landscape controls on the hydrology of stream riparian zones, J. Hydrol., 292, 210–228, 2004.
Warren, F. J., Waddington, J. M., Bourbonniere, R. A., and Day, S. M.: Effect of drought on
20
hydrology and sulphate dynamics in a temperate swamp, Hydrol. Process., 15, 3133–3150, 2001.
BGD
6, 4829–4863, 2009Influence of hydrological fluxes on bio-geochemical
processes
N. Bougon et al.
Title Page
Abstract Introduction
Conclusions References
Tables Figures
◭ ◮
◭ ◮
Back Close
Full Screen / Esc
Printer-friendly Version
Interactive Discussion Table 1. Hydrological budget of the two pumping sites S and the reference site G for the year
2004.
Hydrologic component Pumping site S – right bank Pumping site S – left bank Reference site G
Absolute value Absolute value Absolute value (10−6
m3/year/m2) (10−6
m3/year/m2) (10−6
m3/year/m2)
INPUT
Rainfall 0.915 0.915 0.915
Qstream 0.092 0.128 0.005
Qpeat 0.001 0.027 0.001
Total Inflow 1.007 1.070 0.921
OUTPUT
Evapotranspiration 0.550 0.550 0.550
Qstream 0.003 0.006 0.000
Qpeat 0.012 0.007 0.001
Qvertical flow 0.444 0.504 0.377
Total Outflow 1.008 1.067 0.928
BGD
6, 4829–4863, 2009Influence of hydrological fluxes on bio-geochemical
processes
N. Bougon et al.
Title Page
Abstract Introduction
Conclusions References
Tables Figures
◭ ◮
◭ ◮
Back Close
Full Screen / Esc
Printer-friendly Version
Interactive Discussion Table 2.Soil characteristics and CHNSO content.
Sampling sites Stream distance Soil profile pH % C % S % N % O
Pumping site S Right Side Close 0 to 15 cm: soil 4.5 44.9±1.7 1.0±0.0 2.21±0.11 31.8±0.6 15 to 50 cm: ballast
+50 cm: peat
Distant 0 to 15 cm: soil 5 31.3±2. 0.3±0.1 2.2±0.2 21.0±1.6 15 to 50 cm: ballast
50 cm: peat
Pumping site S Left Side Close 0 to 15 cm: peaty soil 4.7 26.6±1.18 0.3±0.0 1.9±0.0 18.9±0.2 15 to 50 cm: clay loam oxidised
50 cm: peat
Distant 0 to 10 cm: peaty soil 4.4 32.9±0.8 0.5±0.0 2.3±0.0 22.1±0.3 10 to 30 cm: clay loam oxidised
30 cm: peat
Reference G site Close 0 to 15 cm: soil 5.8 40.1±3.1 0.5±0.1 1.9±0.0 15.4±1.2 15 to 50 cm: ballast
50 cm:peat
BGD
6, 4829–4863, 2009Influence of hydrological fluxes on bio-geochemical
processes
N. Bougon et al.
Title Page
Abstract Introduction
Conclusions References
Tables Figures
◭ ◮
◭ ◮
Back Close
Full Screen / Esc
Printer-friendly Version
Interactive Discussion Table 3.Physico – chemical parameters at the end of experiments.
Physico Chemical parameters
Sampling Site Oxygenation condition pH T◦C Eh corrected (standard) pε
Pumping site S Right bank Close
Anaerobiosis 5.1 25.9 175 0.306
Aerobiosis 4.1 20.3 250 0.444
Distant
Anaerobiosis 5.4 26 171 0.299
Aerobiosis 5.1 20.3 200 0.355
Pumping site S Left bank Close
Anaerobiosis 5.3 25.8 171 0.300
Aerobiosis 3.7 20.3 179 0.318
Distant
Anaerobiosis 5 26.9 126 0.219
Aerobiosis 4.5 20.3 204 0.363
Reference site G Close
Anaerobiosis 6.7 25.6 113 0.198
Aerobiosis 6.1 20.3 208 0.371
Distant
Anaerobiosis 5.6 25.8 144 0.252
BGD
6, 4829–4863, 2009Influence of hydrological fluxes on bio-geochemical
processes
N. Bougon et al.
Title Page
Abstract Introduction
Conclusions References
Tables Figures
◭ ◮
◭ ◮
Back Close
Full Screen / Esc
Printer-friendly Version
Interactive Discussion Table 4. Mean chloride, nitrate and sulphate concentrations after the mixing effect, at 25 h and at the end of the
experiment, at 240 h. Each concentration indicated represents the mean of 3 replicates with the standard error.
Chloride concentrations (mg.L−1
) Nitrate concentrations (mg.L−1
) Sulphate concentrations (mg.L−1
)
Sampling sites Stream Oxygenation Nitrate at 25 h at 240 h at 25 h at 240 h at 25 h at 240 h distance conditions inputs
Pumping Site Close Anaerobiosis with 37.8±2.2 42.0±3.4 23.6±0.9 0.0±0.1 176.4±9.5 196.5±4.3 S – Right Side without 38.4±0.6 47.5±22.0 0.0±0.0 0.0±0.0 187.1±5.4 225.1±109.3
Aerobiosis with 45.6±4.9 43.8±1.6 25.5±12.6 11.8±2.1 201.6±29.1 471.2±38.1 without 43.2±1.5 46.6±1.0 0.0±0.0 0.0±0.0 196.6±5.4 581.4±173.5 Distant Anaerobiosis with 42.8±1.0 46.9±20. 29.5±0.5 0.0±0.0 63.31±0.6 78.2±3.2
without 50.2±6.8 43.4±1.8 2.3±0.5 0.0±0.0 83.2±11.6 81.7±7.1 Aerobiosis with 45.8±4.5 48.5±1.4 31.4±2.3 6.2±1.0 68.2±15.6 107.6±30.1
without 44.3±3.3 51.1±3.6 2.6±0.2 1.6±0.7 69.5±4.35 136.7±32.1
Pumping Site Close Anaerobiosis with 44.9±1.8 46.1±3.6 24.7±1.8 0.1±1.2 194.6±17.2 395.6±19.2 S – Left Side without 47.7±2.3 49.5±0.2 0.2±0.4 0.0±0.1 212.2±6.8 241.5±8.2
Aerobiosis with 54.7±14.2 52.5±4.6 38.9±10.4 2.6±1.9 152.7±60.5 477.8±37.6 without 47.0±0.7 51.9±2.8 6.2±1.7 0.0±0.1 236.7±9.9 680.3±41.0 Distant Anaerobiosis with 43.7±1.4 41.2±4.2 29.0±1.6 0.0±0.1 67.5±3.9 75.1±1.0
without 42.3±2.4 45.6±3.0 0.6±0.1 0.0±0.0 73.8±9.1 82.7±7.7 Aerobiosis with 46.2±6.9 49.2±3.1 29.4±0.6 37.1±3.5 63.7±4.3 78.4±1.4 without 43.9±2.7 48.4±0.9 1.6±0.1 8.5±2.3 75.3±7.4 75.2±24.7
Reference Close Anaerobiosis with 44.9±1.6 46.1±1.3 40.2±0.1 0.0±0.0 7.1±0.6 13.0±1.0
site G without 46.5±2.0 48.9±1.1 10.9±0.4 0.0±0.0 6.7±0.4 12.2±0.5
Aerobiosis withwithout 54.731.3±±1.90.3 60.552.5±±4.63.9 9.344.6±±8.03.8 20.310.0±±2.611.2 3.75.6±±3.20.2 18.919.5±±3.83.8 Distant Anaerobiosis with 43.7±0.7 41.2±0.4 29.7±0.6 0.0±0.0 33.5±0.4 39.7±0.5 without 40.1±0.6 44.8±0.9 0.8±1.5 0.0±0.0 33.1±0.8 39.4±0.2
BGD
6, 4829–4863, 2009Influence of hydrological fluxes on bio-geochemical
processes
N. Bougon et al.
Title Page
Abstract Introduction
Conclusions References
Tables Figures
◭ ◮
◭ ◮
Back Close
Full Screen / Esc
Printer-friendly Version
Interactive Discussion
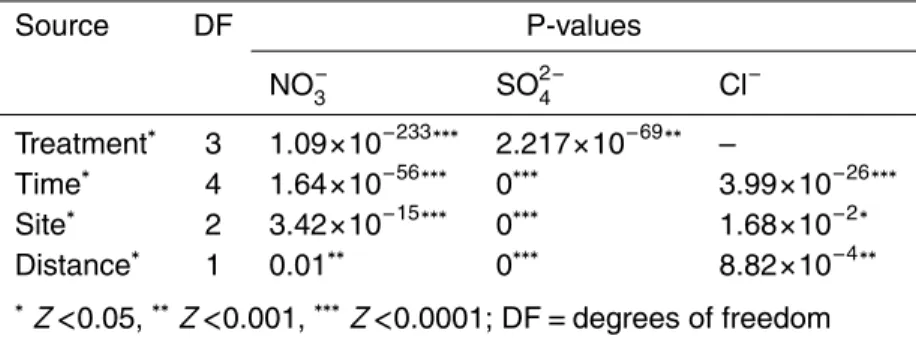
Table 5. Results of GLM (P-values and significance) for nitrate (NO−
3), chloride (Cl −) and
sulphate (SO2−
4 ) concentrations.
Source DF P-values
NO−
3 SO
2−
4 Cl
−
Treatment∗ 3 1.09
×10−233∗∗∗ 2.217×10−69∗∗ –
Time∗ 4 1.64
×10−56∗∗∗ 0∗∗∗ 3.99×10⁻²⁶∗∗∗
Site∗ 2 3.42
×10−15∗∗∗ 0∗∗∗ 1.68×10⁻²∗
Distance∗ 1 0.01∗∗ 0∗∗∗ 8.82
×10−4∗∗
∗Z<0.05,∗∗Z<0.001,∗∗∗Z<0.0001; DF
=degrees of freedom
∗ “treatment” represents nitrate input and oxygenation condition; “time” represents di
BGD
6, 4829–4863, 2009Influence of hydrological fluxes on bio-geochemical
processes
N. Bougon et al.
Title Page
Abstract Introduction
Conclusions References
Tables Figures
◭ ◮
◭ ◮
Back Close
Full Screen / Esc
Printer-friendly Version
Interactive Discussion
Fig. 1. Location and piezometer map of the Carentan site (modified from Auterives, 2007).
A and B represent the piezometer location and A’/B’ are an interpreted view of the peat-land/stream relationship water flows.
BGD
6, 4829–4863, 2009Influence of hydrological fluxes on bio-geochemical
processes
N. Bougon et al.
Title Page
Abstract Introduction
Conclusions References
Tables Figures
◭ ◮
◭ ◮
Back Close
Full Screen / Esc
Printer-friendly Version
Interactive Discussion Fig. 2.Water level fluctuations during a 2-year period in reference site G(A), and pumping site
S – left bank(B).
BGD
6, 4829–4863, 2009Influence of hydrological fluxes on bio-geochemical
processes
N. Bougon et al.
Title Page
Abstract Introduction
Conclusions References
Tables Figures
◭ ◮
◭ ◮
Back Close
Full Screen / Esc
Printer-friendly Version
Interactive Discussion Fig. 3. Experimental design. “Anaerobic condition” indicates that the ambient atmosphere is
changed to N2. “+nitrate” or “−nitrate” corresponding to addition or non addition of nitrate in
the flask. “Control” corresponds to sterilized samples. 3 samples are run for each experimental procedure to allow statistical analysis.
BGD
6, 4829–4863, 2009Influence of hydrological fluxes on bio-geochemical
processes
N. Bougon et al.
Title Page
Abstract Introduction
Conclusions References
Tables Figures
◭ ◮
◭ ◮
Back Close
Full Screen / Esc
Printer-friendly Version
Interactive Discussion Fig. 4.Variation in nitrate concentrations over time in peat samples under aerobic and
anaero-bic conditions in batch experiments. The values given for each sample correspond to the mean of the 3 replicates. The temporal variation is expressed as the difference from the zero concen-tration (see Sect. 2.4. statistical analysis). Bars indicate standard deviation. Only experiments with nitrate addition are represented.
BGD
6, 4829–4863, 2009Influence of hydrological fluxes on bio-geochemical
processes
N. Bougon et al.
Title Page
Abstract Introduction
Conclusions References
Tables Figures
◭ ◮
◭ ◮
Back Close
Full Screen / Esc
Printer-friendly Version
Interactive Discussion
7
BGD
6, 4829–4863, 2009Influence of hydrological fluxes on bio-geochemical
processes
N. Bougon et al.
Title Page
Abstract Introduction
Conclusions References
Tables Figures
◭ ◮
◭ ◮
Back Close
Full Screen / Esc
Printer-friendly Version
Interactive Discussion Fig. 6. Comparison of biotic and abiotic changes according to nitrate and sulphate
concentra-tions throughout the batch experiment. Data correspond to experiments using samples distant from the stream and with nitrate addition.