www.hydrol-earth-syst-sci.net/18/967/2014/ doi:10.5194/hess-18-967-2014
© Author(s) 2014. CC Attribution 3.0 License.
Hydrology and
Earth System
Sciences
Antecedent flow conditions and nitrate
concentrations in the Mississippi River basin
J. C. Murphy1, R. M. Hirsch2, and L. A. Sprague3
1Tennessee Water Science Center, US Geological Survey, Nashville, USA 2National Research Program, US Geological Survey, Reston, USA
3National Water-Quality Assessment Program, US Geological Survey, Boise, USA
Correspondence to:J. C. Murphy ([email protected])
Received: 30 August 2013 – Published in Hydrol. Earth Syst. Sci. Discuss.: 10 September 2013 Revised: 29 January 2014 – Accepted: 3 February 2014 – Published: 10 March 2014
Abstract.The relationship between antecedent flow
condi-tions and nitrate concentracondi-tions was explored at eight sites in the 2.9 million square kilometers (km2) Mississippi River basin, USA. Antecedent flow conditions were quantified as the ratio between the mean daily flow of the previous year and the mean daily flow from the period of record (Qra-tio), and the Qratio was statistically related to nitrate anoma-lies (the unexplained variability in nitrate concentration af-ter filaf-tering out season, long-af-term trend, and contempora-neous flow effects) at each site. Nitrate anomaly and Qra-tio were negatively related at three of the four major tribu-tary sites and upstream in the Mississippi River, indicating that when mean daily streamflow during the previous year was lower than average, nitrate concentrations were higher than expected. The strength of these relationships increased when data were subdivided by contemporaneous flow condi-tions. Five of the eight sites had significant negative relation-ships (p≤0.05) at high or moderately high contemporane-ous flows, suggesting nitrate that accumulates in these basins during a drought is flushed during subsequent high flows. At half of the sites, when mean daily flow during the previous year was 50 percent lower than average, nitrate concentra-tion can be from 9 to 27 percent higher than nitrate con-centrations that follow a year with average mean daily flow. Conversely, nitrate concentration can be from 8 to 21 percent lower than expected when flow during the previous year was 50 percent higher than average. Previously documented for small, relatively homogenous basins, our results suggest that relationships between antecedent flows and nitrate concen-trations are also observable at a regional scale. Relationships were not observed (using all contemporaneous flow data
to-gether) for basins larger than 1 million km2, suggesting that above this limit the overall size and diversity within these basins may necessitate the use of more complicated statisti-cal approaches or that there may be no discernible basin-wide relationship with antecedent flow. The relationships between nitrate concentration and Qratio identified in this study serve as the basis for future studies that can better define specific hydrologic processes occurring during and after a drought (or high flow period) which influence nitrate concentration, such as the duration or magnitude of low flows, and the timing of low and high flows.
1 Introduction
out on a large scale. Yet, the degree to which antecedent moisture affects nutrient export from large basins may have profound implications for environmental management and policy, particularly for large basins in agricultural regions that contribute substantial masses of nutrients to coastal wa-ters. Nutrient fluxes from the Mississippi River basin (MRB) are closely related to the spatial extent of the hypoxic zone in the Gulf of Mexico (Donner and Scavia, 2007; Rabalais and Turner, 2001); consequently, the hypoxic zone is often smaller during a drought when low flows from the Missis-sippi River deliver smaller nutrient loads to the Gulf (Scavia et al., 2003; Turner et al., 2006). However, nitrate and other nutrients may accumulate within the basin during a drought and be subject to flushing by high flows when a drought ends, resulting in higher than normal nitrate concentrations in re-ceiving waters. Conversely, particularly wet antecedent con-ditions may flush nitrate and other nutrients from the basin with more frequency, depleting the availability of these stituents in the soil and causing lower than anticipated con-centrations in streamwater.
Exploring hydrologic processes, such as the influence of antecedent moisture conditions on nitrate export, in large basins (defined in our study as>30 000 square kilometers (km2)) is complicated by their diverse mix of land cover, topography, geology and climate, in addition to confound-ing influences of dams, irrigation, and point and non-point pollution sources. These factors not only hinder the abil-ity to extrapolate results obtained from the investigation of small basins to large basins (Sidle, 2006; Soulsby et al., 2006; Shaman et al., 2004; Sivapalan, 2003) but also make it challenging to use methods typically implemented in small basins, such as the determination of hydrologic storage and flux in soil and groundwater, or direct measurement of flow and concentration from different flow routes (e.g., Rozemei-jer et al., 2010). In addition to the diversity of climatic, hy-drogeologic, and land use conditions across large basins, there can be substantial spatial variability of precipitation in-puts, with some sub-basins experiencing very wet conditions while other sub-basins experience average or even very dry conditions. Since large spatial scales result in highly vari-able soil water and groundwater storage (spatially and tem-porally), antecedent moisture conditions in large basins are likely best defined by well-integrated measurement proxies that amalgamate these variable conditions. In this study we use antecedent streamflows at the downstream end of a basin as a proxy for basin-wide antecedent soil moisture.
There are several examples of nutrient studies undertaken in very large basins (e.g., Alexander et al., 2008; Sprague et al., 2011), however, to our knowledge, the relationship between antecedent moisture and nitrate has yet to be ex-plored at a scale as large as the MRB or its major sub-basins. Most hydrologic studies related to antecedent moisture and nitrate have been undertaken at the hillslope scale or in small-(<100 km2)and meso-scale (100 to 1000 km2)basins. We identified two studies that cover the largest basin sizes, which
! ! !
! ! !
!
!
GRCH CLIN
MISS-OUT THEB HERM GRAF
VALL WAPE
Arkansas River
M issour
i R
M ississi
ppi R
O hio R
M
is
sis
si
p
p
i R
Illinoi
sRiver
Iow
a R
Gulf of Mexico
Mississippi River
!
!
!
CLIN WAPE
Iowa River
Illinois River
Missouri River
Ohio River Arkansas River
!
!
! !
!
VALL
GRAF HERM
THEB
MISS-OUT GRCH
Gulf of Mexico
! ! !
Atchafalaya River
Mississippi
River
Tarbert Landing St. Francisville Old River Outflow Channel Knox Landing
EXPLANATION
Study sites
!
Additional sites used for streamflow data (see footnotes in Table 1)
!
Fig. 1.Map of the continental United States showing Mississippi
River basin and study sites, and a schematic line drawing of the rel-ative locations of study sites, major tributaries, and additional sites.
are Vecchia’s (2003) study that investigated relationships be-tween other nutrients (ammonia plus organic nitrogen and total phosphorus) and 5-year, 1-year and daily flow anoma-lies in 30 basins throughout the United States, ranging in size from 114 to 117 140 km2, and a study by Lucey and Goolsby (1993) that explored the influence of climatic vari-ations on nitrate in an 8900 km2 basin in Iowa. However, most of the sites in our study are still one or more orders of magnitude larger than even these examples.
Throughout the MRB and other basins in agricultural re-gions, nitrate accumulates in farm fields due to a variety of influences, including weather conditions, soil characteristics, crop type and yield, fertilizer application, and irrigation (Fer-guson et al., 2013; Randall et al., 2003). The timing and in-teraction of these factors during a period of low precipitation leads to a wide range of nitrogen storage remaining in the soil after a growing season. In general, farms that had an ex-ceptionally low crop yield the previous growing season have elevated soil nitrate concentrations, whereas farms that had average or above-average yields have low soil nitrate concen-trations (Sawyer, 2013). During a drought, irrigation is often a determining influence for crop yield and thus the amount of nitrate likely to accumulate in the soil (Sawyer, 2013). Most farmland in the MRB is not irrigated (Table 1) and elevated soil nitrate concentrations are typically anticipated across much of the basin following a drought (Dinnes et al., 2002; Ferguson, et al., 2013; Randall et al., 2003; Rehm et al., 2009; Sawyer, 2013).
2 Study area description
Eight sites in the MRB are used in this study, four Missis-sippi River main-channel sites and four sites in major tribu-tary basins: the Iowa River, Illinois River, Missouri River and Ohio River (Fig. 1). These basins are regional to continen-tal in scale with drainage areas ranging from approximately 32 thousand km2 to over 2.9 million km2 (Table 1). In to-tal, the MRB drains approximately 41 % of the continental United States and is the largest river basin in North America (National Stream Quality Accounting Network; http://water. usgs.gov/nasqan/docs/missfact/missfactsheet.html).
Basin and climate characteristics vary greatly between the eight sites in this study (Table 1). Generally, the Ohio River basin receives the most precipitation, leading to high streamflows and runoff, whereas the Missouri River basin is the driest. The Missouri River basin is also the most hy-drologically altered in terms of number of dams and rela-tive storage (Table 1). The smallest basins have the high-est percentage of farmland. Basin and climate characteris-tics also vary widely within each basin. For example, av-erage annual precipitation (1961–1990, The National Atlas; http://www.nationalatlas.gov/) in the northwest portion of the Missouri River basin is approximately 250 millimeters per year (mm yr−1) as compared to 950 mm yr−1near the down-stream end of the basin, in the vicinity of the Missouri River at Hermann (HERM, Fig. 1). Similarly, in the Ohio River basin, annual precipitation ranges from about 1900 mm yr−1 in the southeastern portion of the basin to about 950 mm yr−1 in northern portions of the basin. For the sites in this study, there appears to be a great deal of within-basin variability as well as between-basin variability (described in Table 1) and these variations in basin and climate characteristics add con-siderable complexity to the identification and interpretation of relationships between antecedent flow and nitrate.
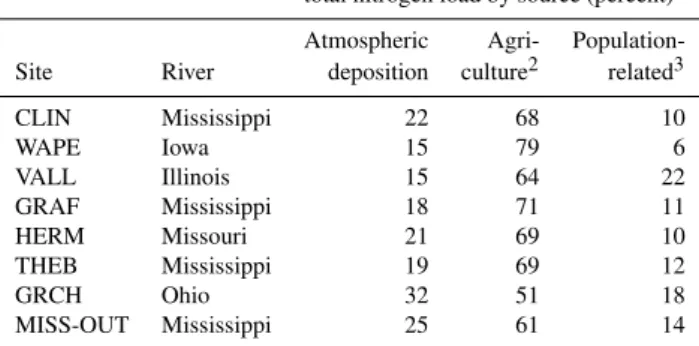
Throughout the MRB, nitrate and other forms of nitrogen in streamwater come from multiple sources including urban runoff, wastewater discharges, atmospheric deposition, and runoff and subsurface flow from agricultural (crop and ani-mal) lands. According to the US Geological Survey’s SPAR-ROW (SPAtially Referenced Regression On Watershed at-tributes) decision support system (Mississippi/Atchafalaya Basin Total Nitrogen Model – 2002; http://cida.usgs.gov/ sparrow/), which models in-stream water quality in relation to upstream sources and basin and climate characteristics, agricultural sources such as fertilizer, waste from confined animals, or legume crops dominate the total nitrogen load to the Gulf of Mexico (MISS-OUT) as compared to atmo-spheric deposition or population-related sources (Table 2). Furthermore, across all sites the relative proportion of total nitrogen from agriculture is at least 3 times greater than to-tal nitrogen from population-related sources. Contributions of total nitrogen from population-related sources (6 to 22 %, depending on the basin) and atmospheric deposition (15 to 32 %) can be substantial but agriculture (51 to 79 %) is the
Table 2.Relative contributions of total nitrogen load by source estimated using the SPARROW model (SPAtially Referenced Re-gression On Watershed attributes) decision support system (Missis-sippi/Atchafalaya Basin Total Nitrogen Model – 2002; http://cida. usgs.gov/sparrow/).
Relative contributions of
total nitrogen load by source (percent)1
Atmospheric Agri-
Population-Site River deposition culture2 related3
CLIN Mississippi 22 68 10
WAPE Iowa 15 79 6
VALL Illinois 15 64 22
GRAF Mississippi 18 71 11
HERM Missouri 21 69 10
THEB Mississippi 19 69 12
GRCH Ohio 32 51 18
MISS-OUT Mississippi 25 61 14
1May not sum to 100 due to independent rounding.2Includes fertilizer, waste from confined
animals and legume crops.3Includes wastewater treatment plants and urban sources.
dominant source of total nitrogen for the eight basins in this study (Table 2).
3 Data compilation
The eight sites used in this study (Table 1) are a part of a network of long-term data-collection sites throughout the United States that are maintained by the US Geological Sur-vey (USGS) through the National Water-Quality Assessment (NAWQA) and National Stream-Quality Accounting Net-work (NASQAN) Programs. Streamflow and dissolved ni-trate plus nitrite concentrations (referred to as nini-trate here-after) were compiled and prepared for each site according to the techniques outlined in Aulenbach et al. (2007). Daily mean streamflow data used in this study are from 1979 through the fall of 2011. Nitrate data were compiled from samples collected between 1980 and the fall of 2011 on a semi-monthly to monthly frequency (e.g., 9–18 samples per year). Nitrate data were collected across a range of stream-flow conditions, including base and peak stream-flows.
4 Methods
In the main channel of the Mississippi River and in several of its major tributaries, nitrate concentrations have been re-lated to season, long-term trend over time, and contempo-raneous daily mean flow (Sprague et al., 2011). A portion of the remaining unexplained variability in nitrate concen-tration may be related to antecedent flow conditions. In this study, a statistical model is used to quantify the unexplained variability in nitrate concentration after filtering out these ef-fects. This unexplained variability is the deviation of the ob-served log nitrate concentration from the log nitrate
concen-CLIN WAPE VALL GRAF HERM THEB GRCHMISS−OUT 0
1 2 3
Qratio
Fig. 2.Box plot of Qratio values by site.
tration predicted by a statistical model (based on contempo-raneous daily mean flow, season, and trend), herein referred to as nitrate anomalies (Vecchia et al., 2008). To evaluate if antecedent flow conditions can help to explain variations in nitrate concentrations, we tested whether nitrate anomalies were significantly (alpha=0.05) related to a measure of an-tecedent flow conditions.
In this study, we define antecedent flow as a ratio between mean daily flow of the previous year and mean daily flow of the period of record, for a given site (Qratio). TheQratio(Qri)
for dayiis calculated as Qri=
Qyri
QPOR
, (1)
where Qyri is the mean daily flow for the previous year (day
ithrough the previous 364 days), and QPORis the mean daily
flow for the period of record. Qratio values greater than 1 in-dicate higher than average mean daily flows for the previous year; values less than 1 indicate lower than average flows. Qratios for the eight sites used in our study range from 0.16 to 2.90 and the majority are within±0.25 of 1 (Fig. 2).
By using streamflow integrated over the year as a large-basin surrogate for the kinds of hydrologic storage and flux measures that might be used in small-basin-process models, we are able to acquire a general measure of basin moisture that is likely related to other physical, chemical and biologi-cal processes in a basin that are affected by preceding mois-ture conditions. The choice of a one-year averaging period used to compute the Qratio makes this antecedent flow mea-sure independent of the time of year and season. It is possi-ble that more complex statistical formulations with seasonal terms or an averaging period other than one year would have a stronger statistical association with nitrate anomalies, but model parsimony led us to commit to this simpler formula-tion. Using Qratio to describe antecedent flows characterizes hydrologic conditions broadly and allows for an initial ex-amination of how nitrate concentration responds following a drought or high flow period. If significant relationships are documented, future studies can help better define the specific hydrologic processes that influence nitrate concentration dur-ing and after a drought or high flow period.
to determine nitrate anomalies. WRTDS uses time, contem-poraneous flow, and seasonal variables to estimate solute concentrations for large river basins that have several decades of flow and concentration data. Locally weighted regression is used to make unbiased estimates of the log of nitrate con-centration for each day (Hirsch et al., 2010). WRTDS was used to estimate nitrate concentration from 1980 through the fall of 2011 for the eight sites in this study. The residuals from this modeling effort are the nitrate anomalies analyzed in this study. Predicted log nitrate concentration (pci) for day
iis modeled in WRTDS as
pci=β0+β1t+β2ln(Q)+β3sin(2π t )+β4cos(2π t ), (2)
where ln is the natural log, β0, β1, . . ., β4 are fitted
coeffi-cients,t is time, andQis daily mean streamflow (Hirsch et al., 2010). Nitrate anomaly (CAi) for dayiis defined as
CAi =ln(ci)−pci (3)
whereci is the observed nitrate concentration on dayi, and
pciis the predicted log nitrate concentration on dayi. By
us-ing WRTDS, nitrate anomalies can be conceptualized as the portion of the concentration signal that is not accounted for by contemporaneous discharge, season or long-term trend. Since nitrate anomalies are simply the residuals from the model these values represent a combination of measurement error, inadequacies of the model’s functional form, estima-tion error of the coefficients, and the influence of other vari-ables that are not considered by the model. In this case, we explicitly consider the role that antecedent streamflow, a vari-able not included in the model, might play. Thus, a positive nitrate anomaly indicates higher-than-anticipated observed concentration; a negative anomaly indicates a lower-than-anticipated observed concentration. For details on WRTDS and the modeling of nitrate concentration at these sites, see Hirsch et al. (2010) and Sprague et al. (2011).
Nonparameteric statistical methods were used to explore relationships between antecedent flows and nitrate anoma-lies because the Qratio data are positively skewed and con-tain outliers (Fig. 2). The strength of the correlation between nitrate anomaly and Qratio was determined using Kendall’s tau, and the relationship was quantified using the Kendall– Theil robust line (Helsel and Hirsch, 2002). The robust line describes the response of nitrate anomaly to Qratio and is defined as
CAi =β0+β1·Qri, (4)
where CAi is the nitrate anomaly for dayi, Qri is the Qratio
on day i, and β0 andβ1 are the fitted coefficients for the
intercept and slope, respectively. Rather than using ordinary least squares to estimate the coefficients, the slope is based on the median slope of all pairwise slopes between CAiand Qri
values, and the intercept is back-calculated using this median slope and a point defined by the median of all CAivalues and
Table 3.Kendall’s tau and robust line results of nitrate anomaly and
Qratio relationships, using all contemporaneous flow data.
Statisti-cally significant relationships (p <=0.05) are italicized [n, number
of observations].
Site River Tau pvalue Intercept Slope n
CLIN Mississippi −0.13 <0.01 0.60 −0.48 315
WAPE Iowa −0.15 <0.01 0.29 −0.20 312
VALL Illinois −0.17 <0.01 0.22 −0.18 370
GRAF Mississippi −0.03 0.50 0.10 −0.05 308
HERM Missouri 0.06 0.06 −0.03 0.12 429
THEB Mississippi −0.05 0.09 0.12 −0.09 431
GRCH Ohio −0.16 <0.01 0.37 −0.34 378
MISS-OUT Mississippi −0.05 0.15 0.16 −0.12 401
the median of all Qri(Helsel and Hirsch, 2002). Robust lines
were fit for each site using all available data.
Additionally, to identify the contemporaneous flow con-ditions in which concentrations are most sensitive to an-tecedent flows, data at each site were divided into flow classes according to the daily mean flow on the day of sample collection, and robust lines were fit to each site and flow class. Contemporaneous flow classes consist of four percentile ranges based on the observed streamflow across the period of record: low (<25th percentile), mid-low (>25th and <50th percentile), mid-high (>50th and
<75th percentile), and high (>75th percentile) contempora-neous flows.
Finally, to quantify the effect of antecedent flow on ni-trate concentration, as opposed to nini-trate anomaly, the per-cent difference in nitrate conper-centration relative to a previous year that had average mean daily flow (Qratio=1) was de-termined using the following equation:
Percent difference in concentration=
exp(β1·Qri)
exp(β1) −1
·100
, (5)
whereβ1 is the slope coefficient for a given site and flow
class. Because the denominator in Eq. (5) gives the expected nitrate concentration following a year with average flow con-ditions, the resulting percent difference from this equation gives the anticipated increase or decrease in nitrate concen-tration for a given antecedent flow condition (Qri)relative
to nitrate concentration following a year with average an-tecedent flow conditions. Four hypothetical Qratio values (Qri= 0.5, 0.75, 1.25 and 1.5) were applied using Eq. (5)
at each site and flow class. These results will parallel those quantified by the robust line relationships (Eq. 4), but apply directly to nitrate concentration instead of nitrate anomaly.
5 Results and discussion
5.1 Nitrate anomaly and antecedent flow across all
contemporaneous flows
HERM, Missouri River
0.0 0.5 1.0 1.5 2.0 2.5 3.0
−2.5 −2.0 −1.5 −1.0 −0.50.0 0.5 1.0 1.5 2.0
CLIN, Mississippi River
0.0 0.5 1.0 1.5 2.0 2.5 3.0
−2.5 −2.0 −1.5 −1.0 −0.50.0 0.5 1.0 1.5 2.0
WAPE, Iowa River
0.0 0.5 1.0 1.5 2.0 2.5 3.0
−2.5 −2.0 −1.5 −1.0 −0.50.0 0.5 1.0 1.5 2.0
VALL, Illinois River
0.0 0.5 1.0 1.5 2.0 2.5 3.0
−2.5 −2.0 −1.5 −1.0 −0.50.0 0.5 1.0 1.5
2.0 GRAF, Mississippi River
0.0 0.5 1.0 1.5 2.0 2.5 3.0
−2.5 −2.0 −1.5 −1.0 −0.50.0 0.5 1.0 1.5 2.0
0.0 0.5 1.0 1.5 2.0 2.5 3.0
−2.5 −2.0 −1.5 −1.0 −0.50.0 0.5 1.0 1.5 2.0
THEB, Mississippi River
0.0 0.5 1.0 1.5 2.0 2.5 3.0
−2.5 −2.0 −1.5 −1.0 −0.50.0 0.5 1.0 1.5 2.0
GRCH, Ohio River
0.0 0.5 1.0 1.5 2.0 2.5 3.0
−2.5 −2.0 −1.5 −1.0 −0.50.0 0.5 1.0 1.5 2.0
MISS−OUT, Mississippi River
Nitrate anomaly
Qratio
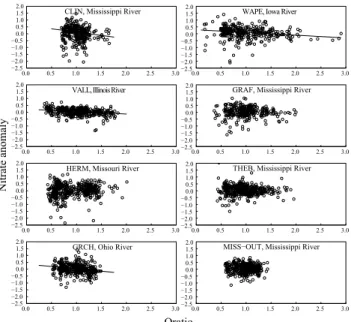
Fig. 3.Plots of nitrate anomaly versus Qratio by site, using all
contemporaneous flow data. Statistically significant relationships
(p≤0.05) are denoted with a solid black line.
major tributaries (WAPE, VALL, and GRCH), except the Missouri River (HERM), exhibit statistically significant re-lationships (p≤0.05) between Qratio and nitrate anomaly (Fig. 3), though tau is small, ranging from−0.13 to−0.17 depending on the site (Table 3). All sites have negative slopes and the steepest slope occurred in the upper Mississippi River (CLIN). Downstream Mississippi River sites (GRAF, THEB, and MISS-OUT) and the Missouri River (HERM) do not demonstrate significant relationships across the observed range of flows (Fig. 3). Note that all three basins larger than 1 million km2had non-significant correlations but four out of the five basins smaller than 1 million km2had significant correlations. In general, the relationships between antecedent flow and nitrate shown here are weak to moderately strong with low to moderate correlation (Table 3), which is not nec-essarily surprising given the complexity of solute behavior in large basins (Webb and Walling, 1984).
To describe the potential response of nitrate concentration to different antecedent flow conditions, four Qratio values (Qri= 0.50, 0.75, 1.25 and 1.50) were applied using Eq. (5) at
the sites with significant robust line relationships (p≤0.05, Table 3). At the two smallest tributary sites (WAPE and VALL) when the previous year’s flow is 50 percent higher or lower than average (Qri= 1.5 or 0.5, respectively) nitrate
concentration is about 10 percent lower or higher than ex-pected, respectively (Table 4). These positive or negative dif-ferences in nitrate concentration are relative to the nitrate concentration that follows a (hypothetical) year that had av-erage mean daily flow (Qri= 1.0). In the upper Mississippi
River (CLIN) and Ohio River (GRCH), the difference in ni-trate concentration could be as much as 27 percent higher
or 21 percent lower than expected when the previous year’s flow is 50 percent lower or higher than average, respectively. At these same sites, nitrate concentration could be only about
±10 percent different than expected when the previous year’s flow deviates about 25 percent from average flow conditions (Table 4). Therefore, the influence of antecedent flow condi-tions on nitrate concentration may be twice as strong at the sites with slightly larger basin areas (CLIN and GRCH), as compared to the sites with the smallest basin areas in our study (WAPE and VALL).
In this analysis, the Qratio describes previous flow condi-tions in a basin and also serves as a proxy for changes to other physical, chemical and biological processes that are affected by inter-annual variation in the overall moisture of a basin. Grouped into two broad categories, variations in antecedent flow conditions often coincide with changes to (1) the mass and availability of nitrate in soil (supply), and (2) hydro-logic processes that move nitrate through the basin to the stream (transport). Many processes control the accumula-tion of available nitrate in the soil during a drought, and most are closely related to soil moisture conditions. These may include increased plant stress resulting in low nitrate uptake and low crop yields (Groves and Bailey, 1997), de-creased microbial processes resulting in more limited deni-trification (Ashby et al., 1998; de Klein and van Logtestijn, 1996) and decreased runoff and leaching (Emmerich and Heitschmidt, 2002; Stites and Kraft, 2001). The timing of fertilizer application before or after a rainfall or irrigation event also influences the amount of available nitrate in the soil (Aulakh and Bijay-Singh, 1997). Additionally, droughts and periods of low flow typically coincide with lowered wa-ter tables, decreased hydrologic storage, and decreased hy-drologic connectivity, all of which inhibit nitrate transport to streams (Bernal and Sabater, 2012; Detty and McGuire, 2010; Macrae et al., 2010). Wetter antecedent conditions can cause these supply- and transport-limiting processes to have the opposite effect of minimizing the accumulation of ni-trate in the soil through denitrification, crop uptake and other processes, while also increasing hydrologic connectivity and the frequency with which nitrate is transported to ground-water or a stream. Although supply- and transport-limiting processes interact to encourage or inhibit nitrate export, the varying influence of these processes can result in inconsistent relationships between antecedent flow conditions and nitrate concentration among different basins (Macrae et al., 2010) and even over time within a single basin (Burt and Worrall, 2009, 2007).
Table 4.Percent difference in nitrate concentration relative to nitrate concentration expected following a year with average flow conditions (see Eq. 5). Positive and negative percent differences describe the increase or decrease of nitrate concentration, respectively, in response to four hypothetical antecedent flow conditions. Qratio scenarios describe when mean daily streamflow the previous year was 50 and 25 percent lower than average (Qratios 0.50 and 0.75, respectively) and 25 and 50 percent higher than average (Qratios 1.25 and 1.50, respectively).
These scenarios are only applied to relationships that were statistically significant (p <=0.05).
All contemporaneous Low flow Mid-low flow Mid-high flow High flow
flow conditions conditions conditions conditions conditions
Drier (Qratio) Wetter Drier (Qratio) Wetter Drier (Qratio) Wetter Drier (Qratio) Wetter Drier (Qratio) Wetter
Site River 0.5 0.75 1.25 1.5 0.5 0.75 1.25 1.5 0.5 0.75 1.25 1.5 0.5 0.75 1.25 1.5 0.5 0.75 1.25 1.5
(percent change) (percent change) (percent change) (percent change) (percent change)
CLIN Mississippi 27 13 −11 −21 34 16 −14 −26
WAPE Iowa 10 5 −5 −9 13 6 −6 −12
VALL Illinois 9 5 −4 −8 19 9 −8 −16 13 6 −6 −11
GRAF Mississippi
HERM Missouri −16 −8 9 19
THEB Mississippi 11 6 −5 −10
GRCH Ohio 19 9 −8 −16 44 20 −17 −30 19 9 −8 −16 15 7 −7 −13
MISS-OUT Mississippi 20 9 −9 −17
At these sites, it appears soil nitrate that accumulates during dry periods increases the supply of nitrate, which may influence nitrate export later in the year. The remaining sites further downstream on the Mississippi River (GRAF, THEB and MISS-OUT) and the Missouri River (HERM) do not provide evidence that nitrate anomalies are related to antecedent flow conditions, at least when considering all contemporaneous flows together. Interestingly, the GRAF site, located on the Mississippi River below the conflu-ence with the Illinois River (Fig. 1), has relatively similar climate and basin characteristics as CLIN, WAPE and VALL (Table 1), yet does not show a statistically significant relationship between Qratio and nitrate anomaly when all contemporaneous flows are considered.
The lack of an apparent relationship at HERM, THEB or MISS-OUT is not necessarily surprising given that these sites have drainage areas in excess of 1 million km2whereas other sites have drainage areas less than 600 000 km2. The diversity
of basin characteristics in the drainage area above HERM, THEB and MISS-OUT is very substantial and the Qratio is likely a poor indicator of the moisture status of the particular areas in these basins that are major contributors of nitrate to streamwater. For example, during the 2011 Missouri River flood the upper reaches of the basin provided most of the flood water and this area has very limited row crop agricul-ture, thus the water delivered to streams in this region had relatively low concentrations of nitrate; however, most high flow events in the Missouri River basin tend to originate in lower portions of the basin that are highly agricultural and deliver relatively high concentrations of nitrate to streams (Kalkhoff, 2013). Further complicating factors include lag times associated with groundwater discharges (Sanford and Pope, 2013) and the travel time of water through basins (Krichner et al., 2001) and large river networks. For exam-ple, at the outflow of the Mississippi River (MISS-OUT), streamwater from different locations in the MRB can take weeks to months to reach MISS-OUT (Nolan et al., 2002),
thus the relationships between antecedent flows and nitrate anomalies observed upstream in more homogenous tribu-taries are likely smeared as water moves downstream and mixes with water from other sources. Also, transport pro-cesses in some basins have been found to be more depen-dent on the permeability and storage capacity of the soil and bedrock as compared to other basins where flow-path lengths and the density of drainage networks are important influences (Hrachowitz et al., 2013).
5.2 Nitrate anomaly and antecedent flow by
contemporaneous flow class
In most cases, the relationship between Qratio and nitrate anomaly is stronger when the flow condition on the day of sample collection (contemporaneous flow) is considered. Ro-bust line coefficients and tau are typically greater in magni-tude for specific contemporaneous flow classes (Table 5) as compared to those derived using all contemporaneous flow data together (Table 3).
5.2.1 Relationships at mid-high and high
contemporaneous flows
At the highest contemporaneous flows (>75th percentile) Qratio and nitrate anomaly are negatively related (p≤0.05) at three (CLIN, WAPE and VALL) of the eight sites (Ta-ble 5). Also, at mid-high contemporaneous flows (>50th and
Table 5.Kendall’s tau and robust line results of nitrate anomaly and Qratio relationships, by contemporaneous flow class. Statistically
significant values (p <=0.05) are italicized [daily Q, daily streamflow; Interc, intercept;n, number of observations].
Low flow conditions Mid-low flow conditions Mid-high flow conditions High flow conditions
(daily Q<25th) (25th<daily Q<50th) (50th<daily Q<75th) (daily Q>75th)
Site River Tau pvalue Interc Slope n Tau pvalue Interc Slope n Tau pvalue Interc Slope n Tau pvalue Interc Slope n
CLIN Mississippi −0.09 0.46 0.57 −0.51 39 −0.06 0.49 0.40 −0.26 60 −0.11 0.12 0.57 −0.45 93 −0.18 <0.01 0.71 −0.59 122
WAPE Iowa −0.09 0.29 0.22 −0.32 58 −0.14 0.09 0.30 −0.20 65 −0.12 0.08 0.29 −0.15 91 −0.20 <0.01 0.36 −0.25 96
VALL Illinois −0.07 0.34 0.13 −0.10 79 −0.05 0.58 0.08 −0.05 70 −0.34 <0.01 0.42 −0.34 94 −0.25 <0.01 0.31 −0.24 125
GRAF Mississippi 0.09 0.31 −0.10 0.23 63 0.12 0.12 −0.12 0.23 78 −0.14 0.06 0.26 −0.21 81 −0.11 0.13 0.15 −0.16 85
HERM Missouri 0.10 0.14 −0.29 0.53 98 0.04 0.54 0.09 0.10 105 0.19 <0.01 −0.35 0.35 103 −0.02 0.71 0.08 −0.05 123
THEB Mississippi 0.01 0.86 0.01 0.03 85 −0.08 0.23 0.17 −0.16 93 −0.12 0.05 0.26 −0.21 115 −0.08 0.18 0.18 −0.11 130
GRCH Ohio −0.20 <0.01 0.70 −0.73 87 −0.16 0.04 0.41 −0.35 79 −0.17 <0.01 0.28 −0.29 111 −0.11 0.12 0.20 −0.16 101
MISS-OUT Mississippi −0.14 0.05 0.38 −0.36 91 −0.02 0.77 0.12 −0.06 84 −0.06 0.34 0.20 −0.14 109 0.02 0.69 −0.06 0.06 115
extensively in the literature for small forested and agricul-tural basins (Biron et al., 1999; Burt et al., 1988; Foster and Walling, 1978; Hornberger et al., 1994; Macrae et al., 2010; Walling and Foster, 1975), and is primarily attributed to the rapid movement of nitrate during a storm when the water ta-ble intersects soil horizons that have accumulated elevated stocks of nitrate during periods of low moisture. Our results suggest that a flushing response, previously documented for small, relatively homogenous basins during storms, is also observable at a regional scale during elevated streamflows. Conversely, at these sites above-average mean daily flow the previous year relates to lower nitrate anomalies during mid-high and mid-high flows, possibly because the mass of stored ni-trate has been depleted by increased export from the basin and uptake by plants earlier in the year. Noticeably, the flush-ing response at the highest flows (>75th percentile) is evi-dent only for the smallest basins (<250 000 km2)and no sta-tistically significant relationships occur at the highest flows for basins larger than 250 000 km2(Fig. 4). With the excep-tion of GRAF (Fig. 1), these smaller basins (CLIN, WAPE and VALL) have the highest percentage of farmed land (Ta-ble 1), which suggests that during high flows, dilution from an expanding variable source area with low nitrate concentra-tions likely obscures the influence of antecedent flow condi-tions (Creed and Band, 1998) in larger study basins, whereas dilution in smaller, more intensely farmed basins appears less common.
Contrary to other sites in the MRB, nitrate anomaly is pos-itively related to the Qratio in the Missouri River (HERM) during mid-high contemporaneous flows (Fig. 4). This ob-servation directly contradicts the flushing response model described for other sites. However, higher antecedent flow conditions have been related to increased nitrate export in other studies, though in these studies antecedent conditions were typically considered over time periods shorter than a year and in basins smaller than those considered in this study (e.g., Welsch et al., 2001; Macrae et al., 2010). Additionally, of all the basins in this study, the Missouri River is consid-ered the most heterogeneous; the variation in weather and terrain throughout this basin can cause parts of the Missouri River to experience markedly different hydrologic conditions simultaneously.
A possible explanation for this relationship in the Missouri River (HERM) is that the supply of exportable nitrate during a drought is reduced by irrigation. Approximately 25 percent of cropland in the Missouri River basin is irrigated, mak-ing it the most irrigated basin in this study (Table 1). Durmak-ing droughts, irrigation may remove nitrate from the soil horizon by leaching, denitrification, or uptake by crops (Aulakh and Bijay-Singh, 1997; Dinnes et al., 2002). Leached nitrate typ-ically moves downward below the active root zone, leading to elevated nitrate concentrations in groundwater (Burkart and Stoner, 2008; Stites and Kraft, 2001). Increased deni-trification occurs with irrigation because elevated soil mois-ture conditions increase microbial activity (de Klein and van Logtestijn, 1996; Groves and Bailey, 1997). Which process dominates during a drought is debatable and may depend on soil properties, fertilizer application rates, and climate (Aulakh and Bijay-Singh, 1997; Brown et al., 2011). In the Missouri River basin, a recent modeling effort found that in-creases in irrigation relate to dein-creases in total nitrogen ex-port on a regional scale (Brown et al., 2011). Irrigation likely occurs at a higher rate when the weather is drier than aver-age, according to a study in Illinois (Bowman and Collins, 1987), therefore, lower nitrate anomalies in the Missouri River (HERM) following a drought may occur because pro-cesses associated with irrigation do not allow for the accu-mulation of nitrate in soil during drier-than-average climatic conditions. However, the supply-limiting influence of irriga-tion does not account for the higher nitrate anomalies ob-served following a year with higher antecedent flows.
0.6 0.8 1.0 1.2 1.4 −2.5 −1.5 −0.5 0.5 1.5
Low flow conditions
CLIN
Mississippi R
0.6 0.8 1.0 1.2 1.4 −2.0 −1.5 −1.0 −0.50.0 0.5 1.0 1.5
0.6 0.8 1.0 1.2 1.4 1.6 −2.0 −1.5 −1.0 −0.50.0 0.5 1.0 1.5
0.6 1.0 1.4 1.8 −2.5
−1.5 −0.5 0.5 1.5
0.0 0.5 1.0 1.5 −2.5 −1.5 −0.5 0.5 1.5 W APE Iow a R
0.0 0.5 1.0 1.5 2.0 2.5 −1.0
−0.50.0 0.5 1.0 1.5
0.0 0.5 1.0 1.5 2.0 2.5 −1.5
−1.0 −0.50.0 0.5 1.0
0.0 1.0 2.0 3.0 −1.0 −0.5 0.0 0.5 1.0 −1.0 −0.5 0.0 0.5 1.0
0.0 0.4 0.8 1.2 1.6
V
ALL
Illinois R
0.0 0.5 1.0 1.5 −1.0
−0.5 0.0 0.5 1.0
0.0 0.5 1.0 1.5 2.0 −1.5 −1.0 −0.5 0.0 0.5 1.0
0.4 0.8 1.2 1.6 −2.0 −1.5 −1.0 −0.50.0 0.5 1.0
0.2 0.6 1.0 1.4 −2.0 −1.5 −1.0 −0.50.0 0.5 1.0 GRAF
Mississippi R −1.5−1.0 −0.50.0 0.5 1.0
0.0 0.4 0.8 1.2 1.6 −2.0 −1.5 −1.0 −0.50.0 0.5 1.0 1.5
0.4 0.8 1.2 1.6 2.0 −1.0 −0.5 0.0 0.5 1.0
0.4 0.8 1.2 1.6 2.0
0.4 0.6 0.8 1.0 1.2 1.4 −2.5 −1.5 −0.5 0.5 1.5 HERM Missour i R
0.4 0.8 1.2 1.6 −2.5 −1.5 −0.5 0.5 1.5 −2.5 −2.0 −1.5 −1.0 −0.50.0 0.5 1.0
0.4 0.8 1.2 1.6 2.0 2.4−2.0 −1.5 −1.0 −0.50.0 0.5 1.0
0.4 0.8 1.2 1.6 2.0
0.4 0.6 0.8 1.0 1.2 1.4 −2.0 −1.0 0.0 1.0 2.0 THEB
Mississippi R −1.0−0.5 0.0 0.5 1.0 1.5
0.4 0.8 1.2 1.6 2.0−1.00.4 0.8 1.2 1.6 −0.5 0.0 0.5 1.0 −1.5 −1.0 −0.5 0.0 0.5 1.0
0.4 0.8 1.2 1.6 2.0
0.4 0.6 0.8 1.0 1.2 1.4 −1.5 −1.0 −0.50.0 0.5 1.0 1.5
GRCH Ohio R
0.4 0.6 0.8 1.0 1.2 1.4 −1.5 −1.0 −0.5 0.0 0.5 1.0
0.4 0.8 1.2 1.6 −1.0
−0.5 0.0 0.5 1.0
0.4 0.8 1.2 1.6 −1.5 −1.0 −0.5 0.0 0.5 1.0
0.4 0.6 0.8 1.0 1.2 1.4 −1.5
−1.0 −0.50.0 0.5 1.0
MISS−OUT Mississippi R
0.6 0.8 1.0 1.2 1.4 1.6 −1.0
−0.5 0.0 0.5 1.0
0.4 0.8 1.2 1.6 −1.0
−0.5 0.0 0.5 1.0
0.6 0.8 1.0 1.2 1.4 1.6 −1.0 −0.5 0.0 0.5 1.0 Nitrate anomaly Qratio
High flow conditions Mid-high flow conditions
Mid-low flow conditions
2.0
Fig. 4.Plots of nitrate anomaly versus Qratio, by site and contemporaneous flow class. Statistically significant relationships (p≤0.05) are
denoted with a solid black line. Low flow conditions:<25th percentile, mid-low flow conditions:>25th and<50th percentile, mid-high
flow conditions:>50th and<75th percentile, and high flow conditions:>75th percentile. Note horizontal and vertical axes are specific to
each plot.
For the six sites with significant robust line relationships at mid-high or high (>50th percentile) contemporaneous flow classes (p≤0.05, Table 5) four Qratio values (Qri= 0.5,
0.75, 1.25 and 1.5) were applied using Eq. (5) to describe the potential response of nitrate concentration to different an-tecedent flow conditions. When the previous year’s flow is 25 percent lower than average (Qri= 0.75), nitrate concentration
may be about 6 to 9 percent higher than expected, for most sites where nitrate anomaly is negatively related to the Qra-tio (Table 4). Nitrate concentraQra-tion increases to about 11 to 19 percent, different from expected when the previous year’s
flow is 50 percent lower than average (Qri= 0.50). Nitrate
in direction; when flows the previous year were 25 to 50 cent lower than average, nitrate concentration is 8 to 16 per-cent lower than expected, respectively. With the exception of HERM, these patterns are consistent with the conceptual model of soil nitrate flushing during high and mid-high flows following a drought.
5.2.2 Relationships at mid-low and low
contemporaneous flows
Only the Ohio River (GRCH) and Mississippi outflow (MISS-OUT) demonstrate a significant negative response (p≤0.05) to the previous year’s flow at mid-low (>25th and<50th percentile) or low (<25th percentile) contempo-raneous flows (Fig. 4, Table 5). Other studies of meso-scale basins (<1000 km2)have found that, when not considering storm flows, inter-annual variations in climate act as a hydro-logic driver that influences the mixing of groundwater with different residence times (but rather stable nitrate concentra-tion) resulting in variations of nitrate concentration and flux in streamwater (Gascuel-Odoux et al., 2010). In this context, the significant relationships during mid-low and low contem-poraneous flows suggest the groundwater systems for GRCH and MISS-OUT may be influenced by annual variations in surface conditions or climate. However, the age of ground-water discharge to large rivers can be highly variable depend-ing on geology, terrain and soil characteristics (Sanford and Pope, 2013). Throughout the MRB, the lack of statistically significant (Table 5) or visually strong (Fig. 4) relationships between antecedent flow and nitrate anomaly at mid-low and low contemporaneous flows may simply indicate that there is no overland flow flushing the stored nitrate to the river during these flow conditions. However, it may also imply that surface runoff (overland flow) and shallow groundwater with residence times less than one year are likely the main pathways influenced by antecedent flow conditions. To bet-ter capture the influence of preceding moisture conditions on nitrate export during low and mid-low flows, multi-year metrics of antecedent flows (or moisture conditions) may be needed.
Using Eq. (5) and four Qratio values (Qri= 0.5, 0.75, 1.25
and 1.5) to translate nitrate anomalies to nitrate concentra-tion, it appears that nitrate concentration is more sensitive to changes in antecedent flow during low and mid-low con-temporaneous flows in the Ohio River (GRCH) and Missis-sippi outflow (MISS-OUT) than during high and mid-high flows at most other sites (Table 4). However, while the rela-tionships between Qratio and nitrate anomaly at mid-low and low flows at GRCH and MISS-OUT are statistically signifi-cant (p≤0.05), they do not appear as visually strong as those at other sites or higher contemporaneous flow conditions (Fig. 4). For mid-low and low flow classes, when the previ-ous year’s flow is 25 percent lower than average (Qri= 0.75),
nitrate concentration may be about 9 to 20 percent greater than expected. As antecedent flow conditions become
in-creasingly low (50 percent of average flow, Qri= 0.50)
ni-trate concentration can be 19 to 44 percent higher than ex-pected (Table 4). Similarly, during mid-low or low contem-poraneous flow conditions when the previous year’s flow is 25 percent and 50 percent higher than average (Qri= 1.25
and 1.50, respectively), nitrate concentration can be between 8 and 30 percent lower than expected at GRCH and MISS-OUT (Table 4).
6 Conclusions
Many of the sites in our study, except the Missouri River (HERM), show a negative relationship between antecedent flow conditions and nitrate anomaly when specific poraneous flow classes are considered, or when all contem-poraneous flows are considered together, suggesting that the influence of antecedent moisture conditions on nitrate ex-port is observable at a large scale. The higher-than-expected nitrate concentrations that occur if streamflow during the previous year was lower than average likely are due to the accumulation of soil nitrate during a drought, and subse-quent flushing with moderately high to high flows when the drought ends. Conversely, when the previous year’s flow was higher than average, lower nitrate concentrations possi-bly occur because more nitrate is likely taken up by crops, removed from the system through denitrification, or trans-ported with greater frequency (at lower concentrations) to the stream and groundwater earlier in the year. The positive re-lationship observed in the Missouri River (HERM) during mid-high contemporaneous flow conditions indicates rela-tionships between antecedent flow and nitrate anomaly not only vary by contemporaneous flow class and basin size, but also regionally. How higher-than-expected nitrate concentra-tions following a drought will affect the hypoxic zone in the Gulf of Mexico is debatable, and is likely influenced by fac-tors such as the timing of delivery to the Gulf (during the spring versus the fall, for example), the magnitude of flows transporting nitrate through the basin, the spatial and tempo-ral variability of sub-basins experiencing drought and flush-ing, and changes to nutrient management practices through-out the basin.
In this study we identified significant relationships be-tween antecedent flow conditions and nitrate concentration for regional-scale basins and propose several questions to en-courage future studies on this topic at similar scales.
– Do relationships between antecedent flows and ni-trate export change over time, as documented in other basins with long temporal records (Burt and Worrall, 2009; Burt and Worall, 2007)?
– Which specific aspects of drought conditions (such as the magnitude and duration of low flows, and the tim-ing of low and high flows) most influence nitrate ac-cumulation in an agricultural basin and its subsequent flushing to a stream?
– Based on these results, might it be possible to develop a better statistical model of nitrate export that simulta-neously uses both current and antecedent flow condi-tions to estimate concentration?
– How would one go about using new, high-frequency nitrate sensor data to improve understanding on how antecedent flows influence solute concentration? Will these new, richer data sets facilitate understanding of storage, transport, and processing of nitrogen within watersheds at this scale?
The results of our analysis suggest that nitrate transport in the Mississippi River basin is not a simple product of current hydrologic conditions and nitrate concentrations, but rather an integration of current conditions with past inputs of water and changes in nitrate supply that vary regionally and with contemporaneous flow class. Therefore, an improved under-standing of the evolving pattern of nitrate fluxes from the entire Mississippi River basin will require detailed analysis of the diverse patterns of nitrate export from the various sub-basins and their interaction with similarly variable spatial and temporal patterns of climate and management practices. As a result, the evaluation of progress in nutrient management will benefit from consideration of antecedent influences.
Acknowledgements. We thank the many US Geological Survey (USGS) personnel who collected the extensive data used in this report. We thank Brent Aulenbach (USGS) for compiling and preparing the streamflow and water chemistry data used in this report, and James Falcone (USGS) for providing geographic information for the study basins. We also thank several reviewers who posed questions that challenged us to sharpen our thinking about the major points in this paper.
Edited by: M. Hrachowitz
References
Alexander, R. B., Smith, R. A., Schwarz, G. E., Boyer, E. W., Nolan, J. V., and Brakebill, J. W.: Differences in Phosphorous and Nitro-gen Delivery to The Gulf of Mexico from the Mississippi River Basin, Environ. Sci. Technol. 42, 822–830, 2008.
Ashby, J. A., Bowden, W. B., and Murdoch, P. S.: Controls on denitrification in riparian soils in headwater catchments of a hardwood forest in the Catskill Mountains, USA, Soil Biol. Biochem., 30, 853–864, 1998.
Aulakh, M. S. and Bijay-Singh: Nitrogen losses and fertilizer N use efficiency in irrigated porous soils, Nutrient Cy. Agroecosyst., 27, 197–212, 1997.
Aulenbach, B. T., Buxton, H. T., Battaglin, W. A., and Coupe, R. H.: Flow and nutrient fluxes of the Mississippi-Atchafalaya River Basin and subbasins for the period of record through 2005, US Geological Survey Open-File Report 2007–1080, 2007. Bernal, S. and Sabater, F.: Changes in discharge and solute
dynam-ics between hillslope and valley-bottom intermittent streams, Hy-drol. Earth Syst. Sci., 16, 1595–1605, doi:10.5194/hess-16-1595-2012, 2012.
Biron, P. M., Roy, A. G., Courschesne, F., Hendershot, W. H., Cote, B., and Fyles, J.: The effect of antecedent moisture conditions on the relationship of hydrology to hydrochemistry in a small forested watershed, Hydrol. Process. 13, 1541–1555, 1999. Bowman, J. A. and Collins, M. A.: Impacts of irrigation and drought
on Illinois ground-water resources, State of Illinois, Department of Energy and Natural Resources, Illinois state water survey, ISWS/RI-109/87, 31 pp., 1987.
Brown, J. B., Sprague, L. A., and Dupree, J. A.: Nutrient sources and transport in the Missouri River basin, with emphasis on the effects of irrigation and reservoirs, J. Am. Water Resour. Assoc. 47, 1034–1060, 2011.
Burkart, M. R. and Stoner, J. D.: Chapter 7. Nitrogen in ground-water associated with agricultural systems, in: Nitrogen in the Environment: Sources, Problems, and Management (2nd Edn.), Academic Press/Elsevier, Amsterdam, edited by: Hatfield, R. F. and Follett, J. L., 177–202, 2008.
Burt, T. and Worrall, F.: Non- stationary in long time series: some curious reversals in the “memory” effect, Hydrol. Process. 21, 3529–3531, 2007.
Burt, T. P. and Worrall, F.: Stream nitrate levels in a small catchment in south west England over a period of 35 years (1970–2005), Hydrol. Process. 23, 2056–2068, 2009.
Burt, T. P., Arkell, B. P., Trudgill, S. T., and Walling, D. E.: Stream nitrate levels in a small catchment in south west England over a period of 15 years, Hydrol. Process. 2, 267–284, 1988.
Cooper, R., Thoss, V., and Watson, H.: Factors influencing the re-lease of dissolved organic carbon and dissolved forms of nitro-gen from a small upland headwater during autumn runoff events, Hydrol. Process. 21, 622–633, 2007.
Creed, I. F. and Band, L. E.: Export of nitrogen from catchments within a temperate forest: Evidence for a unifying mechanism regulated by variable source area dynamics, Water Resour. Res., 34, 3105–3120, 1998.
de Klein, C. A. M. and van Logtestijn, R. S. P.: Denitrification in grassland soils in the Netherlands in relation to irrigation, N-application rate, soil water content and soil temperature, Soil Biol. Biochem., 28, 231–237, 1996.
Dinnes, D. L., Karlen, D. L., Jaynes, D. B., Kaspar, T. C., Hatfield, J. L., Colvin, T. S., and Cambardella, C. A.: Nitrogen management strategies to reduce nitrate leaching in tile-drained Midwestern soils, Agron. J., 94, 153–171, 2002.
Donner, S. D. and Scavia, D.: How climate controls the flux of ni-trogen by the Mississippi River and the development of hypoxia in the Gulf of Mexico, Limnol. Oceanogr., 52, 856–861, 2007. Emmerich, W. E. and Heitschmidt, R. K.: Drought and Grazing: II.
Effects on runoff and water quality, J. Range Manage., 55, 229– 234, 2002.
Foster, I. D. L. and Walling, D. E.: The effects of the 1976 drought and autumn rainfall on stream solute levels, Earth Surf. Process. 3, 393–406, 1978.
Ferguson, R., Shapiro, C., Wortmann, C., Shaver, T., and Hergert, G.: University of Nebraska-Lincoln Extension, CropWatch, Ne-braska crop production & pest management information, Check-ing for Residual nitrate this sprCheck-ing: http://cropwatch.unl.edu/ web/cropwatch/archive?articleID=5121463 (last access: 21 June 2013), 2013.
Garrett, J.: Concentrations, loads and yields of select constituents from major tributaries of the Mississippi and Missouri Rivers in Iowa, Water Years 2004–2008, US Geological Survey Scientific Investigations Report 2012-5240, 72 pp., 2012.
Gascuel-Odoux, C., Aurousseau, P., Durand, P., Ruiz, L., and Mole-nat, J.: The role of climate on inter-annual variation in stream nitrate fluxes and concentrations, Sci. Total Environ. 408, 5657– 5666, 2010.
Groves, S. J. and Bailey, R. J.: The influence of sub-optimal irriga-tion and drought on crop yield, N uptake and risk of N leaching from sugarbeet, Soil Use Manage., 13, 190–195, 1997.
Helsel, D. R. and Hirsch, R. M.: Statistical methods in water re-sources, Techniques of water-resources investigations, Book 4, chapter A3, US Geological Survey, 522 pp., 2002.
Hirsch, R. M., Moyer, D. L., and Archfield, S. A.: Weighted regres-sions on time, discharge, and season (WRTDS), with an applica-tion to Chesapeake Bay river inputs, J. Am. Water Resour. Assoc. 46, 857–880, 2010.
Hornberger, G. M., Bencala, K. E., and McKnight, D. M.: Hydro-logical controls on dissolved organic carbon during snowmelt in the Snake River near Montezuma, Colorado, Biogeochemistry 25, 147–165, 1994.
Hrachowitz, M., Savenije, H. H. G., Blöschl, G., McDonnell, J. J., Sivapalan, M., Pomeroy, J. W., Arheimer, B., Blume, T., Clark, M. P., Ehret, U., Fenicia, F., Freer J. E., Gelfan, A., Gupta, H. V., Hughes, D. A., Hut, R. W., Montanari, A., Pande, S., Tetzlaff, D., Troch, P.A., Uhlenbrook, S., Wagener, T., Winsemius, H. C., Woods, R. A., Zehe, E., and Cudennec, C.: A decade of Predic-tions in Ungauged Basins (PUB) – a review, Hydrol. Sci. J., 58, 1198–1255, 2013.
Kalkhoff, S. J.: Occurrence and Transport of Nutrients in the Mis-souri River Basin, April through September 2011, U.S. Geologi-cal Survey Professional Paper 1798-G, 23 pp., 2013.
Lange, J. and Haensler, A.: Runoff generation following a pro-longed dry period, J. Hydrol., 464–465, 157–164, 2012. Lucey, K. J. and Goolsby, D. A.: Effects of Climatic Variations
over 11 Years on Nitrate-Nitrogen Concentrations in the Raccoon River, Iowa, J. Environ. Qual., 22, 38–46, 1993.
Macrae, M. L., English, M. C., Schiff, S. L., and Stone, M.: In-fluence of antecedent hydrologic conditions on patterns of hy-drochemical export from a first-order agricultural watershed in Southern Ontario, Canada, J. Hydrol., 389, 101–110, 2010. National Oceanic and Atmospheric Administration, National
Cli-matic Data Center, Climate Monitoring Group Palmer Hy-drological Drought Index – May 2012 to April 2013, avail-able at: http://www.ncdc.noaa.gov/oa/climate/research/prelim/ drought/palmer.html (last access: 21 June 2013), 2013.
Nolan, J. V., Brakebill, J. W., Alexander, R. B., and Schwarz, G. E., ERF1_2 – Enhanced River Reach File 2.0: http://water. usgs.gov/GIS/metadata/usgswrd/XML/erf1_2.xml (last access: 2 June, 2013), 2002.
Pervez, M. S. and Brown, J. F.: Mapping irrigated lands at 250-m scale by merging MODIS data and national agricultural statistic, Remote Sens., 2, 2388–2414, 2010.
Rabalais, N. N. and Turner, R. E.: Hypoxia in the northern Gulf of Mexico: description, causes and change, in: Coastal Hypoxia: Consequences for living resources and ecosystems, Coastal and Estuarine Studies, American Geophysical Union, 1–36, 2001. Randall, G. W., Vetsch, J. A., and Huffman, J. R.: Nitrate losses in
subsurface drainage from a corn-soybean rotation as affected by time of nitrogen application and use of Nitrapyrin, J. Environ. Qual., 32, 1764–1772, 2003.
Rehm, G., Schmitt, M., and Eliason, R., University of Minnesota-Extension, Using soil nitrate test in Minnesota, WW-07310:
available at: http://www.extension.umn.edu/distribution/
cropsystems/DC7310.html (last access: 21 June 2013), 2009. Rozemeijer, J. C., van der Velde, Y., van Geer, F. C., Bierkens, M.
F. P., and Broers, H. P.: Direct measurements of the tile drain and groundwater flow route contributions to surface water contam-ination: From field-scale concentration patterns in groundwater to catchment-scale surface water quality, Environ. Pollut., 158, 3571–3579, 2010.
Sanford, W. E. and Pope, J. P.: Quantifying Groundwater’s Role in Delaying Improvements to Chesapeake Bay Water Quality, Env-iron. Sci. Technol., 47, 13330–13338, 2013.
Sawyer, J.: Iowa State University-Extension, Soil profile nitrate in corn fields following the 2012 drought, available at: http://www. extension.iastate.edu/CropNews/2013/0221sawyer.htm (last ac-cess: 21 June 2013), 2013.
Scavia, D., Rabalais, N. N., Turner, R. E., Justic, D., and Wiseman, W. J.: Predicting the response of Gulf of Mexico hypoxia to vari-ation in Mississippi River nitrogen load, Limnol. Oceanogr., 48, 951–956, 2003.
Shaman, J., Steiglitz, M., and Burns, D.: Are big basins just the sum of small catchments?, Hydrol. Process., 18, 3195–3206, 2004. Sidle, R. C.: Field observations and process understanding in
hy-drology: essential components in scaling, Hydrol. Process., 20, 1439–1445, 2006.
Sivapalan, M.: Process complexity at hillslope scale, process sim-plicity at the watershed scale: is there a connection?, Hydrol. Pro-cess., 17, 1037–1041, 2003.
Soulsby, C., Tetzlaff, D., Dunn, S. M., and Waldron, S.: Scaling up and out in runoff process understanding: insights from nested ex-perimental catchment studies, Hydrol. Process., 20, 2461–2465, 2006.
Sprague, L. A., Hirsch, R. M., and Aulenbach, B. T.: Nitrate in the Mississippi River and its tributaries, 1980 to 2008: Are we mak-ing progress?, Environ. Sci. Technol., 45, 7209–7216, 2011. Stites, W. and Kraft, G. J.: Nitrate and chloride loading to
ground-water from an irrigated north-central US sand-plain vegetable field, J. Environ. Qual., 30, 1176–1184, 2001.
Turner, R. E., Rabalais, N. N., and Justic, D.: Predicting summer hypoxia in the northern Gulf of Mexico: Riverine N, P, and Si loading, Mar. Pollut. Bull., 52, 139–148, 2006.
Vecchia, A.: Relation between climate variability and stream water quality in the continental United States, Hydrol. Sci. Technol., 19, 77–98, 2003.
Vecchia, A. V., Martin, J. D., and Gilliom, R. J.: Modeling vari-ability and trends in pesticide concentrations in streams, J. Am. Water Resour. Assoc., 44, 1308–1324, 2008.
Walling, D. E. and Foster, I. D. L.: Variations in the natural chemical concentration of river water during flood flows, and the lag effect: some further comments, J. Hydrol., 26, 237–244, 1975. Webb, B. W. and Walling, D. E.: Stream solute behavior in the River
Exe basin, Devon, UK, Dissolved loads of rivers and surface wa-ter quantity/quality relationships, Proceedings of the Hamburg Symposium, August 1983, IAHS Publ no. 141, 153–169, 1984. Welsch, D. L., Kroll, C. N., McDonnell, J. J., and Burns, D. A.: