TCD
8, 4779–4822, 2014Characteristics of mountain permafrost
in British Columbia
A. Hasler et al.
Title Page
Abstract Introduction
Conclusions References
Tables Figures
◭ ◮
◭ ◮
Back Close
Full Screen / Esc
Printer-friendly Version Interactive Discussion
Discussion
P
a
per
|
Discus
sion
P
a
per
|
Discussion
P
a
per
|
Discussion
P
a
per
|
The Cryosphere Discuss., 8, 4779–4822, 2014 www.the-cryosphere-discuss.net/8/4779/2014/ doi:10.5194/tcd-8-4779-2014
© Author(s) 2014. CC Attribution 3.0 License.
This discussion paper is/has been under review for the journal The Cryosphere (TC). Please refer to the corresponding final paper in TC if available.
The influence of surface characteristics,
topography, and continentality on
mountain permafrost in British Columbia
A. Hasler1,2, M. Geertsema1, V. Foord1, S. Gruber3, and J. Noetzli4
1
Ministry of Forest, Land and Natural Resources Operation of British Columbia, 1044 Fifth Avenue, Prince George BC V2L 5G4, Canada
2
Department of Geosciences, University of Fribourg, Chemin du Musee 4, 1700 Fribourg, Switzerland
3
Department of Geography and Environmental Studies, Carleton University, 1125 Colonel By Drive, Ottawa ON K1S 5B6, Canada
4
Glaciology, Geomorphodynamics and Geochronology, Department of Geography, University of Zurich, Winterthurerstr 190, 8057 Zurich, Switzerland
Received: 2 July 2014 – Accepted: 11 August 2014 – Published: 5 September 2014
Correspondence to: A. Hasler (andreas.hasler@unifr.ch)
TCD
8, 4779–4822, 2014Characteristics of mountain permafrost
in British Columbia
A. Hasler et al.
Title Page
Abstract Introduction
Conclusions References
Tables Figures
◭ ◮
◭ ◮
Back Close
Full Screen / Esc
Printer-friendly Version Interactive Discussion
Discussion
P
a
per
|
Discus
sion
P
a
per
|
Discussion
P
a
per
|
Discussion
P
a
per
|
Abstract
Thermal offset and surface offset are terms that describe the deviation of the mean annual ground temperature from the mean annual air temperature. These offsets are controlled by surface characteristics and topo-climatic factors on a micro- and meso-scales. Macro-climatic conditions may, however, influence the effectiveness of the
re-5
sponsible processes. Existing knowledge on surface- and topography-specific offsets is not easily transferable and limits the applicability of empirical permafrost distribution models over large areas with macro-climatic gradients. In this paper we describe sur-face and thermal offsets derived from distributed measurements at seven field sites in British Columbia. Key findings are (i) a surprisingly small variation of the surface
10
offsets between different surface types and small thermal offsets in general (exclud-ing wetlands and peat), (ii) a clear influence of the micro-topography at wind exposed sites (snow cover erosion), (iii) a north–south difference of the surface offset of 4◦C in near-vertical bedrock and of 1.5–3◦C on open (no canopy) gentle slopes, (iv) only small macro-climatic differences caused by the reverse influence of snow cover
thick-15
ness and annual air temperature amplitude. These findings suggest, that empirical permafrost models based on topo-climatic variables may be applicable across regions with significant macro-climatic differences.
1 Introduction
To estimate permafrost distribution and characteristics knowledge of site specific
cou-20
pling between the lower atmosphere and ground is needed. Surface offsets (SO), de-fined as MAGST minus MAAT (where MAGST is the mean annual ground–surface temperature and MAAT is the mean annual air temperature), and thermal offsets (TO), defined as TTOP minus MAGST (where TTOP is the mean annual temperature at the top of permafrost), are terms to describe this coupling (Lunardini, 1978). These offsets
25
charac-TCD
8, 4779–4822, 2014Characteristics of mountain permafrost
in British Columbia
A. Hasler et al.
Title Page
Abstract Introduction
Conclusions References
Tables Figures
◭ ◮
◭ ◮
Back Close
Full Screen / Esc
Printer-friendly Version Interactive Discussion
Discussion
P
a
per
|
Discus
sion
P
a
per
|
Discussion
P
a
per
|
Discussion
P
a
per
|
teristics because these conditions cause a large variability in (solar and long-wave) radiation, snow cover insulation and near-surface heat transfer. Empirical permafrost models implicitly apply the concept of these offsets by estimating the ground thermal conditions (or permafrost probability) based on MAAT (or elevation) and proxy-variables of the topo-climatic effects and the surface conditions (Riseborough et al., 2008). The
5
assessment of the variation and control of surface and thermal offsets in the moun-tain ranges of British Columbia, Canada, is therefore essential for an estimation of the province wide permafrost distribution and the analysis of related natural hazard. This study presents the first distributed ground temperature records in potential permafrost areas of this region, which are necessary for such a task.
10
For mountain permafrost the influence of (steep) topography is well described for some mid-latitude mountain ranges considering meso-scale variability in solar radia-tion (insolaradia-tion), air temperature, snow deposiradia-tion and snow redistriburadia-tion (cf. Harris et al., 2009 for a literature review on this subject). The influence of surface character-istics on mountain permafrost is addressed in some case studies (Gubler et al., 2011;
15
Schneider et al., 2012) for high-alpine surface types. British Columbia’s higher latitude with mountain permafrost extending below tree line, however, alters the influence of the surface characteristics and topography compared to the permafrost in the Alps or other mid-latitude mountain ranges. Studies elsewhere in Canada (Harris, 2008; Bonnaven-ture et al., 2012) are either not spatially distributed or rely on BTS measurements so
20
they can not be easily extrapolated (without local permafrost evidences) to our study region. Hence, we aim to estimate the region-specific variation of the temperature off -sets (SO, TO) dependent at micro- and meso-scale gradients in surface characteristics and topography.
At the macro-climatic scale, variations in MAAT are the primary determinant of
per-25
TCD
8, 4779–4822, 2014Characteristics of mountain permafrost
in British Columbia
A. Hasler et al.
Title Page
Abstract Introduction
Conclusions References
Tables Figures
◭ ◮
◭ ◮
Back Close
Full Screen / Esc
Printer-friendly Version Interactive Discussion
Discussion
P
a
per
|
Discus
sion
P
a
per
|
Discussion
P
a
per
|
Discussion
P
a
per
|
to estimate the permafrost conditions on the large-scale is the question if the surface offset (SO) is strongly influenced by macro-climatic parameters (e.g. precipitation and continentality). This question is an other focus of this study because British Columbia and our field sites span a large gradient in macro-climatic conditions.
Due to the patchy characteristics of our data, this paper comprises a detailed
de-5
scription of the data processing and resulting uncertainties in SO and TO (Sect. 3.1 and 3.2). Accordingly, one scope of the paper is to provide a method to threat data gaps, which are typical for distributed GST (ground–surface temperature) records. For illustration purpose in the discussion (Sect. 4) we briefly introduce a 3-dimensional heat conduction model (Sect. 3.3) and a simple thermal diode model (Sect. 3.4). In Sect. 4.1
10
we present the field data and discuss them (and respective model results) regarding the three mentioned gradients (Sect. 4.2 surface characteristics; 4.3 topography and 4.4 macro-climate): these 3 gradients are important for the mountain permafrost distri-bution and the interpretation of its prediction (permafrost maps) in British Columbia.
2 Field sites and instrumentation
15
2.1 General site description
The macro-topography of British Columbia is characterized by two major mountain sys-tems, the Coast Mountains and the Rocky Mountains, with plateaus and lesser ranges between them (Fig. 1). Being at mid latitude (49–60◦N), within the west-drift zone, the general meridional orientation (NNW to SSE) of these mountain systems is responsible
20
for pronounced differences in climatic conditions between their coastal and continental sides. Large gradients in precipitation and continentality (annual temperature amplitude for a given latitude) characterize the climate of British Columbia (Fig. 1). These diff er-ences exist both at a macro-climatic scale with continentality increasing with distance from the Pacific Ocean, and also at a meso-scale with orographic effects such as
pro-25
TCD
8, 4779–4822, 2014Characteristics of mountain permafrost
in British Columbia
A. Hasler et al.
Title Page
Abstract Introduction
Conclusions References
Tables Figures
◭ ◮
◭ ◮
Back Close
Full Screen / Esc
Printer-friendly Version Interactive Discussion
Discussion
P
a
per
|
Discus
sion
P
a
per
|
Discussion
P
a
per
|
Discussion
P
a
per
|
gradient exists in the Coast Mountains and continentality is particularly pronounced at lower elevations in, and east of, the Rocky Mountains (Wang et al., 2012).
The seven field sites of this study are located in northern BC between 54◦45′ and 59◦N. One is in the Coast Mountains (HUD: Hudson Bay Mtn.), two are in the Rocky Mountains (NON: Nonda, POP: Poplars) and four are at the occidental edge of the
5
Rocky Mountains (GUN: Mt. Gunnel, TET: Tetsa, PIN: Pink Mountain, MID: Middlefork) (Fig. 1). HUD, NON, GUN and PIN are high elevation sites, which means they are above the tree line and at or near mountain tops while the other sites are below tree line and close to the valley floor, or in relatively flat areas. The climate at the field sites, ranges from moderate-humid alpine (Coast Mts.) to subarctic-continental
(low-10
land north-eastern BC). The mean annual air temperature (MAAT) at all sites is in the range of−5 to+1◦C (Wang et al., 2012), hence at all sites both permafrost and non-permafrost conditions are plausible depending on their local characteristics. In even warmer conditions, permafrost only occurs in very unusual circumstances such as rock glacier lobes or avalanche/debris cones.
15
The Nonda (1670 m a.s.l.), Pink Mountain (1750 m a.s.l.), and Hudson Bay Moun-tain sites (∼1950–2150 m a.s.l.) are clearly within the Alpine Tundra (AT) biogeo-climatic zone (Meidinger and Pojar, 1991) above treeline. The Mount Gunnel sites (1470 m a.s.l.) are at the lower boundary of the AT zone, above treeline, but transition-ing into the forested Black and White Boreal Spruce (BWBS) zone. With the exception
20
of Hudson Bay Mountain, all of these alpine sites are strongly windswept, resulting in very little snow cover.
The remaining sites occur well within forested biogeoclimatic zones. The Middlefork cluster (1000 m) is well within the BWBS zone, but includes a permafrost-underlain peat plateau (dominated by Sphagnum and a sparse cover of black spruce (Picea 25
ex-TCD
8, 4779–4822, 2014Characteristics of mountain permafrost
in British Columbia
A. Hasler et al.
Title Page
Abstract Introduction
Conclusions References
Tables Figures
◭ ◮
◭ ◮
Back Close
Full Screen / Esc
Printer-friendly Version Interactive Discussion
Discussion
P
a
per
|
Discus
sion
P
a
per
|
Discussion
P
a
per
|
Discussion
P
a
per
|
posures. There is striking aspect control on vegetation here. South-facing slopes host trembling aspen (Populus tremuloides) and lodgepole pine (Pinus contorta) and may have a grassy understory. Forest floors have relatively thin humus forms. North-facing slopes tend to have a sparse cover of black spruce (Picea mariana) and very thick mor (mossy) humus forms. Permafrost can usually be found some 60 cm below the forest
5
floor.
Using instrumental data from nearby Environment Canada weather stations, climate trends (1912–2003) for the region containing the Hudson Bay Mountain field site have increased significantly by 0.8◦C in mean annual temperature (Egginton, 2005). Climate trends (1937–2003) for the region containing the remaining field sites in north-east BC
10
have a significant increase of 1.3◦C in mean annual temperature, 3.3◦C significant increase in extreme minimum temperature, and a 42 % significant decrease in winter precipitation (Egginton, 2005).
2.2 Measurement parameters and instrumentation
The seven field sites vary regarding the sampling of the local conditions (topographic
15
situation and surface characteristics) and so does the measurement setup. This non-standardised and not strictly systematic design is on one side due to absence/presence of various local conditions between field sites: e.g. steep bedrock is present only at some high-elevation sites whereas surface characteristics such as thick moss layers or forests are not covered there (Table 1). On the other hand, some parameters are
20
challenging to obtain or meaningless at local scale (e.g. air temperature in rock faces or direct radiation in forests). The distance between individual measurement locations ranges from some decametres (e.g. GUN and NON site) to a few kilometers (low el-evation sites POP, TET, and MID). For these reasons meteorological parameters are measured at one central location (wx) per high elevation site. The low elevation sites
25
TCD
8, 4779–4822, 2014Characteristics of mountain permafrost
in British Columbia
A. Hasler et al.
Title Page
Abstract Introduction
Conclusions References
Tables Figures
◭ ◮
◭ ◮
Back Close
Full Screen / Esc
Printer-friendly Version Interactive Discussion
Discussion
P
a
per
|
Discus
sion
P
a
per
|
Discussion
P
a
per
|
Discussion
P
a
per
|
The measured parameters are the temperature of the air (Tair), the ground–surface
(Tsurf), and the ground (Tground). The ground temperatures are sensed at a depth
be-tween 0.3 and 1.3 m for soils and debris, but at 0.1 m depth for bedrock. At the central weather stations (wx) other parameters such as rainfall, relative humidity, direct short wave irradiation, wind direction and speed, and barometric pressure are measured
5
but used only as Supplement in the present analysis. The weather stations are On-set Hobo Weather Station (H-21 or U30) and air temperature is measured in a solar radiation shield at 1.4 m above ground with a S-THB-M002 Temperature/RH Smart Sensor (Tempcon), which provides an accuracy of ±0.2◦C above 0◦C and ±0.4◦C above –30◦C. The other temperatures are recorded withHobo U23 pro V2 2-channel
10
mini loggers (Onset) which provide a similar accuracy. For air temperature the external sensors of the mini loggers are shielded with a similar radiation shield at 1.4 m height. Ground surface temperature is usually recorded with the internal temperature sensor of the mini logger, which is buried a few centimeters in the organic layer or debris, to minimize albedo effects. For near-surface rock temperatures an external sensor is
15
placed in a small drilling and sealed with silicon glue. Physical disturbances (e.g. radi-ation influence of air temperature) are assumed to be below the sensor accuracy (cf. Nakamura and Mahrt, 2005) on the level of daily aggregates and even smaller for an-nual mean. Temperatures are sensed at 4 min sample intervals and aggregated and stored to hourly values.
20
The field sites selected and the sampling of local conditions, reflect the focus on mountain permafrost. Gradients in hydrological conditions (wetlands, peats etc.) are barely considered in this study despite their important role for the permafrost distri-bution in low-land areas. Table 1 summarizes the topographic situations and surface characteristics of the 41 locations with ground temperature measurements and the
25
TCD
8, 4779–4822, 2014Characteristics of mountain permafrost
in British Columbia
A. Hasler et al.
Title Page
Abstract Introduction
Conclusions References
Tables Figures
◭ ◮
◭ ◮
Back Close
Full Screen / Esc
Printer-friendly Version Interactive Discussion
Discussion
P
a
per
|
Discus
sion
P
a
per
|
Discussion
P
a
per
|
Discussion
P
a
per
|
3 Data processing and analysis methods
3.1 Pre-processing of raw temperature time series
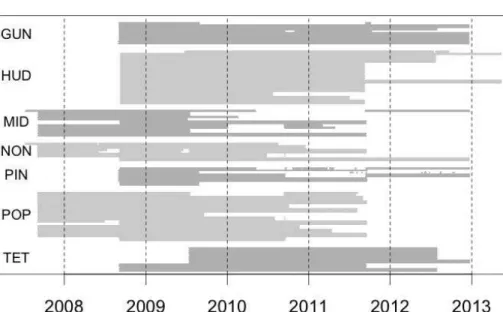
At the field sites MID, NON and POP measurements were initiated in summer 2007, whereas, data acquisition started in 2008 for the other field sites. The data time se-ries for this analysis were retrieved between summer 2011 and 2013 for the last time.
5
Figure 2 gives an overview of the data completeness after filtering of invalid data. This filtering comprises two procedures and produces gaps of different characteristics: (a) automated filtering of invalid/corrupted values (not numeric or out of realistic range) cause short gaps (gap type I: single values), (b) manual filtering of values from broken sensors (e.g. water damage or cable disruption) are applied over long time periods and
10
cause long gaps (gap type II: weeks to months). Maintenance effects on logger oper-ation lead to missing data with the following characteristics: data read out lead to type I gaps while low power supply lead to type II gaps. The majority of the gaps observed in our data is of type II mainly caused by sensor damage and low battery except for the air temperature on Pink Mt. (Fig. 2). Because of these gaps it is not possible to
15
directly compare all time series and simply calculate annual means for the same years. To account for this data characteristic we applied the processing described in Sect. 3.2. For all the data analysed in this study there is at least one continuous year of valid data. One exception is the air temperature measurement of the weather station at Mt. Gunnel. The very good correlation of 11 months existing data with the surface
temper-20
TCD
8, 4779–4822, 2014Characteristics of mountain permafrost
in British Columbia
A. Hasler et al.
Title Page
Abstract Introduction
Conclusions References
Tables Figures
◭ ◮
◭ ◮
Back Close
Full Screen / Esc
Printer-friendly Version Interactive Discussion
Discussion
P
a
per
|
Discus
sion
P
a
per
|
Discussion
P
a
per
|
Discussion
P
a
per
|
3.2 Calculation of mean annual temperatures and their inter-comparability
Annual means of temperature time series (MAT) depend on the averaging period and the completeness of the raw data (Fig. 3). Surface and thermal offsets, the differences between such annual means, are highly error sensitive to this mean calculation. As described above, our data is characterized by inconsistencies regarding the available
5
measurement periods and data completeness. To minimize errors introduced by the data aggregation and to avoid misinterpretations of the resulting offsets due to tem-poral variations, we conduct the following processing steps: 1. Calculate daily mean temperature; 2. Calculate running mean annual temperature; 3. MAT statistics; and 4. Surface and thermal offsets calculation.
10
The hourly data is aggregated to daily means. Gaps up to two missing values per day are interpolated, if more values are missing no value (“NA”) is introduced to the daily mean data. This is important to avoid effects of systematic type I gaps.
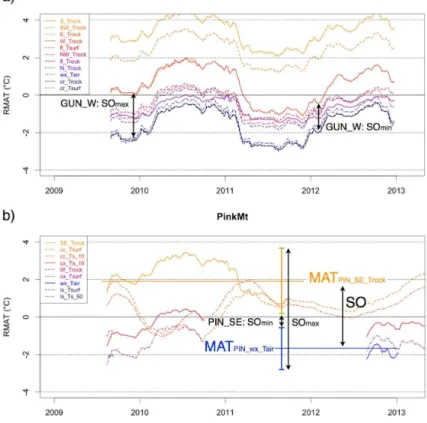
Then, running mean annual temperatures (RMAT) are calculated for a 365 day win-dow with 99 % of data available (Fig. 4). In Fig. 4 the example of Pink Mt. illustrates
15
possible problems with the inter-comparability of annual means if time series are in-complete or if the running means are asynchronous: MATs from different points in time cannot be easily compared and offsets between RMATs vary strongly for some loca-tions (Fig. 4b). This is considered with the next two steps of the data processing, the MAT statistics calculation and the surface/thermal offset calculation.
20
For the MAT statistics the mean and the spread of all RMAT values are calculated (minima, maxima and standard deviation) over the entire available data. This allows us to obtain a MAT value independent of sufficient data within particular calendar years and to get measures for the temporal variation of the MATs. We use the min.- and max.-values as indicator of MAT spread (Fig. 4b), because the variations are not normally
25
dur-TCD
8, 4779–4822, 2014Characteristics of mountain permafrost
in British Columbia
A. Hasler et al.
Title Page
Abstract Introduction
Conclusions References
Tables Figures
◭ ◮
◭ ◮
Back Close
Full Screen / Esc
Printer-friendly Version Interactive Discussion
Discussion
P
a
per
|
Discus
sion
P
a
per
|
Discussion
P
a
per
|
Discussion
P
a
per
|
ing the overlapping time period is chosen (e.g. cx_Tsurf for wx_Tair at Pink Mt., Fig. 4). The mean annual temperature of such a short temperature time series is estimated by:
MAT=RMAToverlap−RMATref overlap+RMATref (1)
with RMAToverlapbeing the RMAT time series of interest where it overlaps with the ref-5
erence, RMATref overlapbeing the reference time series of the same period and RMATref
being the mean of the entire reference time series. The uncertainties of this estimate are approximated by
UMAT=σ(RMAToverlap−RMATref_overlap)×
σ(RMATref)
σ(RMATref_overlap)
(2)
10
assuming that the variations of the difference of the two variables scales with the relative variance captured by the overlapping period. This uncertainty is then added/subtracted to max./min. values of the MAT statistics of the temperature of in-terest, resulting in a larger spread for shorter time series (higher uncertainty; cf. Fig. 4b PIN_wx_Tair). The uncertainty introduced by measurement errors and data
15
pre-processing (about±0.2◦C) are small compared to the temporal variations and neg-ligible for the MAT statistics if considered as independent errors (root of square sum). Figure 5 shows the result of the MAT statistics on the example of Pink Mountain, which is a worst case in terms of data continuity:W_Trock or thels_Tsurf MAT values show spreads up to 4.5◦C due to the limitation of the available data.
20
The surface and thermal offsets are calculated by a simple subtraction of the MAT values. However, the spread of these offsets is smaller than spreads of the MATs in many cases because the temporal variations of RMATs are often synchronous (cf. Fig. 4a). Given this, the minimum and maximum difference between the RMATs (e.g. SOmin/maxat GUN_W) is used as indication of the uncertainty of the offsets, introduced 25
TCD
8, 4779–4822, 2014Characteristics of mountain permafrost
in British Columbia
A. Hasler et al.
Title Page
Abstract Introduction
Conclusions References
Tables Figures
◭ ◮
◭ ◮
Back Close
Full Screen / Esc
Printer-friendly Version Interactive Discussion
Discussion
P
a
per
|
Discus
sion
P
a
per
|
Discussion
P
a
per
|
Discussion
P
a
per
|
statistics are added to obtain a conservative (large) uncertainty estimate (cf. SOmin/max of PIN_SE in Fig. 4b). To these uncertainty values an independent measurement error of±0.3◦C is added (square root of quadratic sum) to obtain a total uncertainty for each temperature offset (c.f. Hasler et al., 2011).
Uoffset= q
(Offsetmax−Offsetmin)2+0.62 (3)
5
For the Hudson Bay Mt. field site, where the air temperature is measured at a meteo-rological station at 300 m to 500 m lower elevation (Table 1), an air temperature lapse rate between −3.75 to −6.25◦C km−1 is used for the calculation of the mean annual air temperature (MAAT), the SO and its uncertainty. In Fig. 5b an example of a
tem-10
perature profile shows the surface and thermal offset at one location at Pink Mt. In the further analysis, offsets are treated as significant (solid lines) if they are larger than the (inner) half of the uncertainties (Uoffset/2) indicated by the spreads in Fig. 5b.
The annual temperature amplitudes (ATA) used in this article are the differences between mean July and January temperatures divided by 2. The N factors used in
15
the discussion of the snow cover influence are calculated on a seasonal and biweekly basis by dividing the mean surface temperature (or freezing index If) through the mean air temperature (Tsurf/Tairor Ifsurf/Ifair). Because the relative errors of these calculations
are much smaller, we do not detail these calculations and their uncertainties here.
3.3 Heat conduction model for visualisation of rock temperatures
20
For the visualization of the aspect-dependent rock surface temperatures and the cool-ing effect of air-ventilated clefts on the subsurface thermal field we apply a three-dimensional heat conduction model of the Gunnel field site. The simulation is based on the approach by Noetzli (2008), to which we refer for details on the modeling procedure, sensitivity studies, and validation.
25
TCD
8, 4779–4822, 2014Characteristics of mountain permafrost
in British Columbia
A. Hasler et al.
Title Page
Abstract Introduction
Conclusions References
Tables Figures
◭ ◮
◭ ◮
Back Close
Full Screen / Esc
Printer-friendly Version Interactive Discussion
Discussion
P
a
per
|
Discus
sion
P
a
per
|
Discussion
P
a
per
|
Discussion
P
a
per
|
was meshed with increasing element size from the surface to the interior. The up-per boundary conditions (UBC, Dirichlet) were derived from the typical mean annual ground surface temperature (MAGST) of the data described above: the flat surfaces on top of the blocks were set to −0.65◦C and all cleft surfaces to −1.5◦C. For the near-vertical side walls a functionTsurf=f(aspect) was obtained by fitting a sine curve 5
through the MAGST of the six steep measurement locations to interpolate values for the aspect of the rock faces with no measurements. A significant effect of a bottom heat flow is not expected for the Gunnel blocks and the lower boundary condition is set to thermal insulation. The subsurface temperature field was calculated based on three-dimensional conductive heat transport within the modelling package
COM-10
SOL Multiphysics (Software by Femlab AG). Subsurface properties were assumed to be isotropic and homogeneous for the entire cross section and set to typical values for sandstone: specific heat capacity 900 J kg−1K−1, density 2300 kg m−3and thermal conductivity 2.3 W K−1m−1 (Cermak and Rybach, 1982). Latent heat was considered based on an apparent heat capacity approach as described by Mottaghy and Rath
15
(2006), saturated conditions and a bulk porosity of 5 % (gritstone). Effects from past climate variations are assumed to be negligible for the small size of the Gunnel blocks (Noetzli and Gruber, 2009). To describe the development of an active layer, a transient model run was performed. For this, the surface temperature evolution during the course of the year is prescribed, based on the average of the monthly means of all loggers.
20
After a spin-up period of 4 years, the simulation was eventually performed for one year free time steps of maximum 7 days. For comparison, simulations were performed with and without clefts in the blocks as well as in- and excluding the effect of latent heat.
3.4 The thermal diode model for snow-cover effects
A reductionist model is applied to illustrate the reverse influence of two macro-climatic
25
TCD
8, 4779–4822, 2014Characteristics of mountain permafrost
in British Columbia
A. Hasler et al.
Title Page
Abstract Introduction
Conclusions References
Tables Figures
◭ ◮
◭ ◮
Back Close
Full Screen / Esc
Printer-friendly Version Interactive Discussion
Discussion
P
a
per
|
Discus
sion
P
a
per
|
Discussion
P
a
per
|
Discussion
P
a
per
|
cover acts similarly as such a thermal diode between atmosphere and ground surface. The term thermal diode is borrowed from the electrical semi-conductor element. The electro-technical scheme in Fig. 6 is a representation of this situation.
A numerical implementation in R (statistical programming language) of this simple scheme is used to simulate the relative effect of different snow cover insulation (Rs) 5
and annual amplitudes ofTair being inversely proportional to each other. For a given
Tair the ground surface temperature Tsurf is calculated by a division according to the (heat) resistances (voltage divider equation):
Tsurf=Tground+(Tair−Tground)
Rgr
Rgr+Rs
|Tair< Tground
Tsurf=Tground+(Tair−Tground)
Rgr
Rgr
=Tair|Tair≥Tground (4)
10
The model is initialized with the MAT forTsurf and Tground. For Eq. (1),Tground is taken
from the previous time step [i−1] (because dTground/dt≪dTair/dt) and the new ground
temperature is calculated as follows:
Tground[i]=Tground[i−1]+mean(Tsurf[i−1,i])−Tground[i−1]
Rgr·Cgr
(5)
15
Different versions of this thermal diode model are compared in a brief sensitivity anal-ysis. These models are small modifications of the scheme above to which we refer as exact model. For thenfactor model (nfactor after (Lunardini, 1978): Nfreez/Nthaw= 1/(1+Rs) which is the model above with Rgr=1) snow cover insulation is triggered 20
if Tair<0◦C (instead of Tair< Tground); temperature dependent snow cover insulation
(Rs=f(Tair)) and a time lag betweenTairand snow cover build-up is applied in the
vari-able insulation model; additionally latent heat effects where simulated withTsurf=0◦C
TCD
8, 4779–4822, 2014Characteristics of mountain permafrost
in British Columbia
A. Hasler et al.
Title Page
Abstract Introduction
Conclusions References
Tables Figures
◭ ◮
◭ ◮
Back Close
Full Screen / Esc
Printer-friendly Version Interactive Discussion
Discussion
P
a
per
|
Discus
sion
P
a
per
|
Discussion
P
a
per
|
Discussion
P
a
per
|
Some examples of this sensitivity analysis are given together with the discussion of the modelling results. The absolute values of the SOs vary between model types up to 50 % but the ratio between simulated SOs in a prototypic continental and maritime climate remains very similar for all model versions. Given the purpose of qualitative illustration, this simple model provides sufficiently robust results.
5
4 Results and discussion
4.1 Overview of the mean annual temperatures and offsets
Figure 7 gives an overview of all MAT profiles and the significance of the surface and thermal offsets. Trends in MAAT are in the order of 0.1–0.2◦C decade−1 (cf. Sect. 2). Hence, in the near surface temperatures that are considered in these profiles we do
10
not expect mid-term transient effects by air temperature changes unless the ground is isothermal at 0◦C with a high ground ice content. However, trends in snow cover evolution during the last two decades are difficult to estimate for the individual locations and may lead to an enhanced uncertainty for profiles with a strong dependency on snow cover (e.g. in convex topography). This lower correlation with air temperature is
15
reflected by the calculation of the offset uncertainty (Sect. 3.2) and leads to insignificant surface offsets (SOs) even if the absolute values of the offsets are large (dashed lines in Fig. 7; e.g. at locationsPIN_ccorTET_S1/S2).
All sites show MAATs below zero degrees Celsius exceptPoplars-S,which has a par-ticular warm micro-climate (Fig. 7). In contrast, half of the locations show positive mean
20
annual ground and ground surface temperatures (MAGT, MAGST). Hence, the SOs are generally positive and range from 0.5 to 7◦C. The TOs (thermal offsets or “tempera-ture offsets in the near-surface” where the ground temperature is measured above the permafrost table) are often not significant and range from−2 to+1◦C.
The SOs are important for permafrost distribution and dominate the effects of TOs
25
TCD
8, 4779–4822, 2014Characteristics of mountain permafrost
in British Columbia
A. Hasler et al.
Title Page
Abstract Introduction
Conclusions References
Tables Figures
◭ ◮
◭ ◮
Back Close
Full Screen / Esc
Printer-friendly Version Interactive Discussion
Discussion
P
a
per
|
Discus
sion
P
a
per
|
Discussion
P
a
per
|
Discussion
P
a
per
|
the results, and in particular the surface offsets, are presented and discussed regard-ing variations in surface characteristics, topography and macro-climate. However the variation in the parameters of interest (surface type, snow accumulation, slope, aspect, elevation, macro-climate etc.) is not systematic enough and the sample is too small (cf. Sect. 2.2) to quantify the offsets along all potential gradients. For example, specific air
5
temperature and surface temperature lapse rates, which are important for permafrost distribution patterns in northern BC (Lewkowicz and Bonnaventure, 2011), can not be extracted from our data: a brief comparison of high and low elevation sites that lie in proximity simply indicates that pronounced winter inversions lead to small or non-existent laps rates of MATs between valley bottoms and hilltops (near tree line) what
10
supports existing studies on this matter.
4.2 Surface and thermal offset by surface characteristics
First, we discuss the offsets of the mean annual temperatures regarding different sur-face characteristics. With sursur-face characteristics we denote classes of near-sursur-face ground properties (surface type), micro-topography and vegetation cover regarding
15
their thermal influence. A brief information on that for all measurement locations was given in Table 1 in the columns surface type and note. These characteristics can vary within short distance and are responsible for a pronounced small-scale variability of ground temperatures; however, their influence may vary between sites with different macro-climatic conditions. In this section we quantify the effect of different surface
20
characteristics on the surface and thermal offset (SO, TO) at our field sites. Even if the sample is too small and not systematic, as described above, we get a first estimate of the influence of surface characteristics on permafrost occurrence in British Columbia and compare them between sites.
Figure 8 shows the SO and TO of all locations ordered by surface characteristics
25
TCD
8, 4779–4822, 2014Characteristics of mountain permafrost
in British Columbia
A. Hasler et al.
Title Page
Abstract Introduction
Conclusions References
Tables Figures
◭ ◮
◭ ◮
Back Close
Full Screen / Esc
Printer-friendly Version Interactive Discussion
Discussion
P
a
per
|
Discus
sion
P
a
per
|
Discussion
P
a
per
|
Discussion
P
a
per
|
(mineral soils and colluvium) with minor vegetation such as alpine tundra (NON, PIN) or grassland (MID_wx). The class debris contains all surfaces with coarse debris covers that contain voids that allow air circulation. Finally, forest comprises different forest types such as black spruce, pine and alder forests. The substrate in these forests contains an organic soil layer with a moss cover where not otherwise marked (Fig. 8).
5
A further meta information additionally to the surface classes is the exposure to solar radiation and wind (Fig. 8; top). These factors are influenced by the (micro-)topography and affect the snow deposition (wind) and the radiation balance (mainly insolation) when snow free.
The average SO per class does not show a clear dependency on the surface type.
10
However, a comparison of the mean offsets may be misleading due to the bias by other influence factors (e.g. wind exposure). For average irradiation and wind condi-tions the SOs on flat bare rock (2.5–4◦C) appear to be slightly higher than for the other surface types, which are in the range of 1.5 to 3◦C Fig. 8). If not a bias of the snow cover influence, the difference compared to the SOs on soils (alpine tundra) may be
15
explained by the lower albedo of the rock. Interestingly, the SOs on coarse debris are not significantly smaller than for the other surface types. Within the first 30–50 cm of the block layer no significant offset (see TO) was observed. Obviously the ventilation (Haeberli, 1973; Harris and Pedersen, 1998) and reduced thermal conductivity (Gruber and Hoelzle, 2008) of the block layer have no large effect on the thermal regime of our
20
field sites.
Within the class near-vertical bedrock a variation in the SOs of 4◦C (SO: 1–5◦C) indicates the influence of aspect controlled irradiation on these snow free surfaces, which is discussed in more detail in the next section. Note that for this class no rock temperature at depth is measured, and that the near-surface temperature is used for
25
TCD
8, 4779–4822, 2014Characteristics of mountain permafrost
in British Columbia
A. Hasler et al.
Title Page
Abstract Introduction
Conclusions References
Tables Figures
◭ ◮
◭ ◮
Back Close
Full Screen / Esc
Printer-friendly Version Interactive Discussion
Discussion
P
a
per
|
Discus
sion
P
a
per
|
Discussion
P
a
per
|
Discussion
P
a
per
|
forests with a dense canopy (spruce, pine), where the SOs are approximately 2◦C, there is no difference between north and south slopes. However, the forest type, and correspondingly the canopy density, may be influenced by the aspect. This leads to significantly larger SOs where light forest and broadleaf trees allow higher incident solar radiation (e.g. POP_S in Fig. 8).
5
Wind exposed locations with only a thin snow cover lead to a smaller SO than at sheltered locations at all field sites. Whereas the SO at the three wind exposed loca-tions in the rock mountains is 1◦C or less, the wind-swiped location at Huson Bay Mt. (HUD) has an SO of 2.7◦C (Fig. 8). This larger offset is possibly a result of more snow accumulation at wind exposed locations of HUD due to more frequent wet snowfall in
10
the Coast Mountains: observed snow heights during site visits and measured surface temperature during winter indicate a more insulating snow cover at HUD_fl than at other locations, whereas wind gust measured at the meteo stations (wx) are similar at HUD and GUN and only slightly higher at NON and PIN. The local wind condition are not considered and can not be assessed with our data, hence a cross-checking of the
15
above hypothesis is not possible at this point in time.
Regarding the influence of vegetation and organic layer on SO and TO, the field sites MID and POP are offspecial interest. At Middlefork the locations in open grass-land (MID_wx), a palsa in a light stand of black spruce (MID_pf), and a pine forest with closed canopy on a gentle slope (MID_fr) indicate a decrease in SO with increasingly
20
dense vegetation (Fig. 8). Hence the colder air temperature at the locations with lesser vegetation due to cold air drainage is overcompensated by these larger SOs (cf. Fig. 7). At the location with permafrost occurrence MID_pf, a clearly negative TO (–1.3◦C) is responsible for the permafrost occurrence (Fig. 8). If this TO is caused by a thermal diode effect of the moss layer or by a transient effect of the latent heat required to melt
25
dif-TCD
8, 4779–4822, 2014Characteristics of mountain permafrost
in British Columbia
A. Hasler et al.
Title Page
Abstract Introduction
Conclusions References
Tables Figures
◭ ◮
◭ ◮
Back Close
Full Screen / Esc
Printer-friendly Version Interactive Discussion
Discussion
P
a
per
|
Discus
sion
P
a
per
|
Discussion
P
a
per
|
Discussion
P
a
per
|
ferent depth of probe?). At the POP field site a clearly larger SO in contrast to the other locations is observed at POP_S (Fig. 8). This large SO is caused by warmer ground temperatures in summer. Hence, the higher transmissivity of the alder forest allows more irradiative warming of the ground compared to the spruce forest on the other lo-cations. The three locations with a thick moss layer (POP_N1–3) show significant TOs
5
between –0.8 and –1.7◦C. Similar to MID_pf the ground temperatures of these loca-tions are at 0◦C throughout the year. Hence it is not clear here as well if these TOs reflect an equilibrium thermal diode effect or if they indicate degrading permafrost with high ice content.
4.3 Aspect control of rock temperatures on the example of near-vertical cliffs
10
Near-vertical rock temperatures are a good parameter to investigate the aspect control of ground temperatures and to validate downscaling and radiation algorithms in physi-cally based permafrost models because no complex surface characteristics and snow cover complicate the situation. Gruber (2012) points out the importance of an extension of existing measurements to other environmental conditions for a better understanding
15
of the drivers of these temperatures. In the first part of this section we describe the surface offsets in steep bedrock at the three high elevation sites GUN, PIN, and HUD and discuss them in comparison to near-vertical rock temperatures in other regions. Af-ter that we elaborate the thermal regime at Mt. Gunnel (GUN) with a numerical model simulation. An understanding of this specific situation is of particular interest because
20
diverse rock slides emerged from similar topographic and geological situations in the northern BC (Geertsema et al., 2006).
The mean annual rock temperatures from the near-surface (MARST or MAGST) at Mt. Gunnel illustrate the aspect control of ground temperatures by solar irradiation. At the shaded north side (GUN_N) MAGST is just 0.9◦C higher than MAAT whereas
25
TCD
8, 4779–4822, 2014Characteristics of mountain permafrost
in British Columbia
A. Hasler et al.
Title Page
Abstract Introduction
Conclusions References
Tables Figures
◭ ◮
◭ ◮
Back Close
Full Screen / Esc
Printer-friendly Version Interactive Discussion
Discussion
P
a
per
|
Discus
sion
P
a
per
|
Discussion
P
a
per
|
Discussion
P
a
per
|
Hudson Bay Mt. (HUD_S2 vs. HUD_N) is 3.8◦C. If not caused by differences in albedo or sky view factor, the slightly smaller N–S difference at HUD may be related to the higher cloudiness at Hudson Bay Mt. common in the more humid Coast Mountains. However, the difference is too small (not significant; cf. uncertainty in Fig. 8) to draw any conclusions on this macro-climatic effect. The effects was neither detectible in
5
other empirical studies (Gruber, 2012). For Pink Mountain we cannot calculate the north–south difference because the corresponding aspects are not monitored. The SO values from PIN-SE and PIN-W correspond with similar aspects at GUN.
Compared with near-vertical rock temperatures in other mountain ranges, this influ-ence of aspect, falls between the values of mid-latitude (Swiss and New Zealand Alps)
10
and slightly higher latitude (Norway). In the Swiss Alps N–S differences from 6 to 8◦C are reported (Gruber et al., 2004; PERMOS, 2010; Hasler et al., 2011), in New Zealand this difference is about 6◦C (Allen et al., 2009), whereas in middle Norway differences of 3 to 3.5◦C where observed (Hipp et al., 2014). Strong (directional) reflection in the glacial environments of the Alps amplifies the short-wave incoming radiation on
south-15
ern rock faces (Allen et al., 2009; Hasler et al., 2011) and makes the high values not directly comparable to the situation in this study. A stronger decay of the expositional difference of PISR occurs north of about 60◦N (Gruber, 2012) where expositional dif-ferences in the range of 0.5 to 1.5◦C are reported at 80◦N (Lewkowicz, 2001).
Within compact bedrock thermal offset effects are small and rock surface
tempera-20
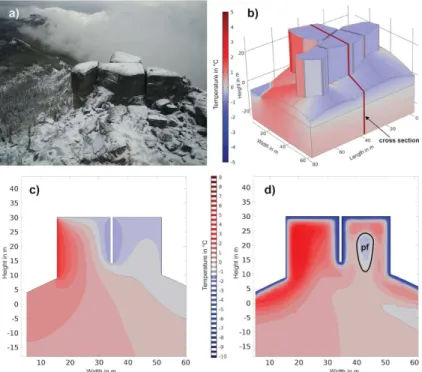
tures are a reasonable assumption to extrapolate (permafrost) temperature at depth. However, micro-topographic factors such as surface geometry and fractures in the rock influence the subsurface temperature field (Hasler et al., 2011). Figure 9 shows the sit-uation at the GUN field site and the results of the heat conduction model (cf. Sect. 3.3) for this complex topography. It illustrates the cooling effect of fractured blocks due to
25
TCD
8, 4779–4822, 2014Characteristics of mountain permafrost
in British Columbia
A. Hasler et al.
Title Page
Abstract Introduction
Conclusions References
Tables Figures
◭ ◮
◭ ◮
Back Close
Full Screen / Esc
Printer-friendly Version Interactive Discussion
Discussion
P
a
per
|
Discus
sion
P
a
per
|
Discussion
P
a
per
|
Discussion
P
a
per
|
(Fig. 9c) indicates positive rock temperatures for the southern block and slightly nega-tive temperatures for the northern block with possible permafrost occurrence. The small extent of the considered geometry requires, however, the consideration of the active layer thickness (ALT) to estimate permafrost occurrence in this very case. Figure 9d shows such an estimate applying the measured annual temperature amplitudes and
5
a water saturated porosity of 5 % in a transient model run (cf. Sect. 3.3). With the given geometry these latent heat effects are critical for the permafrost occurrence reducing the ALT. The grey and light-blue areas in Fig. 9d indicate a very small permafrost body within the considered blocks.
More generally we can summarize, that the thermal conditions at GUN are very close
10
to the limit for permafrost to occur. The micro-topography is essential for permafrost estimates at Mt. Gunnel. Warm permafrost is only expected in the following settings: below steep north faces, in fractured rock, under blocky layers and under wind-swept surfaces. Compact rock in E–S–W aspects and surfaces with snow accumulation (cen-ter of plateaus, forest) are unlikely to contain permafrost. Hence, the rock fall that
oc-15
curred at Mt. Gunnel and the near-by Vanessa slide (Geertsema and Cruden, 2009) are possibly related to such local permafrost occurrence.
4.4 The influence of continentality on snow cover-induced surface offsets
Total annual precipitation, annual air temperature amplitude (ATA) and average cloud-cover are highly correlated on the large scale and distinguish humid maritime and dry
20
continental climates (cf. Sect. 2). Continentality can be defined as ATA for a given latitude, or as the difference in monthly means of air temperature from the coldest and warmest month divided by two ((Tjuly−Tjan)/2) (in some studies just the diff
er-ence Tjuly−Tjan is used). These macro-climatic differences are thought to modify the
effectiveness of the physical processes responsible for the surface offsets and cause,
25
er-TCD
8, 4779–4822, 2014Characteristics of mountain permafrost
in British Columbia
A. Hasler et al.
Title Page
Abstract Introduction
Conclusions References
Tables Figures
◭ ◮
◭ ◮
Back Close
Full Screen / Esc
Printer-friendly Version Interactive Discussion
Discussion
P
a
per
|
Discus
sion
P
a
per
|
Discussion
P
a
per
|
Discussion
P
a
per
|
ent dependencies of the lower limit of mountain permafrost on continentality found for different latitudes in China. However, these early studies did not clearly distinguish be-tween effects of MAAT, precipitation, and continentality because spatial information on these variables was sparse. With recent advances regarding such spatial data sets (in-terpolations and reanalysis of meteorological data) the dependency of surface offsets
5
from continentality and precipitation are major macro-climatic unknowns for empirical permafrost maps. A recent empirical study on the Alpine-wide permafrost distribution found no significant dependency of rock glacier lower limit on precipitation (Boeckli et al., 2012). Even though the precipitation (and continentality) gradients in the Alps are comparably small, this result contradicts the hypothesis that the lower limit of mountain
10
permafrost (or ground temperature) depends on macro-climatic variables other than MAAT and radiation.
Because our measurements span large gradients in continentality (cf. Sect. 2.1), they provide an opportunity to directly evaluate the effect of continentality on SO with field measurements of similar characteristics and to estimate its role for the permafrost
15
distribution in British Columbia. In Sect. 4.3 we already stated that we could not demon-strate a significant effect of macro-climatic cloudiness in the irradiation-induced as-pect control of SOs in near-vertical bedrock. While this topographic situation is quite marginal in terms of spatial representativeness, terrain with significant snow accumu-lation is widespread and requires consideration.
20
With increasing continentality less (winter) precipitation and, on average, a thinner snow cover is expected. Even though snow can have diverse cooling and warming ef-fects, one of its main impacts and the dominant warming effect is the thermal insulation of the ground from winter air temperature (Zhang, 2005). This affects the nival offset, that part of the SO which is caused by insulation of the snow cover (Smith and
Rise-25
TCD
8, 4779–4822, 2014Characteristics of mountain permafrost
in British Columbia
A. Hasler et al.
Title Page
Abstract Introduction
Conclusions References
Tables Figures
◭ ◮
◭ ◮
Back Close
Full Screen / Esc
Printer-friendly Version Interactive Discussion
Discussion
P
a
per
|
Discus
sion
P
a
per
|
Discussion
P
a
per
|
Discussion
P
a
per
|
one process clearly dominate? These questions have rarely been addressed in the literature so far.
The data shows no clear difference between Coast Range and continental side of the Rocky Mountains in terms of SOs. Generally, the measured ATA and the precipi-tation sum (Wang et al., 2012) correlate negatively with each other, however, the high
5
elevation site in the inner Rocky Mountains (NON) shows a comparably low precipita-tion sum but rather small ATA as well (Fig. 10). Because the mean surface offsets per site shown in Fig. 10 are biased by the surface characteristics (compare Sect. 4.2) the missing dependency on this aggregation level is not surprising. Even locations from the same surface class do not show a consistent dependency on either ATA, nor on the
10
total annual precipitation (Fig. 10). Despite the limitations of such a general compari-son between sites, the largest SOs being observed at the driest location is surprising and motivates closer scrutiny.
The thermal diode model (Sect. 3.4) simulates the seasonal heat transfer between atmosphere and ground by simple snow insulation and related surface or nival offsets.
15
In a brief sensitivity analysis with a pairwise parameter (ATA and snow insulation) diff er-ent models were compared, referred to as the exact model, thenfactor model and the variable insulation model (cf. Sect. 3.4). Each model was run with two parameter sets (A=10◦C and Rs=20;A=20◦C and Rs=10). In Fig. 11 the results of four of these
model runs over 8 years (2900 days) are presented. All simulations show consistently
20
that the SO is larger with doubled amplitude and half of the snow insulation value (cf. Fig. 11b and c). This is simply explained in the example of thenfactor model. The in-tegral of the negative temperatures (freezing index If: gray area in Fig. 11) is larger for the larger ATA under the same MAAT. Hence, the amplitude effect over-compensates the snow insulation effect for given settings. This will vary slightly for different surface
25
types and ground thermal characteristics (change inRgr), and the thermal properties of
TCD
8, 4779–4822, 2014Characteristics of mountain permafrost
in British Columbia
A. Hasler et al.
Title Page
Abstract Introduction
Conclusions References
Tables Figures
◭ ◮
◭ ◮
Back Close
Full Screen / Esc
Printer-friendly Version Interactive Discussion
Discussion
P
a
per
|
Discus
sion
P
a
per
|
Discussion
P
a
per
|
Discussion
P
a
per
|
built-up takes place. This is consistent with the finding of Goodrich (1982), that ATA has a on the snow cover effect. This influence is implicitly considered in distributed
nfactor models such as e.g. TTOP (Smith and Riseborough, 2002), which are mainly applied for low-land permafrost. For mountain permafrost, where empirical models ap-ply topographical parameterizations of the SO, the influence of the ATA has not been
5
investigated so far.
The nival offset considers only the insulation effect during freezing days – a clear limitation for cold humid climates where snow cover persists for a significant part of the early summer (Zhang, 2005). To further investigate the nival offset and other ef-fects of the snow cover on the surface offset two locations were compared from the
10
dataset. While these sites have the largest difference in terms of macro-climate, both accumulate snow without much influence of wind. The site HUD_fl is a near-horizontal rock surface on the south slope of Hudson Bay Mtn. with a thick winter snow cover. In contrast, MID_wx is located on a grassy gentle sloping till (fine-grained soil) next to a river, with no particular shading or wind influence as well, but in a much drier and
15
more continental climate (cf. Table 1). The MAAT at both locations is around−3◦C and the influence of differences in moisture content (soil vs. bedrock) is apparently not af-fecting the surface temperature measurements (no significant zero curtain at the soil site). These two locations are compared in Fig. 12. The ground surface and air temper-ature (Fig. 12 top) are subtracted to show the seasonal contribution to the SO (Fig. 12
20
middle). This shows clearly that the nival offset (orange area during winter) is larger in the case of MID_wx even though the ground surface is colder at this location during winter. The seasonal and biweekly freezingN factors (Fig. 12 bottomNfr) are smaller
at MID_wx, indicating a less insulating snow cover. Hence, in this example, the effect of the ATA overwhelms the effect of the snow cover thickness on the nival offset
simi-25
lar to the model study above. However, a striking difference between the temperature regimes at the two locations is the difference in thawingNfactor (Fig. 12 bottomNth). At
MID_wx, where the entire summer is snow free,Nthis close to one, whereas at HUD_fl
TCD
8, 4779–4822, 2014Characteristics of mountain permafrost
in British Columbia
A. Hasler et al.
Title Page
Abstract Introduction
Conclusions References
Tables Figures
◭ ◮
◭ ◮
Back Close
Full Screen / Esc
Printer-friendly Version Interactive Discussion
Discussion
P
a
per
|
Discus
sion
P
a
per
|
Discussion
P
a
per
|
Discussion
P
a
per
|
and latent heat effects. The resulting negative summer offset at HUD (Fig. 12 mid-dle; blue area) further reduces the SO. In this comparison the maritime humid climate leads to an SO of 3.9◦C due to a smaller temperature amplitude and a long-lasting snow cover while the drier continental climate results in a SO of 6.1◦C.
These numbers may not easily be generalized because local wind conditions will
5
strongly modify the persistence of the snow cover at other locations, but the influence of the ATA will remain important everywhere that an insulating snow cover (>0.4 m) builds up. This is supported by a study from Throop et al. (2012) that analyses measurements from throughout northern Canada, showing similar SOs at sites near the Coast Range (Wolf Creek Sites, Yukon) and west of the Hudson Bay (Baker Lake Site, Nunavut)
10
with strong differences in annual temperature amplitude and precipitation: even though theNfr differ strongly between these sites (0.4 vs. 0.7), all SOs are around 3.2◦C (cf.
Throop et al., 2012 Tables 1 and 2). For all considered sites in this study, the SO shows a minor dependency on MAAT but theNfr is systematically larger with more negative
MAAT (Throop et al., 2012). This is explained not only by the delayed freeze back of
15
the thick active layer in warm ice-rich permafrost (Smith and Riseborough, 2002), but also by generally larger ground freezing indexes in cold permafrost due to the lower ground temperatures (relevant if ice content is low).
The outcome of this analysis is the hypothesis, that the macro-climatic effect on snow-cover induced SOs is much smaller than expected from local studies, where only
20
the snow-cover thickness varies but similar air temperature amplitudes force the heat fluxes. In humid to semi-dry conditions where a significant snow cover builds-up takes place, the corresponding differences in the ATA strongly compensate for the effects of snow cover insulation (Fig. 13). This is an important outcome for the application of empirical mountain permafrost models, which apply topographical parameterizations of
25
TCD
8, 4779–4822, 2014Characteristics of mountain permafrost
in British Columbia
A. Hasler et al.
Title Page
Abstract Introduction
Conclusions References
Tables Figures
◭ ◮
◭ ◮
Back Close
Full Screen / Esc
Printer-friendly Version Interactive Discussion
Discussion
P
a
per
|
Discus
sion
P
a
per
|
Discussion
P
a
per
|
Discussion
P
a
per
|
5 Conclusion
This study comprises the pre-processing and analysis of an extensive but heteroge-neous data set of ground temperatures that is novel for the province of British Columbia. Regarding the treatment of similar data a methodical outcome is:
Data processing 5
– The used calculation of mean annual temperatures and its uncertainty analysis al-lows a comparison of inconsistent data for a “quasi-static” surface offset-/thermal offset-analysis.
The main focus of the paper is the quantification and description of the surface off -set and thermal offsets regarding the three influencing factors surface characteristics,
10
topography and macro-climate. The respective key findings are listed separately as follows:
Surface characteristics
– The average of the surface offsets per class of surface type (rock, fine soil, coarse debris, forest) is 2 to 2.5◦C with no clear difference between classes.
15
– Wind-swept surfaces have a smaller surface offset (below 1◦C). In one case the offset is larger, possibly due to more frequent wet snowfall.
– Thermal offsets are negligible, except at north facing forest sites with a thick or-ganic layer (moss) where they are−1 to−2◦C. It is not clear if these thermal off -sets represent equilibrium conditions because the temperature at the permafrost
20
table is constantly at 0◦C and transient effects may be important under such con-ditions. This study only included one wetland (with peat) due to its focus in moun-tain permafrost.
– Surprisingly the surface offset on coarse blocky material is not smaller and no thermal offsets are detected in the upper most layers (0.3–0.5 m).
TCD
8, 4779–4822, 2014Characteristics of mountain permafrost
in British Columbia
A. Hasler et al.
Title Page
Abstract Introduction
Conclusions References
Tables Figures
◭ ◮
◭ ◮
Back Close
Full Screen / Esc
Printer-friendly Version Interactive Discussion
Discussion
P
a
per
|
Discus
sion
P
a
per
|
Discussion
P
a
per
|
Discussion
P
a
per
|
Aspect control of insolation and other topographic effects
– The north–south difference of the surface offset in near-vertical bedrock is 4◦C. No east–west difference was detected.
– On gentle slopes (angle<30◦) on alpine tundra or debris the observed north– south difference is between 1.5 and 3◦C. In forests with a dense canopy this
5
difference is negligible.
– A detailed modelling study for the Mt. Gunnel site shows that the cuesta (gently sloping table-top mountain) is very close to the limit of permafrost. The cooling effect of clefts in the bedrock is important for permafrost occurrence at this site.
Macro-climate 10
– The aspect control of the surface offset in steep bedrock does not show significant differences between different macro-climatic regions.
– The effect of snow cover insulation (nival offset) in the humid Coast Mountains and the semi-dry occidental side of the Rocky Mountains is similar. This is due to the reverse effect of the continentality (annual air temperature amplitude) which
15
compensates for the decreased insulation (smaller freezing N factor) with lower winter temperatures (larger freezing index) in the continental climate.
– At snow-rich sites the long-lasting snow cover further reduces the surface offset by albedo and latent heat effects during early summer.
Regarding future estimates of permafrost distribution in British Columbia, local
vari-20
ability of the surface offset caused by topographic gradients is most important. This variability differs with vegetation and organic soil layers (which also controls the ther-mal offset) but is influenced only to minor extent by the macro-climatic variations.
The Supplement related to this article is available online at doi:10.5194/tcd-8-4779-2014-supplement.
TCD
8, 4779–4822, 2014Characteristics of mountain permafrost
in British Columbia
A. Hasler et al.
Title Page
Abstract Introduction
Conclusions References
Tables Figures
◭ ◮
◭ ◮
Back Close
Full Screen / Esc
Printer-friendly Version Interactive Discussion
Discussion
P
a
per
|
Discus
sion
P
a
per
|
Discussion
P
a
per
|
Discussion
P
a
per
|
References
Allen, S. K., Gruber, S., and Owens, I. F.: Exploring steep bedrock permafrost and its relation-ship with recent slope failures in the Southern Alps of New Zealand, Permafrost Periglac., 20, 345–356, 2009.
Boeckli, L., Brenning, A., Gruber, S., and Noetzli, J.: A statistical approach to modelling per-5
mafrost distribution in the European Alps or similar mountain ranges, The Cryosphere, 6, 125–140, doi:10.5194/tc-6-125-2012, 2012.
Bonnaventure, P. P., Lewkowicz, A. G., Kremer, M., and Sawada, M. C.: A permafrost probability model for the southern Yukon and northern British Columbia, Canada, Permafrost Periglac., 23, 52–68, 2012.
10
Cermak, V. and Rybach, L.: Thermal conductivity and specific heat of minerals and rocks, Landolt-Bornstein, Zahlenwerte and Funktionen aus Naturwissenschaften and Technik, 305– 343, 1982.
Egginton, V. N.: Historical climate variability from the instrumental record in northern British Columbia and its influence on slope stability, Department of Earth Sciences – Simon Fraser 15
University, 2005.
Fiddes, J. and Gruber, S.: TopoSCALE v.1.0: downscaling gridded climate data in complex terrain, Geosci. Model Dev., 7, 387–405, doi:10.5194/gmd-7-387-2014, 2014.
Geertsema, M. and Cruden, D. M.: Rock movements in northeastern British Columbia, in: Land-slide Processes: From Geomorphologic Mapping to Dynamic Modelling, Proceedings of the 20
Landslide Processes Conference: a tribute to Theo van Asch, edited by: Malet, J. P., Re-maitre, A., Bogaard, T., Strasbourg, 6–7 February, CERG, Strasbourg, France, 31–36, 2009. Geertsema, M., Clague, J. J., Schwab, J. W., and Evans, S. G.: An overview of recent large
catastrophic landslides in northern British Columbia, Canada, Eng. Geol., 83, 120–143, 2006.
25
Goodrich, L. E.: The influence of snow cover on the ground thermal regime, Can. Geotech. J., 19, 421–432, 1982.
Gruber, S.: A Global view on permafrost in steep bedrock, in: Proceedings of the 10th Interna-tional Conference on Permafrost, Salekhard, Russia, 25–29 June 2012, 131–136, 2012 Gruber, S. and Hoelzle, M.: The cooling effect of coarse blocks revisited: a Modeling Study of 30