HESSD
10, 11451–11484, 2013Antecedent flow conditions in the Mississippi River
Basin
J. C. Murphy et al.
Title Page
Abstract Introduction
Conclusions References
Tables Figures
◭ ◮
◭ ◮
Back Close
Full Screen / Esc
Printer-friendly Version Interactive Discussion
Discussion
P
a
per
|
Dis
cussion
P
a
per
|
Discussion
P
a
per
|
Discussio
n
P
a
per
|
Hydrol. Earth Syst. Sci. Discuss., 10, 11451–11484, 2013 www.hydrol-earth-syst-sci-discuss.net/10/11451/2013/ doi:10.5194/hessd-10-11451-2013
© Author(s) 2013. CC Attribution 3.0 License.
Geoscientific Geoscientific
Geoscientific Geoscientific
Hydrology and Earth System
Sciences
Open Access
Discussions
This discussion paper is/has been under review for the journal Hydrology and Earth System Sciences (HESS). Please refer to the corresponding final paper in HESS if available.
Antecedent flow conditions and nitrate
concentrations in the Mississippi River
Basin
J. C. Murphy1, R. M. Hirsch2, and L. A. Sprague3
1
Tennessee Water Science Center, US Geological Survey, Nashville, USA
2
National Research Program, US Geological Survey, Reston, USA
3
Idaho Water Science Center, US Geological Survey, Boise, USA
Received: 30 August 2013 – Accepted: 3 September 2013 – Published: 10 September 2013 Correspondence to: J. C. Murphy ([email protected])
HESSD
10, 11451–11484, 2013Antecedent flow conditions in the Mississippi River
Basin
J. C. Murphy et al.
Title Page
Abstract Introduction
Conclusions References
Tables Figures
◭ ◮
◭ ◮
Back Close
Full Screen / Esc
Printer-friendly Version Interactive Discussion
Discussion
P
a
per
|
Dis
cussion
P
a
per
|
Discussion
P
a
per
|
Discussio
n
P
a
per
Abstract
The influence of antecedent flow conditions on nitrate concentrations was explored at eight sites in the Mississippi River Basin, USA. Antecedent moisture conditions have been shown to influence nutrient export from small, relatively homogenous basins, but this influence has not been observed at a regional or continental scale. Antecedent
5
flow conditions were quantified as the ratio between the mean daily flow of the previ-ous year and the mean daily flow from the period of record (Qratio), and theQratio was statistically related to nitrate anomalies (the unexplained variability in nitrate concen-tration after filtering out season, long-term trend, and contemporaneous flow effects) at each site. Nitrate anomaly andQratio were negatively related at three of the four major
10
tributary sites and upstream in the Mississippi River, indicating that when the previous year was drier than average, at these sites, nitrate concentrations were higher than expected. The strength of these relationships increased when data were subdivided by contemporaneous flow conditions. Five of the eight sites had significant negative relationships (p≤0.05) at high or moderately high contemporaneous flows, suggesting
15
nitrate that accumulates in these basins during a drought is flushed during subsequent storm events. At half of the sites, when flow during the previous year was 50 % drier than average, nitrate concentration can be from 9 and 27 % higher than nitrate concen-trations that follow a year with average daily flow. Conversely, nitrate concentration can be from 8 and 21 % lower than expected when the previous year was 50 % wetter than
20
HESSD
10, 11451–11484, 2013Antecedent flow conditions in the Mississippi River
Basin
J. C. Murphy et al.
Title Page
Abstract Introduction
Conclusions References
Tables Figures
◭ ◮
◭ ◮
Back Close
Full Screen / Esc
Printer-friendly Version Interactive Discussion
Discussion
P
a
per
|
Dis
cussion
P
a
per
|
Discussion
P
a
per
|
Discussio
n
P
a
per
|
1 Introduction
Many studies show that antecedent moisture conditions influence nutrient export from river basins (Burt and Worrall, 2009; Garrett, 2012; Macrae et al., 2010; Randall et al., 2003; Soulsby et al., 2003; Vecchia et al., 2008). Commonly, studies document increased nutrient export following a prolonged dry period (Foster and Walling, 1978;
5
Macrae et al., 2010), though some studies have observed the opposite effect when considering only more recent antecedent conditions (Creed and Band, 1998; Macrae et al., 2010; Welsch et al., 2001). Most observations concerning the influence of an-tecedent moisture on nutrient export have been made in small basins with generally homogenous land use, land cover, climate, and geology (e.g., Biron et al., 1999; Burt
10
and Worrall, 2009; Cooper et al., 2007; Foster and Walling, 1978; Lange and Haensler, 2012; Macrae et al., 2010; Welsch et al., 2001), and little attention has been given to how this influence plays out on a large scale. Yet, the degree to which antecedent flows affect nutrient export from large basins may have profound implications for envi-ronmental management and policy, particularly for large basins in agricultural regions
15
that contribute substantial masses of nutrients to coastal waters. Nutrient fluxes from the Mississippi River Basin (MRB) are closely related to the spatial extent of the hypoxic zone in the Gulf of Mexico (Donner and Scavia, 2007; Rabalais and Turner, 2001); con-sequently, the hypoxic zone is often smaller during a drought when low flows from the Mississippi River deliver smaller nutrient loads to the Gulf (Scavia et al., 2003; Turner et
20
al., 2006). However, nitrate and other nutrients may accumulate within the basin during a drought and be subject to flushing by high flows when a drought ends, resulting in higher than normal nitrate concentrations in receiving waters.
The accumulation of nitrate in farm fields is a function of many influences, includ-ing weather conditions, soil characteristics, crop type, crop yield, fertilizer application,
25
HESSD
10, 11451–11484, 2013Antecedent flow conditions in the Mississippi River
Basin
J. C. Murphy et al.
Title Page
Abstract Introduction
Conclusions References
Tables Figures
◭ ◮
◭ ◮
Back Close
Full Screen / Esc
Printer-friendly Version Interactive Discussion
Discussion
P
a
per
|
Dis
cussion
P
a
per
|
Discussion
P
a
per
|
Discussio
n
P
a
per
low crop yield the previous growing season have elevated soil nitrate concentrations, whereas farms that had average or above average yields have low soil nitrate concen-trations (Sawyer, 2013). During a drought, irrigation is often a determining influence for crop yield and thus the amount of nitrate likely to accumulate in the soil (Sawyer, 2013). Most farmland in the MRB is not irrigated (Table 1) and elevated soil nitrate
concen-5
trations are typically anticipated across much of the basin following a drought (Dinnes et al., 2002; Ferguson et al., 2013; Randall et al., 2003; Rehm et al., 2009; Sawyer, 2013).
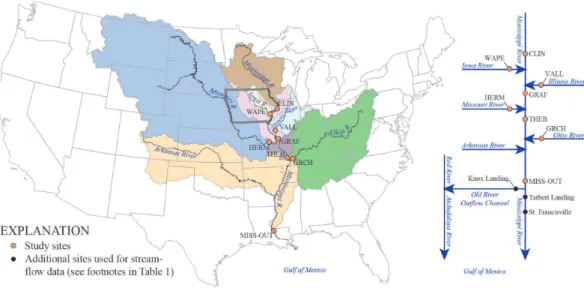
In this paper, we explore the influence of antecedent flow conditions on nitrate anomalies in the MRB and identify the contemporaneous flow conditions in which
an-10
tecedent flows are most influential. Nitrate anomalies are the unexplained variability in nitrate concentration after filtering out season, long-term trend, and contemporaneous flow effects. Our objective is to quantify these relationships for eight sites in the MRB (Fig. 1) using data collected over three decades and across a range of contemporane-ous flow conditions.
15
2 Data compilation
Eight sites in the MRB are used in this study, four Mississippi River main-channel sites and four sites in major tributary basins: the Iowa River, Illinois River, Missouri River and Ohio River (Table 1, Fig. 1). These sites are a part of a network of long-term data-collection sites throughout the United States that are maintained by the US
Geo-20
logical Survey (USGS) through the National Water-Quality Assessment (NAWQA) and National Stream-Quality Accounting Network (NASQAN) Programs. Streamflow and dissolved nitrate plus nitrite concentrations (referred to as nitrate hereafter) were com-piled and prepared for each site according to the techniques outlined in Aulenbach et al. (2007). Daily mean streamflow data used in this study are from 1979 through
25
HESSD
10, 11451–11484, 2013Antecedent flow conditions in the Mississippi River
Basin
J. C. Murphy et al.
Title Page
Abstract Introduction
Conclusions References
Tables Figures
◭ ◮
◭ ◮
Back Close
Full Screen / Esc
Printer-friendly Version Interactive Discussion
Discussion
P
a
per
|
Dis
cussion
P
a
per
|
Discussion
P
a
per
|
Discussio
n
P
a
per
|
semi-monthly to monthly frequency (e.g., 9–18 samples per year). Nitrate data were collected across a range of streamflow conditions including base and peak flows.
3 Methods
In the main channel of the Mississippi River and in several of its major tributaries, nitrate concentrations have been related to season, long-term trend over time, and
contempo-5
raneous daily mean flow (Sprague et al., 2011). The remaining unexplained variability in nitrate concentration may be related in part to antecedent flow conditions. In this study, a statistical model is used to quantify the unexplained variability in nitrate con-centration after filtering out these effects. This unexplained variability is the deviation of the observed log nitrate concentration from the log nitrate concentration predicted by
10
a statistical model (based on contemporaneous daily mean flow, season, and trend), herein referred to as nitrate anomalies (Vecchia et al., 2008). If antecedent flows in-fluence nitrate concentration, a statistically significant relationship (p≤0.05) between antecedent flows, expressed in terms of a hydrologic statistic, and nitrate anomalies should be observed.
15
In this study, we define antecedent flow as a ratio between mean daily flow of the previous year and mean daily flow of the period of record, for a given site (Qratio). The
Qratio (Qri) for dayi is calculated as
Qri = Qyri
QPOR (1)
where Qyri is the mean daily flow for the previous year (day i through the previous
20
HESSD
10, 11451–11484, 2013Antecedent flow conditions in the Mississippi River
Basin
J. C. Murphy et al.
Title Page
Abstract Introduction
Conclusions References
Tables Figures
◭ ◮
◭ ◮
Back Close
Full Screen / Esc
Printer-friendly Version Interactive Discussion
Discussion
P
a
per
|
Dis
cussion
P
a
per
|
Discussion
P
a
per
|
Discussio
n
P
a
per
and only requires streamflow data. UsingQ ratio to describe antecedent flows char-acterizes hydrologic conditions broadly and allows for an initial examination of how nitrate concentration responds following a drought. If significant relationships are doc-umented, future studies can help better define the specific hydrologic processes that influence nitrate concentration during and after a drought.Qratio values greater than 1
5
indicate higher than average mean daily flows for the previous year; values less than 1 indicate lower than average flows. AQ ratio value of 1 or near 1 (Qravg=1) indicates
the previous year had average mean daily flows. Figure 2 illustrates this concept in the Illinois River (VALL) by showing 3 days that had markedly different antecedent flow conditions. The mean daily flow for the 364 days prior to and including 28 March 2006,
10
was 293 m3s−1 (cubic meters per second), approximately 60 % lower than the mean daily flow for the period of record at this site (approximately 740 m3s−1), resulting in a
Qratio of 0.39 (Fig. 2a). On 16 February 2010, the mean daily flow of the previous year was 1314 m3s−1, approximately 75 % greater than the mean daily flow for the period of record, resulting in a Qratio of 1.77 (Fig. 2b). Finally, on 5 March 1987, the mean
15
daily flow of the previous year was 709 m3s−1, approximately the same as the mean daily flow for the period of record, resulting in aQratio near 1 (0.95) (Fig. 2c).Qratios for the eight sites used in our study range from 0.16 to 2.90 and the majority are within ±0.25 of 1 (Fig. 3).
We used the Weighted Regressions on Time, Discharge, and Season model
20
(WRTDS) (Hirsch et al., 2010) to determine nitrate anomalies. WRTDS uses time, con-temporaneous flow, and seasonal variables to estimate solute concentrations for large river basins that have several decades of flow and concentration data. Locally weighted regression is used to fit separate models for each day, resulting in unbiased estimates of concentration (Hirsch et al., 2010). WRTDS was used to estimate nitrate
concentra-25
HESSD
10, 11451–11484, 2013Antecedent flow conditions in the Mississippi River
Basin
J. C. Murphy et al.
Title Page
Abstract Introduction
Conclusions References
Tables Figures
◭ ◮
◭ ◮
Back Close
Full Screen / Esc
Printer-friendly Version Interactive Discussion
Discussion
P
a
per
|
Dis
cussion
P
a
per
|
Discussion
P
a
per
|
Discussio
n
P
a
per
|
pci =β0+β1t+β2ln (Q)+β3sin (2π t)+β4cos (2π t) (2)
where ln is the natural log,β0,β1, . . . ,β4, are fitted coefficients,tis time, andQis daily mean streamflow (Hirsch et al., 2010). Nitrate anomaly (CAi) for dayi is defined as
CAi =ln (ci)−pci (3)
whereci is the observed nitrate concentration on dayi, and pci is the predicted log
5
nitrate concentration on dayi. By using WRTDS, nitrate anomalies can be conceptu-alized as the portion of the concentration signal that is not accounted for by contem-poraneous discharge, season or long-term trend. Thus, a positive nitrate anomaly in-dicates higher-than-anticipated observed concentration; a negative anomaly inin-dicates a lower-than-anticipated concentration. For details on WRTDS and the modeling of
10
nitrate concentration at these sites, see Hirsch et al. (2010) and Sprague et al. (2011). Nonparameteric statistical methods were used to explore the influence of antecedent flows on nitrate anomalies because theQratio data are positively skewed and contain outliers (Fig. 3). The strength of the correlation between nitrate anomaly and Q ra-tio was determined using Kendall’s tau, and the relara-tionship was quantified using the
15
Kendall-Theil robust line (Helsel and Hirsch, 2002). The robust line describes the re-sponse of nitrate anomaly toQratio and is defined as
CAi =βo +β1·Qri (4)
where CAiis the nitrate anomaly for day i, Qri is the flow ratio on day i, and βo and
β1are the fitted coefficients for the intercept and slope, respectively. Rather than using
20
ordinary least squares to estimate the coefficients, the slope is based on the median slope of all pairwise slopes between CAi and Qri values, and the intercept is
back-calculated using this median slope and a point defined by the median of all CAi values
and the median of all Qri values (Helsel and Hirsch, 2002). Robust lines were fit for each site using all available data.
HESSD
10, 11451–11484, 2013Antecedent flow conditions in the Mississippi River
Basin
J. C. Murphy et al.
Title Page
Abstract Introduction
Conclusions References
Tables Figures
◭ ◮
◭ ◮
Back Close
Full Screen / Esc
Printer-friendly Version Interactive Discussion
Discussion
P
a
per
|
Dis
cussion
P
a
per
|
Discussion
P
a
per
|
Discussio
n
P
a
per
Additionally, to identify the contemporaneous flow conditions in which concentrations are most sensitive to antecedent flows, data at each site were divided into flow classes according to the daily mean flow on the day of sample collection, and robust lines were fit to each site and flow class. Contemporaneous flow classes consist of four percentile ranges based on the period of record: low (<25th percentile), mid-low (>25th and
5
<50th percentile), mid-high (>50th and<75th percentile), and high (>75th percentile) contemporaneous flows.
Finally, to quantify the effect of antecedent flow on nitrate concentration, as opposed to nitrate anomaly, the percent difference in nitrate concentration relative to a previ-ous year that had average daily flows (Qratio=1) was determined using the following
10
equation,
exp (β1·Qri)
exp β1·Qravg
−1
!
·100 =
exp (β
1·Qri)
exp (β1) −1
·100
=Percent difference in concentration (5)
whereβ1 is the slope coefficient for a given site and flow class (see Tables 2 and 3),
15
Qravg=1 (theQratio value for a hypothetical day that had average daily flows the pre-vious year), and Qri is theQratio for day i. Because the denominator in Eq. (5) gives
the expected nitrate concentration following a year with average flow conditions, the re-sulting percent difference from this equation gives the anticipated increase or decrease in nitrate concentration for a given antecedent flow condition (Qri). Four hypothetical
20
HESSD
10, 11451–11484, 2013Antecedent flow conditions in the Mississippi River
Basin
J. C. Murphy et al.
Title Page
Abstract Introduction
Conclusions References
Tables Figures
◭ ◮
◭ ◮
Back Close
Full Screen / Esc
Printer-friendly Version Interactive Discussion
Discussion
P
a
per
|
Dis
cussion
P
a
per
|
Discussion
P
a
per
|
Discussio
n
P
a
per
|
4 Results and discussion
4.1 Nitrate anomaly across all contemporaneous flows
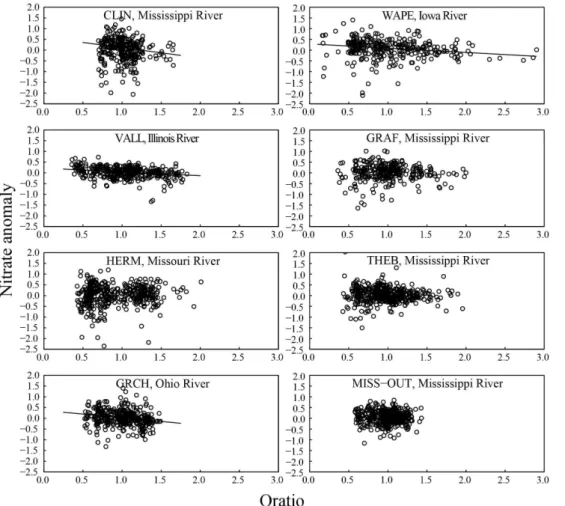
When all contemporaneous flows at each site are considered together, the upper Mis-sissippi River (CLIN) and the major tributaries (WAPE, VALL, and GRCH), except the Missouri River (HERM), exhibit statistically significant relationships (p≤0.05) between
5
Qratio and nitrate anomaly (Fig. 4), though tau is small, ranging from−0.13 to−0.17 depending on the site (Table 2). All sites have negative slopes and the steepest slope occurred in the upper Mississippi River (CLIN). Downstream Mississippi River sites (GRAF, THEB, and MISS-OUT) and the Missouri River (HERM) do not demonstrate significant relationships across the observed range of flows (Fig. 4). In general, the
10
strength of the relationships shown here (Table 2) are weaker than those reported else-where for smaller basins (e.g., Biron et al., 1999; Burt et al., 1988; Foster and Walling, 1978; Macrae et al., 2010; Welsch et al., 2001), which is not necessarily surprising given the complexity of solute behavior in large rivers (Webb and Walling, 1984).
In this analysis, the Q ratio describes previous flow conditions in a basin and also
15
serves as a proxy for changes to other physical, chemical and biological processes that are affected by inter-annual variation in the overall moisture of a basin. Grouped into two broad categories, variations in antecedent flow conditions often coincide with changes to: (1) the mass and availability of nitrate in soil (supply), and (2) hydrologic processes that move nitrate through the basin to the stream (transport). Many
pro-20
cesses control the accumulation of available nitrate in the soil during a drought, and most are closely related to soil moisture conditions. These may include increased plant stress resulting in low nitrate uptake and low crop yields (Groves and Bailey, 1997), de-creased microbial processes resulting in more limited denitrification (Ashby et al., 1998; de Klein and van Logtestijn, 1996) and decreased runoffand leaching (Emmerich and
25
HESSD
10, 11451–11484, 2013Antecedent flow conditions in the Mississippi River
Basin
J. C. Murphy et al.
Title Page
Abstract Introduction
Conclusions References
Tables Figures
◭ ◮
◭ ◮
Back Close
Full Screen / Esc
Printer-friendly Version Interactive Discussion
Discussion
P
a
per
|
Dis
cussion
P
a
per
|
Discussion
P
a
per
|
Discussio
n
P
a
per
typically coincide with lowered water tables, decreased hydrologic storage, and de-creased hydrologic connectivity, all of which inhibit nitrate transport to streams (Bernal and Sabater, 2012; Detty and McGuire, 2010; Macrae et al., 2010). Wetter antecedent conditions can cause these supply and transport limiting processes to have the oppo-site effect of minimizing the accumulation of nitrate in the soil through denitrification,
5
crop uptake and other processes, while also increasing hydrologic connectivity and the frequency with which nitrate is transported to groundwater or a stream. Although, sup-ply and transport limiting processes interact to encourage or inhibit nitrate export, the varying influence of these processes can result in inconsistent relationships between antecedent flow conditions and nitrate concentration among different basins (Macrae
10
et al., 2010) and even over time within a single basin (Burt and Worrall, 2009; Burt and Worall, 2007).
The statistically significant negative relationships (p≤0.05) between Q ratio and nitrate anomaly (Fig. 4) exhibited in the upper Mississippi River (CLIN), Iowa River (WAPE), Illinois River (ILLI) and Ohio River (GRCH) indicate dry hydrologic conditions
15
the previous year relate to higher nitrate anomalies and wet hydrologic conditions the previous year relate to lower nitrate anomalies. These four sub-basins are likely the most homogenous in the study area. At these sites, it appears soil nitrate that accu-mulates during dry periods increases the supply of nitrate, which may influence nitrate export later in the year. The remaning sites further downstream on the Mississippi
20
River (GRAF, THEB and MISS-OUT) and the Missouri River (HERM) do not provide evidence that nitrate anomalies respond to previous antcedent flow conditions, at least when considering all contemporaneous flows together. Interestingly, the GRAF site, lo-cated on the Mississippi River below the confluence with the Illinois River (Fig. 1), has relatively similar climate and basin characteristics as CLIN, WAPE and VALL (Table 1),
25
HESSD
10, 11451–11484, 2013Antecedent flow conditions in the Mississippi River
Basin
J. C. Murphy et al.
Title Page
Abstract Introduction
Conclusions References
Tables Figures
◭ ◮
◭ ◮
Back Close
Full Screen / Esc
Printer-friendly Version Interactive Discussion
Discussion
P
a
per
|
Dis
cussion
P
a
per
|
Discussion
P
a
per
|
Discussio
n
P
a
per
|
western portion of the basin, through the semi-arid Great Plains and into the humid corn belt in the most eastern portion of the basin (Fig. 1), thus making it the most het-erogeneous sub-basin in this study. The wide range of climates and terrains throughout the Missouri River Basin can cause parts of the basin to experience markedly differently hydrologic conditions simultaneously, which may lead to distinct hydrologic processes
5
in this basin compared to others in this study. Further downstream in the Mississippi River, the THEB site (Fig. 1) is primarily a mix of Missouri River water (approximately 39 %) and upstream Mississippi River water (approximately 54 %), neither of which ex-hibit statistically significant relationships. A significant relationship was not anticipated at the outflow of the Mississippi River (MISS-OUT, Fig. 4) because it is a mix of diverse
10
inputs including Ohio River water (43 %), Missouri River water (14 %), and other water from upper (19 %) and lower (24 %) portions of the basin (Table 1). The travel time of water from different locations in the MRB can take weeks to months to reach MISS-OUT (Nolan et al., 2002), thus the influence of antecedent flows observed at upstream and more homogenous tributaries is likely smeared as water moves downstream and
15
mixes with other water sources.
4.2 Nitrate anomaly by contemporaneous flow class
In most cases, the relationship betweenQratio and nitrate anomaly is stronger when the flow condition on the day of sample collection (contemporaneous flow) is consid-ered. Robust line coefficients and tau are typically greater in magnitude for specific
20
contemporaneous flow classes (Table 3) as compared to those derived using all con-temporaneous flow data together (Table 2).
4.2.1 Storm response
At the highest contemporaneous flows (>75th percentile) Qratio and nitrate anomaly are negatively related (p≤0.05) at three (CLIN, WAPE and VALL) of the eight sites
25
HESSD
10, 11451–11484, 2013Antecedent flow conditions in the Mississippi River
Basin
J. C. Murphy et al.
Title Page
Abstract Introduction
Conclusions References
Tables Figures
◭ ◮
◭ ◮
Back Close
Full Screen / Esc
Printer-friendly Version Interactive Discussion
Discussion
P
a
per
|
Dis
cussion
P
a
per
|
Discussion
P
a
per
|
Discussio
n
P
a
per
falling limbs of major storms within a basin. Also, at mid-high contemporaneous flows (>50th and <75th percentile), nitrate anomalies are negatively related to the Q ratio at three of the eight sites (VALL, THEB and GRCH) and positively related at one site (HERM). For these sites, mid-high flows include all or portions of the rising and falling limbs of a hydrograph. During periods with generally elevated flows (during the spring,
5
for example), mid-high flows typically occur near the beginning and end of a storm event. For smaller events or events that occur during a generally lower flow period (during the summer, for example), the mid-high flow range may encompass the entire event, including its peak flow.
In total, six of the eight sites (including GRAF, though the relationship is not
statis-10
tically significant (p=0.06)) show negative relationships between Q ratio and nitrate anomaly when contemporaneous flows were greater than the 50th percentile of flow (Fig. 5), suggesting a flushing response occurs during storm events that follow ex-tended dry antecedent conditions. This process has been explored extensively in the literature for forested and agricultural basins (Biron et al., 1999; Burt et al., 1988;
Fos-15
ter and Walling, 1978; Hornberger et al., 1994; Macrae et al., 2010; Walling and Fos-ter, 1975), and is primarily attributed to the rapid movement of nitrate during a storm when the water table intersects soil horizons that have accumulated elevated stocks of nitrate during periods of low moisture. Our results suggest that a flushing response, previously documented for small, relatively homogenous basins, is also observable at
20
a regional scale. Conversely, wetter antecedent conditions at these sites result in lower nitrate anomalies during storms possibly because the mass of stored nitrate has been depleted by increased export from the basin and uptake by plants earlier in the year. Noticeably, the flushing response at the highest flows (>75th percentile) is evident only for the smallest basins (<250 000 km2) and no statistically significant relationships
oc-25
HESSD
10, 11451–11484, 2013Antecedent flow conditions in the Mississippi River
Basin
J. C. Murphy et al.
Title Page
Abstract Introduction
Conclusions References
Tables Figures
◭ ◮
◭ ◮
Back Close
Full Screen / Esc
Printer-friendly Version Interactive Discussion
Discussion
P
a
per
|
Dis
cussion
P
a
per
|
Discussion
P
a
per
|
Discussio
n
P
a
per
|
influence of antecedent flow conditions (Creed and Band, 1998) in larger study basins, whereas dilution in smaller, more intensely farmed basins appears less common.
Contrary to other sites in the MRB, nitrate anomaly is positively related to theQratio in the Missouri River (HERM) during mid-high contemporaneous flows (Fig. 5). This observation directly contradicts the flushing response model described for other sites.
5
However, wetter antecedent conditions have been related to increased nitrate export in other studies, though in these studies antecedent conditions were typically considered over time periods shorter than a year and in basins smaller than those considered in this study (e.g., Welsch et al., 2001; Macrae et al., 2010).
A possible conceptualization of this relationship in the Missouri River (HERM) is that
10
the supply of exportable nitrate is reduced by irrigation or other processes during a drought. Approximately 25 % of cropland in the Missouri River Basin is irrigated mak-ing it the most irrigated basin in this study (Table 1). Durmak-ing droughts, irrigation may remove nitrate from the soil horizon by leaching, denitrification, or uptake by crops (Aulakh and Bijay-Singh, 1997; Dinnes et al., 2002). Leached nitrate typically moves
15
downward below the active root zone, leading to elevated nitrate concentrations in groundwater (Burkart and Stoner, 2008; Stites and Kraft, 2001). Increased denitrifica-tion occurs with irrigadenitrifica-tion because elevated soil moisture condidenitrifica-tions increase microbial activity (de Klein and van Logtestijn, 1996; Groves and Bailey, 1997). Which process dominates during a drought is debatable and may depend on soil properties, fertilizer
20
application rates, and climate (Aulakh and Bijay-Singh, 1997; Brown et al., 2011). In the Missouri River Basin, a recent modelling effort found that increases in irrigation relate to decreases in total nitrogen export on a regional scale (Brown et al., 2011). Irrigation likely occurs at a higher rate when the weather is drier than average, according to a study in Illinois (Bowman and Collins, 1987), therefore, lower nitrate anomalies in the
25
HESSD
10, 11451–11484, 2013Antecedent flow conditions in the Mississippi River
Basin
J. C. Murphy et al.
Title Page
Abstract Introduction
Conclusions References
Tables Figures
◭ ◮
◭ ◮
Back Close
Full Screen / Esc
Printer-friendly Version Interactive Discussion
Discussion
P
a
per
|
Dis
cussion
P
a
per
|
Discussion
P
a
per
|
Discussio
n
P
a
per
Interestingly, the Missouri River Basin also has the greatest number of dams and the largest relative storage of any basin (Table 1). The reservoirs in this basin hold approximately 1.89 times the annual flow of the Missouri River at HERM which is more than twice the relative storage of any other site in this study (Table 1). Therefore, flow conditions at HERM, and low flows in particular, are not just the result of natural
hydro-5
logic conditions but are also influenced by release decisions made by dam operators. The confounding processes of irrigation and dam storage in addition to the geophysical and climatological heterogeneity of the Missouri River Basin make even rudimentary interpretation problematic.
4.2.2 Baseflow response
10
Only the Ohio River (GRCH) and Mississippi outflow (MISS-OUT) demonstrate a sig-nificant negative response (p≤0.05) to the previous year’s flow at mid-low (>25th and
<50th percentile) or low (<25th percentile) contemporaneous flows (Fig. 5, Table 3). These flow ranges generally occur between storm events and represent baseflow con-ditions. For other sites, the lack of significant relationships during baseflow suggests
15
the groundwater system is not closely influenced by surface conditions, at least over a time span of one year. Among all tributaries to the Mississippi River, the Ohio River con-tributes about 43 % of flow to the Mississippi River (Table 1); therefore if flow at GRCH is low, flow at MISS-OUT is likely to also be low. Since low flow conditions at GRCH and MISS-OUT are closely related, it is likely any interpretation about the influence
20
HESSD
10, 11451–11484, 2013Antecedent flow conditions in the Mississippi River
Basin
J. C. Murphy et al.
Title Page
Abstract Introduction
Conclusions References
Tables Figures
◭ ◮
◭ ◮
Back Close
Full Screen / Esc
Printer-friendly Version Interactive Discussion
Discussion
P
a
per
|
Dis
cussion
P
a
per
|
Discussion
P
a
per
|
Discussio
n
P
a
per
|
4.3 Potential effect on nitrate concentration
For each statistically significant relationship (p≤0.05, Tables 2 and 3), Eq. (5) and the appropriate slope coefficient were used to translate nitrate anomalies to the percent change in nitrate concentration that would occur following a wet or dry year (Qri>1 or Qri<1, respectively) relative to the nitrate concentration expected following a year with
5
average flows (Qravg=1). For example, the three differentQratio values for the Illinois
River (VALL) in Fig. 2 represent dry antecedent flow conditions (Fig. 2a, Qri=0.39), wet antecedent flow conditions (Fig. 2b, Qri=1.77), and near-average antecedent flow
conditions (Fig. 2c, Qri=0.95). All three dates in Fig. 2 (28 March 2006; 16
Febru-ary 2010; and 5 March 1987) had mid-high contemporaneous flows. Thus, the
con-10
centration anomaly on each of the three dates can be calculated using Eq. (4) and the intercept (0.42) and slope (−0.34) values from Table 3 for VALL at mid-high flow conditions. The resulting calculations indicate concentration anomalies are expected to be positive (0.29), negative (−0.18) and near zero (0.10), respectively, for these three dates. To put the results into terms of percent change in concentration, Eq. (5)
15
was used to estimate that nitrate concentrations on these three dates will be+23 % different, −23 % different, or indistinguishable (+2 %), respectively, from nitrate con-centrations expected following an average flow year.
4.3.1 All contemporaneous flows
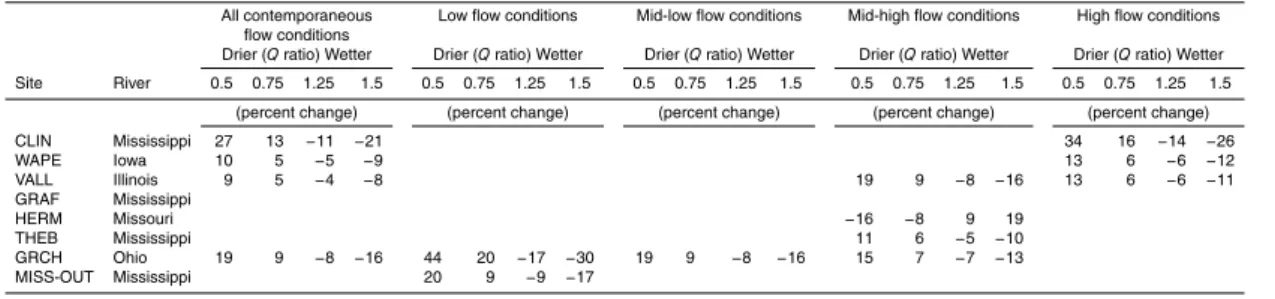
Rather than apply Eq. (5) to each day in the period of record at each site, four
hypotheti-20
calQratio scenarios were used to describe the potential response of nitrate concentra-tion to different antecedent flow conditions. HypotheticalQratios and Eq. (5) were ap-plied by site and only for the flow conditions that had significant robust line relationships (p≤0.05, Table 4). The results from this analysis are consistent with those presented for nitrate anomalies. Considering all contemporaneous flow conditions together, when
25
HESSD
10, 11451–11484, 2013Antecedent flow conditions in the Mississippi River
Basin
J. C. Murphy et al.
Title Page
Abstract Introduction
Conclusions References
Tables Figures
◭ ◮
◭ ◮
Back Close
Full Screen / Esc
Printer-friendly Version Interactive Discussion
Discussion
P
a
per
|
Dis
cussion
P
a
per
|
Discussion
P
a
per
|
Discussio
n
P
a
per
sites (WAPE, and VALL). In the upper Mississippi River (CLIN) and Ohio River (GRCH), the difference in nitrate concentration could be expected to be as much as 27 % higher or 21 % lower than expected (Table 4).
4.3.2 Storm response
Analogous to the nitrate anomaly results, nitrate concentration responds more strongly
5
to antecedent flow conditions when contemporaneous flow data are subdivided into flow classes. For contemporaneous flow classes that capture all or part of a storm event (contemporaneous flows>50th percentile), when the previous year’s flow is 25 % drier than average, nitrate concentration may be about 6 to 10 % higher than expected, for most sites where nitrate anomaly is negatively related to theQ ratio (Table 4). Nitrate
10
concentration increases to about 11 to 19 % different from expected when the previous year’s flow is 50 % drier than average. Nitrate concentration is more sensitive to an-tecedent flow conditions in the upper Mississippi River (CLIN) and when the previous year was 25 to 50 % drier than average, nitrate concentration can be 16 to 34 % higher than expected at high flows (Table 4). At these sites, differences in nitrate concentration
15
are slightly smaller in magnitude and negative when the previous year is wetter than average (Table 4). In the Missouri River, percent differences in nitrate concentration are similar in magnitude to those at other sites but opposite in direction; when the previous year was 25 or 50 % drier than average, nitrate concentration is 8 or 16 % lower than expected, respectively. With the exception of HERM, these patterns at mid-high and
20
high contemporaneous flow conditions are consistent with the conceptual model of soil nitrate flushing during storm events following a drought.
4.3.3 Baseflow response
Nitrate concentration appears to be more sensitive to changes in antecedent flow dur-ing low and mid-low contemporaneous flows in the Ohio River (GRCH) and Mississippi
25
HESSD
10, 11451–11484, 2013Antecedent flow conditions in the Mississippi River
Basin
J. C. Murphy et al.
Title Page
Abstract Introduction
Conclusions References
Tables Figures
◭ ◮
◭ ◮
Back Close
Full Screen / Esc
Printer-friendly Version Interactive Discussion
Discussion
P
a
per
|
Dis
cussion
P
a
per
|
Discussion
P
a
per
|
Discussio
n
P
a
per
|
However, while the relationships betweenQ ratio and nitrate anomaly at mid-low and low flows at GRCH and MISS-OUT are statistically significant (p≤0.05), they do not appear as visually strong as those at other sites or higher contemporaneous flow con-ditions (Fig. 5). For mid-low and low flow classes, when the previous year’s flow is 25 % drier than average, nitrate concentration may be about 9 to 20 % greater than
ex-5
pected. As antecedent flow conditions become increasingly dry (50 % of average flow) nitrate concentration can be 19 to 44 % higher than expected (Table 4). Similarly, during baseflow conditions when the previous year’s flow is 25 and 50 % wetter than average, nitrate concentration can be between 8 and 30 % lower than expected.
4.3.4 Recent observations in Iowa (2012–2013)
10
Nitrate sensors deployed in several Iowa rivers during the spring of 2013 provide some empirical support for the results presented in this study. From May 2012, through Febru-ary 2013, much of the central United States experienced moderate to extreme hydro-logic drought. By the following spring (2013), much of the State of Iowa (Fig. 1) had recovered and was moderately to very wet (National Oceanic and Atmospheric
Admin-15
istration, 2013). For example, peak discharge between early-October and mid-June of 2013 would rank as the 5th highest annual peak discharge in the 111-yr flood record at the WAPE site on the Iowa River. At this site, daily mean flow from March through May was predominately mid-high (50th to 75th percentile) to high (greater than 75th per-centile) and the mean of the dailyQratios over this period was 0.49, indicating that flow
20
during the previous year was approximately 50 % lower than average. Considering the contemporaneous flow conditions, we used Eq. (5) and observed (though provisional) daily streamflow data to predict the concentration differences for each day during this 3-month period. These predictions indicate nitrate concentration at WAPE was likely between 7 to 19 % higher (13 % higher on average) during these months than would
25
HESSD
10, 11451–11484, 2013Antecedent flow conditions in the Mississippi River
Basin
J. C. Murphy et al.
Title Page
Abstract Introduction
Conclusions References
Tables Figures
◭ ◮
◭ ◮
Back Close
Full Screen / Esc
Printer-friendly Version Interactive Discussion
Discussion
P
a
per
|
Dis
cussion
P
a
per
|
Discussion
P
a
per
|
Discussio
n
P
a
per
peaked at about 40 mg L−1in a small stream in north-central Iowa and elevated nitrate concentrations (some approximately 20–30 mg L−1) were also observed in larger rivers throughout the state. In many instances, nitrate concentrations recorded by the sen-sors were some of the highest concentrations recorded since the start of continuous nitrate monitoring in 2008 (written communication on 15 May, and 26 June 2013,
Jes-5
sica Garrett, USGS; Beeman, 2013). These recent observations in Iowa are consistent with the conceptual model of a flushing response following prolonged dry conditions described in this study.
5 Conclusions
Except for the Missouri River (HERM), our results show a negative relationship
be-10
tween antecedent flow conditions and nitrate anomaly during mid-high and high con-temporaneous flows for the major tributaries and two of the four Mississippi River main-channel sites (Fig. 5). In general, when the previous year was drier than average, ni-trate concentration is higher than expected relative to nini-trate concentrations following a year with average flow conditions. This response is likely due to the accumulation
15
of soil nitrate during a drought and subsequent flushing with moderately high to high flow events when the drought ends. When the previous year was wetter than average nitrate concentrations are lower than expected because more nitrate is likely taken up by crops, removed from the system through denitrification, or transported with greater frequency (at lower concentrations) to the stream and groundwater earlier in the year.
20
The positive relationship observed in the Missouri River (HERM) during mid-high con-temporaneous flow conditions (Fig. 5), indicates the influence of antecedent flow on nitrate anomaly not only varies by contemporaneous flow class but also regionally. The heterogeneity of the Missouri River Basin coupled with high levels of irrigation and dam storage (Table 1) make interpretation difficult but may indicate lower nitrate supply in
25
HESSD
10, 11451–11484, 2013Antecedent flow conditions in the Mississippi River
Basin
J. C. Murphy et al.
Title Page
Abstract Introduction
Conclusions References
Tables Figures
◭ ◮
◭ ◮
Back Close
Full Screen / Esc
Printer-friendly Version Interactive Discussion
Discussion
P
a
per
|
Dis
cussion
P
a
per
|
Discussion
P
a
per
|
Discussio
n
P
a
per
|
Due to the large scale of these basins and their inherent complexity, the flushing response observed at these sites is dampened (Tables 2 and 3) compared to observa-tions from smaller basins (e.g., Biron et al., 1999; Burt et al., 1988; Foster and Walling, 1978; Macrae et al., 2010; Welsch et al., 2001). Yet, nitrate concentrations following a drier or wetter than average year appear to be up to 27 or −21 % different from
5
nitrate concentrations expected following a year with average flow (Table 4). These percent differences in nitrate concentrations typically increase in magnitude when con-temporaneous flows are considered (Table 4) and can be as much as 34 % different from expected during storm events and high flows (CLIN) or up to 44 % different from expected during baseflows (GRCH). How higher-than-expected nitrate concentrations
10
following a drought will affect the hypoxic zone in the Gulf of Mexico is debatable and is likely influenced by factors such as, the timing of delivery to the Gulf (during the spring versus the fall, for example), the magnitude of flows transporting nitrate through the basin, the spatial and temporal variability of sub-basins experiencing drought and flushing, and changes to nutrient management practices throughout the basin.
15
While this study identifies significant relationships between antecedent flow condi-tions and nitrate concentration, it does little to explain the cause of these relacondi-tionships, thus we propose several questions to encourage future studies on this topic at similar scales.
– What are the controlling influences for relationships between antecedent flow
con-20
ditions and nutrient export, and how do these relationships change based on cli-mate, basin characteristics, and management practices?
– Do relationships between antecedent flows and nitrate export change over time, as documented in other basins with long temporal records (Burt and Worrall, 2009; Burt and Worall, 2007)?
25
HESSD
10, 11451–11484, 2013Antecedent flow conditions in the Mississippi River
Basin
J. C. Murphy et al.
Title Page
Abstract Introduction
Conclusions References
Tables Figures
◭ ◮
◭ ◮
Back Close
Full Screen / Esc
Printer-friendly Version Interactive Discussion
Discussion
P
a
per
|
Dis
cussion
P
a
per
|
Discussion
P
a
per
|
Discussio
n
P
a
per
– Based on these results might it be possible to develop a better statistical model of nitrate export that simultaneously uses both current and antecedent flow con-ditions to estimate concentration?
– How would one go about using new, high frequency nitrate sensor data to improve understanding on how antecedent flows influence solute concentration? Will these
5
new, richer data sets facilitate understanding of storage, transport, and processing of nitrogen within watersheds at this scale?
The results of our analysis suggest that nitrate transport in the Mississippi River Basin is not a simple product of current hydrologic conditions and nitrate concen-trations, but rather an integration of current conditions with past inputs of water and
10
changes in nitrate supply that vary regionally and with contemporaneous flow classes. Therefore, an improved understanding of the evolving pattern of nitrate fluxes from the entire Mississippi River Basin will require detailed analysis of the diverse patterns of nitrate export from the various sub-basins and their interaction with similarly variable spatial and temporal patterns of climate and management practices. As a result, the
15
evaluation of progress in nutrient management will benefit from consideration of an-tecedent influences.
Acknowledgements. We thank the many US Geological Survey (USGS) personnel who col-lected the extensive data used in this report. We also thank Brent Aulenbach (USGS) for com-piling and preparing the streamflow and water chemistry data used in this report and James
Fal-20
cone (USGS) for providing geographic information for the study basins.
References
Ashby, J. A., Bowden, W. B., and Murdoch, P. S.: Controls on denitrification in riparian soils in headwater catchments of a hardwood forest in the Catskill Mountains, U.S.A., Soil Biol. Biochem., 30, 853–864, 1998.
25
HESSD
10, 11451–11484, 2013Antecedent flow conditions in the Mississippi River
Basin
J. C. Murphy et al.
Title Page
Abstract Introduction
Conclusions References
Tables Figures
◭ ◮
◭ ◮
Back Close
Full Screen / Esc
Printer-friendly Version Interactive Discussion
Discussion
P
a
per
|
Dis
cussion
P
a
per
|
Discussion
P
a
per
|
Discussio
n
P
a
per
|
Aulenbach, B. T., Buxton, H. T., Battaglin, W. A., and Coupe, R. H.: Flow and nutrient fluxes of the Mississippi-Atchafalaya River Basin and subbasins for the period of record through 2005, US Geological Survey Open-File Report 2007-1080, http://toxics.usgs.gov/ pubs/of-2007-1080/, last access: September 2013, US Geological Survey, 2007.
Beeman, P.: Nitrate spike tests Des Moines water supplies, Des Moines Register,
avail-5
able online at: http://www.desmoinesregister.com/article/20130701/NEWS/307010028/ Nitrate-spike-tests-Des-Moines-water-supplies?odyssey=tab%7Ctopnews%7Ctext% 7CFrontpage, last access: 30 June 2013.
Bernal, S. and Sabater, F.: Changes in discharge and solute dynamics between hills-lope and valley-bottom intermittent streams, Hydrol. Earth Syst. Sci., 16, 1595–1605,
10
doi:10.5194/hess-16-1595-2012, 2012.
Biron, P. M., Roy, A. G., Courschesne, F., Hendershot, W. H., Cote, B., and Fyles, J.: The effect of antecedent moisture conditions on the relationship of hydrology to hydrochemistry in a small forested watershed, Hydrol. Process., 13, 1541–1555, 1999.
Bowman, J. A. and Collins, M. A.: Impacts of irrigation and drought on Illinois ground-water
15
resources, ISWS/RI-109/87, State of Illinois, Department of Energy and Natural Resources, Illinois state water survey, Illinois, 31 pp., 1987.
Brown, J. B., Sprague, L. A., and Dupree, J. A.: Nutrient sources and transport in the Missouri River basin, with emphasis on the effects of irrigation and reservoirs, J. Am. Water Resour. Assoc., 47, 1034–1060, 2011.
20
Burkart, M. R. and Stoner, J. D.: Chapter 7, Nitrogen in groundwater associated with agricultural systems, in: Nitrogen in the Environment: Sources, Problems, and Management, Academic Press/Elsevier, Amsterdam, Boston, 177–202, 2008.
Burt, T. and Worrall, F.: Non-stationarity in long time series: some curious reversals in the ‘memory’ effect, Hydrol. Process., 21, 3529–3531, 2007.
25
Burt, T. P. and Worrall, F.: Stream nitrate levels in a small catchment in south west England over a period of 35 years (1970–2005), Hydrol. Process., 23, 2056–2068, 2009.
Burt, T. P., Arkell, B. P., Trudgill, S. T., and Walling, D. E.: Stream nitrate levels in a small catchment in south west England over a period f 15 years, Hydrol. Process., 2, 267–284, 1988.
30
Cooper, R., Thoss, V., and Watson, H.: Factors influencing the release of dissolved organic carbon and dissolved forms of nitrogen from a small upland headwater during autumn runoff
HESSD
10, 11451–11484, 2013Antecedent flow conditions in the Mississippi River
Basin
J. C. Murphy et al.
Title Page
Abstract Introduction
Conclusions References
Tables Figures
◭ ◮
◭ ◮
Back Close
Full Screen / Esc
Printer-friendly Version Interactive Discussion
Discussion
P
a
per
|
Dis
cussion
P
a
per
|
Discussion
P
a
per
|
Discussio
n
P
a
per
Creed, I. F. and Band, L. E.: Export of nitrogen from catchments within a temperate forest: Evi-dence for a unifying mechanism regulated by variable source area dynamics, Water Resour. Res., 34, 3105–3120, 1998.
de Klein, C. A. M. and van Logtestijn, R. S. P.: Denitification in grassland soils in the Netherlands in relation to irrigation, N-application rate, soil water content and soil temperature, Soil Biol.
5
Biochem., 28, 231–237, 1996.
Detty, J. M. and McGuire, K. J.: Topographic controls on shallow groundwater dynamics: im-plications of hydrologic connectivity between hillslopes and riparian zones in a till mantled catchment, Hydrol. Process., 24, 2222–2236, 2010.
Dinnes, D. L., Karlen, D. L., Jaynes, D. B., Kaspar, T. C., Hatfield, J. L., Colvin, T. S., and
Cam-10
bardella, C. A.: Nitrogen management strategies to reduce nitrate leaching in tile-drained Midwestern soils, Agron. J., 94, 153–171, 2002.
Donner, S. D. and Scavia, D.: How climate controls the flux of nitrogen by the Mississippi River and the development of hypoxia in the Gulf of Mexico, Limnol. Oceanogr., 52, 856–861, 2007.
15
Emmerich, W. E. and Heitschmidt, R. K.: Drought and Grazing: II. Effects on runoffand water quality, J. Range Manage., 55, 229–234, 2002.
Ferguson, R., Shapiro, C., Wortmann, C., Shaver, T., and Hergert, G., University of Nebraska-Lincoln Extension, CropWatch, Nebraska crop production & pest management information, Checking for Residual nitrate this spring: http://cropwatch.unl.edu/web/cropwatch/archive?
20
articleID=5121463, last access: 21 June 2013, posted: 6 March 2013.
Foster, I. D. L. and Walling, D. E.: The effects of the 1976 drought and autumn rainfall on stream solute levels, Earth Surf. Proc., 3, 393–406, 1978.
Garrett, J.: Concentrations, loads and yields of select constituents from major tributaries of the Mississippi and Missouri Rivers in Iowa, Water Years 2004–2008, US Geological Survey
Sci-25
entific Investigations Report 2012-5240, http://pubs.usgs.gov/sir/2012/5240/sir2012-5240. pdf, last access: September 2013, US Geological Survey, 72 pp., 2012.
Groves, S. J. and Bailey, R. J.: The influence of sub-optimal irrigation and drought on crop yield, N uptake and risk of N leaching from sugarbeet, Soil Use Manage., 13, 190–195, 1997. Helsel, D. R. and Hirsch, R. M.: Statistical methods in water resources, Techniques of
30
HESSD
10, 11451–11484, 2013Antecedent flow conditions in the Mississippi River
Basin
J. C. Murphy et al.
Title Page
Abstract Introduction
Conclusions References
Tables Figures
◭ ◮
◭ ◮
Back Close
Full Screen / Esc
Printer-friendly Version Interactive Discussion
Discussion
P
a
per
|
Dis
cussion
P
a
per
|
Discussion
P
a
per
|
Discussio
n
P
a
per
|
Hirsch, R. M., Moyer, D. L., and Archfield, S. A.: Weighted regressions on time, discharge, and season (WRTDS), with an application to Chesapeake Bay river inputs, J. Am. Water Resour. Assoc., 46, 857–880, 2010.
Hornberger, G. M., Bencala, K. E., and McKnight, D. M.: Hydrological controls on dissolved organic carbon during snowmelt in the Snake River near Montezuma, Colorado,
Biogeo-5
chemistry, 25, 147–165, 1994.
Lange, J. and Haensler, A.: Runoff generation following a prolonged dry period, J. Hydrol., 464–465, 157–164, 2012.
Macrae, M. L., English, M. C., Schiff, S. L., and Stone, M.: Influence of antecedent hydrologic conditions on patterns of hydrochemical export from a first-order agricultural watershed in
10
Southern Ontario, Canada, J. Hydrol., 389, 101–110, 2010.
National Oceanic and Atmospheric Administration: National Climatic Data Center, Climate Mon-itoring Group Palmer Hydrological Drought Index – May 2012 to April 2013: http://www.ncdc. noaa.gov/oa/climate/research/prelim/drought/palmer.html, last access: 21 June 2013. Nolan, J. V., Brakebill, J. W., Alexander, R. B., and Schwarz, G. E.: ERF1 2 – Enhanced
15
River Reach File 2.0: http://water.usgs.gov/GIS/metadata/usgswrd/XML/erf12.xml, last ac-cess: 2 June 2013.
Pervez, M. S. and Brown, J. F.: Mapping irrigated lands at 250-m scale by merging MODIS data and national agricultural statistic, Remote Sensing, 2, 2388–2414, 2010.
Rabalais, N. N. and Turner, R. E.: Hypoxia in the northern Gulf of Mexico: description,
20
causes and change, in: Coastal Hypoxia: Consequences for living resources and ecosys-tems, Coastal and Estuarine Studies, American Geophysical Union, Washington, D.C., 1–36, 2001.
Randall, G. W., Vetsch, J. A., and Huffman, J. R.: Nitrate losses in subsurface drainage from a corn-soybean rotation as affected by time of nitrogen application and use of Nitrapyrin, J.
25
Environ. Qual., 32, 1764–1772, 2003.
Rehm, G., Schmitt, M., and Eliason, R.: University of Minnesota-Extension, Using soil ni-trate test in Minnesota, WW-07310: http://www.extension.umn.edu/distribution/cropsystems/ DC7310.html, last access: 21 June 2013, posted: 2009.
Sawyer, J.: Iowa State University-Extension, Soil profile nitrate in corn fields following the
30
HESSD
10, 11451–11484, 2013Antecedent flow conditions in the Mississippi River
Basin
J. C. Murphy et al.
Title Page
Abstract Introduction
Conclusions References
Tables Figures
◭ ◮
◭ ◮
Back Close
Full Screen / Esc
Printer-friendly Version Interactive Discussion
Discussion
P
a
per
|
Dis
cussion
P
a
per
|
Discussion
P
a
per
|
Discussio
n
P
a
per
Scavia, D., Rabalais, N. N., Turner, R. E., Justic, D., and Wiseman, W. J.: Predicting the re-sponse of Gulf of Mexico hypoxia to variation in Mississippi River nitrogen load, Limnol. Oceanogr., 48, 951–956, 2003.
Soulsby, C., Petry, J., Brewer, M. J., Dunn, S. M., Ott, B., and Malcolm, I. A.: Identifying and assessing uncertainty in hydrological pathways: a novel approach to end member mixing in
5
a Scottish agricultural catchment, J. Hydrol., 274, 109–128, 2003.
Sprague, L. A., Hirsch, R. M., and Aulenbach, B. T.: Nitrate in the Mississippi River and its tributaries, 1980 to 2008: Are we making progress?, Environ. Sci. Technol., 45, 7209–7216, 2011.
Stites, W. and Kraft, G. J.: Nitrate and chloride loading to groundwater from an irrigated
north-10
central U.S. sand-plain vegetable field, J. Environ. Qual., 30, 1176–1184, 2001.
Turner, R. E., Rabalais, N. N., and Justic, D.: Predicting summer hypoxia in the northern Gulf of Mexico: Riverine N, P, and Si loading, Mar. Pollut. Bull., 52, 139–148, 2006.
Vecchia, A. V., Martin, J. D., and Gilliom, R. J.: Modeling variability and trends in pesticide concentrations in streams, J. Am. Water Resour. Assoc., 44, 1308–1324, 2008.
15
Walling, D. E. and Foster, I. D. L.: Variations in the natural chemical concentration of river water during flood flows, and the lag effect: some further comments, J. Hydrol., 26, 237–244, 1975. Webb, B. W. and Walling, D. E.: Stream solute behavior in the River Exe basin, Devon, UK,
Dissolved loads of rivers and surface water quantity/quality relationships, Proceedings of the Hamburg Symposium, August 1983, IAHS Publ, 141, 153–169, 1984.
20
HESSD
10, 11451–11484, 2013Antecedent flow conditions in the Mississippi River
Basin
J. C. Murphy et al.
Title Page
Abstract Introduction
Conclusions References
Tables Figures
◭ ◮
◭ ◮
Back Close
Full Screen / Esc
Printer-friendly Version Interactive Discussion
Discussion
P
a
per
|
Dis
cussion
P
a
per
|
Discussion
P
a
per
|
Discussio
n
P
a
per
|
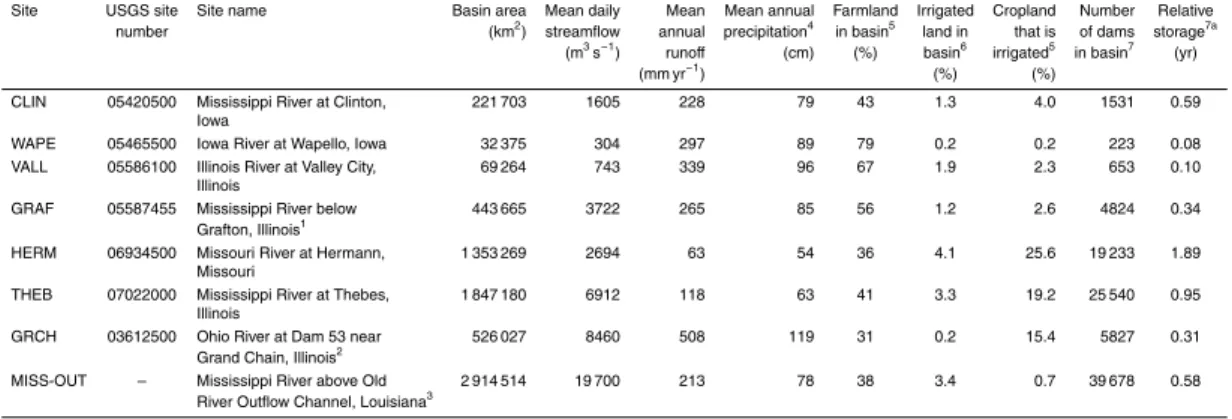
Table 1.Site information and basin characteristics for eight sites in the Mississippi River Basin. (USGS, US Geological Survey; km2, square kilometres; m3s−1, cubic meters per second; mm yr−1, millimetres per year; cm, centimetres.)
Site USGS site Site name Basin area Mean daily Mean Mean annual Farmland Irrigated Cropland Number Relative number (km2) streamflow annual precipitation4 in basin5 land in that is of dams storage7a
(m3s−1) runo
ff (cm) (%) basin6 irrigated5 in basin7 (yr) (mm yr−1
) (%) (%)
CLIN 05420500 Mississippi River at Clinton, 221 703 1605 228 79 43 1.3 4.0 1531 0.59 Iowa
WAPE 05465500 Iowa River at Wapello, Iowa 32 375 304 297 89 79 0.2 0.2 223 0.08 VALL 05586100 Illinois River at Valley City, 69 264 743 339 96 67 1.9 2.3 653 0.10
Illinois
GRAF 05587455 Mississippi River below 443 665 3722 265 85 56 1.2 2.6 4824 0.34 Grafton, Illinois1
HERM 06934500 Missouri River at Hermann, 1 353 269 2694 63 54 36 4.1 25.6 19 233 1.89 Missouri
THEB 07022000 Mississippi River at Thebes, 1 847 180 6912 118 63 41 3.3 19.2 25 540 0.95 Illinois
GRCH 03612500 Ohio River at Dam 53 near 526 027 8460 508 119 31 0.2 15.4 5827 0.31 Grand Chain, Illinois2
MISS-OUT – Mississippi River above Old 2 914 514 19 700 213 78 38 3.4 0.7 39 678 0.58 River Outflow Channel, Louisiana3
1streamflow measured at Mississippi River at Grafton, Illinois (USGS site number 05587450).2streamflow measured at Ohio River at Metropolis,
Illinois (USGS site number 03611500).3MISS-OUT is meant to provide an approximation of streamflow and concentration just upstream of the Old
River Outflow Channel. Streamflow is the sum of Mississippi River at Tarbert Landing, Mississippi (US Army Corps of Engineers site 01100) and Old River Outflow Channel near Knox Landing, Louisiana (US Army Corps of Engineers site 02600) and nitrate data was sampled at Mississippi River
near St. Francisville, Louisiana (USGS site number 07373420).4Prism data produced by Oregon State, (4-km) 1970–2011,
http://www.prism.oregonstate.edu/.5US National Atlas, 2002, county-level, http://nationalatlas.gov/atlasftp.html and http://www.agcensus.usda.gov/.
6
USGS MODIS-derived data, 2002, http://earlywarning.usgs.gov/USirrigation/ and Pervez and Brown, 2010.7National Inventory of Dams dataset
produced by the Army Core of Engineers, 2009, http://crunch.tec.army.mil/, dataset updated (duplicates removed and approximately 70 % verified).
7aRelative storage
HESSD
10, 11451–11484, 2013Antecedent flow conditions in the Mississippi River
Basin
J. C. Murphy et al.
Title Page
Abstract Introduction
Conclusions References
Tables Figures
◭ ◮
◭ ◮
Back Close
Full Screen / Esc
Printer-friendly Version Interactive Discussion
Discussion
P
a
per
|
Dis
cussion
P
a
per
|
Discussion
P
a
per
|
Discussio
n
P
a
per
Table 2.Kendall’s tau and robust line results of nitrate anomaly andQratio relationships, using all contemporaneous flow data. Statistically significant relationships (p <=0.05) are bolded.
Site River Tau pvalue Intercept Slope n∗
CLIN Mississippi −0.13 0.00 0.60 −0.48 315
WAPE Iowa −0.15 0.00 0.29 −0.20 312
VALL Illinois −0.17 0.00 0.22 −0.18 370
GRAF Mississippi −0.03 0.50 0.10 −0.05 308 HERM Missouri 0.06 0.06 −0.03 0.12 429 THEB Mississippi −0.05 0.09 0.12 −0.09 431
GRCH Ohio −0.16 0.00 0.37 −0.34 378
MISS-OUT Mississippi −0.05 0.15 0.16 −0.12 401 ∗
HESSD
10, 11451–11484, 2013Antecedent flow conditions in the Mississippi River
Basin
J. C. Murphy et al.
Title Page
Abstract Introduction
Conclusions References
Tables Figures
◭ ◮
◭ ◮
Back Close
Full Screen / Esc
Printer-friendly Version Interactive Discussion
Discussion
P
a
per
|
Dis
cussion
P
a
per
|
Discussion
P
a
per
|
Discussio
n
P
a
per
|
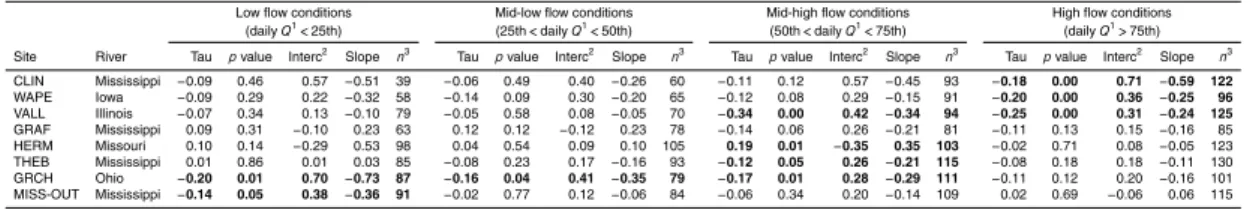
Table 3.Kendall’s tau and robust line results of nitrate anomaly andQ ratio relationships, by contemporaneous flow class. Statistically significant (p <=0.05) are bolded.
Low flow conditions Mid-low flow conditions Mid-high flow conditions High flow conditions (dailyQ1<25th) (25th<dailyQ1<50th) (50th<dailyQ1<75th) (dailyQ1>75th)
Site River Tau pvalue Interc2 Slope n3 Tau pvalue Interc2 Slope n3 Tau pvalue Interc2 Slope n3 Tau pvalue Interc2 Slope n3
CLIN Mississippi −0.09 0.46 0.57 −0.51 39 −0.06 0.49 0.40 −0.26 60 −0.11 0.12 0.57 −0.45 93 −0.18 0.00 0.71 −0.59 122
WAPE Iowa −0.09 0.29 0.22 −0.32 58 −0.14 0.09 0.30 −0.20 65 −0.12 0.08 0.29 −0.15 91 −0.20 0.00 0.36 −0.25 96
VALL Illinois −0.07 0.34 0.13 −0.10 79 −0.05 0.58 0.08 −0.05 70 −0.34 0.00 0.42 −0.34 94 −0.25 0.00 0.31 −0.24 125
GRAF Mississippi 0.09 0.31 −0.10 0.23 63 0.12 0.12 −0.12 0.23 78 −0.14 0.06 0.26 −0.21 81 −0.11 0.13 0.15 −0.16 85 HERM Missouri 0.10 0.14 −0.29 0.53 98 0.04 0.54 0.09 0.10 105 0.19 0.01 −0.35 0.35 103 −0.02 0.71 0.08 −0.05 123 THEB Mississippi 0.01 0.86 0.01 0.03 85 −0.08 0.23 0.17 −0.16 93 −0.12 0.05 0.26 −0.21 115 −0.08 0.18 0.18 −0.11 130 GRCH Ohio −0.20 0.01 0.70 −0.73 87 −0.16 0.04 0.41 −0.35 79 −0.17 0.01 0.28 −0.29 111 −0.11 0.12 0.20 −0.16 101 MISS-OUT Mississippi −0.14 0.05 0.38 −0.36 91 −0.02 0.77 0.12 −0.06 84 −0.06 0.34 0.20 −0.14 109 0.02 0.69 −0.06 0.06 115
1dailyQ