BGD
7, 5497–5515, 2010Carbon isotope fractionation in methanogenic
peatlands
P. E. Galand et al.
Title Page
Abstract Introduction
Conclusions References
Tables Figures
◭ ◮
◭ ◮
Back Close
Full Screen / Esc
Printer-friendly Version Interactive Discussion
Discussion
P
a
per
|
Dis
cussion
P
a
per
|
Discussion
P
a
per
|
Discussio
n
P
a
per
|
Biogeosciences Discuss., 7, 5497–5515, 2010 www.biogeosciences-discuss.net/7/5497/2010/ doi:10.5194/bgd-7-5497-2010
© Author(s) 2010. CC Attribution 3.0 License.
Biogeosciences Discussions
This discussion paper is/has been under review for the journal Biogeosciences (BG). Please refer to the corresponding final paper in BG if available.
Stable carbon isotope fractionation
during methanogenesis in three boreal
peatland ecosystems
P. E. Galand1,2, K. Yrj ¨al ¨a3, and R. Conrad4
1
UPMC Univ Paris 06, Observatoire Oc ´eanologique, 66651 Banyuls-sur-Mer, France
2
CNRS, FRE 3350, Laboratoire d’ ´ecog ´eochimie des environnements benthiques (LECOB), Observatoire Oc ´eanologique, 66651 Banyuls-sur-Mer, France
3
Department of Biological and Environmental Sciences, General Microbiology, University of Helsinki, 00014 Helsinki, Finland
4
Max-Planck-Institute for Terrestrial Microbiology, Karl-von-Frisch-Str. 10, 35043 Marburg, Germany
Received: 24 June 2010 – Accepted: 29 June 2010 – Published: 16 July 2010
Correspondence to: R. Conrad (conrad@mpi-marburg.mpg.de)
BGD
7, 5497–5515, 2010Carbon isotope fractionation in methanogenic
peatlands
P. E. Galand et al.
Title Page
Abstract Introduction
Conclusions References
Tables Figures
◭ ◮
◭ ◮
Back Close
Full Screen / Esc
Printer-friendly Version Interactive Discussion
Discussion
P
a
per
|
Dis
cussion
P
a
per
|
Discussion
P
a
per
|
Discussio
n
P
a
per
|
Abstract
The degradation of organic matter to CH4and CO2 was investigated in three different
boreal peatland systems in Finland, a mesotrophic fen (MES), an oligotrophic fen (OLI),
and an ombrotrophic peat (OMB). MES had similar production rates of CO2 and CH4,
but the two nutrient-poor peatlands (OLI and OMB) produced in general more CO2
5
than CH4.δ
13
C analysis of CH4and CO2in the presence and absence methyl fluoride
(CH3F), an inhibitor of acetoclastic methanogenesis, showed that CH4 was
predomi-nantly produced by hydrogenotrophic methanogenesis and that acetoclastic methano-genesis only played an important role in MES. These results, together with our
obser-vations concerning the collective inhibition of CH4and CO2production rates by CH3F,
10
indicate that organic matter was degraded through different paths in the mesotrophic
and the nutrient-poor peatlands. In the mesotrophic fen, the major process is canoni-cal fermentation followed by acetoclastic and hydrogenotrophic methanogenesis, while in the nutrient-poor peat, organic matter was apparently degraded to a large extent
by a different path which finally involved hydrogenotrophic methanogenesis. Our data
15
suggest that degradation of organic substances in the oligotrophic environments was incomplete and involved the use of organic compounds as oxidants.
1 Introduction
Northern peatlands cover about 400 million km2 (Gorham 1991) and are important
emitters of the greenhouse gas methane (Matthews and Fung, 1987; Bartlett and
Har-20
riss, 1993). Our knowledge about the methanogenic substrates and the pathway by
which CH4 is produced is, however, still limited. Anaerobic degradation of organic
matter eventually results in the production of acetate, CO2 and H2as end products of
fermentation (Zinder, 1993). Degradation of cellulose, for example, would result in the
production of 2 acetate, 2 CO2 and 4 H2 from each hexose molecule, which are then
25
BGD
7, 5497–5515, 2010Carbon isotope fractionation in methanogenic
peatlands
P. E. Galand et al.
Title Page
Abstract Introduction
Conclusions References
Tables Figures
◭ ◮
◭ ◮
Back Close
Full Screen / Esc
Printer-friendly Version Interactive Discussion
Discussion
P
a
per
|
Dis
cussion
P
a
per
|
Discussion
P
a
per
|
Discussio
n
P
a
per
|
3 CO2 (Conrad, 1999). Under these conditions, 2 CH4 are derived from acetate and
1 CH4 from H2/CO2. In fact, this path of CH4 production has been demonstrated in
various peat bogs ranging from Michigan (Avery et al., 1999), western Siberia (Kot-syurbenko et al., 2004) to the permafrost region of northwestern Siberia (Metje and Frenzel, 2007). In some peat ecosystems, however, acetoclastic methanogenesis is
5
apparently impeded and CH4is mainly produced from H2/CO2(Lansdown et al., 1992;
Horn et al., 2003; Metje and Frenzel, 2005; Prater et al., 2007). In Alaskan peatland
acetate was found to accumulate instead of being further converted to CH4
(Duddle-ston et al., 2002). In a Finnish peat bog part of the acetate was found to be further converted to butyrate (Metje and Frenzel, 2005). Later studies indicated that a
de-10
creasing pH resulted in decreasing acetate turnover and in the relative dominance of hydrogenotrophic methanogenesis (Kotsyurbenko et al., 2007), and that the type
of vegetation, i.e., dominance of Sphagnum over vascular plants, coincides with the
occurrence of acetate accumulation (Hines et al., 2008). When acetoclastic methano-genesis operates, it seems to occur preferably in the upper peat layers, whereas the
15
deep layers are dominated by CH4production from H2/CO2(Popp et al., 1999; Chasar
et al., 2000; Kotsyurbenko et al., 2004). These observations indicate that the quality of
the degradable organic substances may affect the path of CH4production (Chanton et
al., 2008).
The methanogenic path is crucial for the extent of carbon isotope fractionation, as
20
methanogenesis by CO2 reduction exhibits a much stronger fractionation factor than
acetoclastic methanogenesis (Whiticar et al., 1986). Vice versa it is principally possible
to use values of δ13C measured in CH4, CO2 and acetate to compute the relative
contribution of each pathway to total CH4 production (Conrad, 2005). This approach
has also been used for peat ecosystems (Lansdown et al., 1992; Avery et al., 1999;
25
BGD
7, 5497–5515, 2010Carbon isotope fractionation in methanogenic
peatlands
P. E. Galand et al.
Title Page
Abstract Introduction
Conclusions References
Tables Figures
◭ ◮
◭ ◮
Back Close
Full Screen / Esc
Printer-friendly Version Interactive Discussion
Discussion
P
a
per
|
Dis
cussion
P
a
per
|
Discussion
P
a
per
|
Discussio
n
P
a
per
|
in the generaMethanosarcina orMethanosaeta(Zinder, 1993), which are not always
present in peat ecosystems (Horn et al., 2003; Kotsyurbenko et al., 2007; Rooney-Varga et al., 2007). Hydrogenotrophic methanogenesis, on the other hand, occurs in almost every methanogenic taxon (Zinder, 1993), which are always present at more or less diversity in peat bogs.
5
Recently, we have studied three different peat ecosystems (a mesotrophic fen, an
oligotrophic fen, and an ombrotrophic bog) in Finland, which differed in composition
of the methanogenic archaeal community and also exhibited hydrogenotrophic and
acetoclastic methanogenesis to different extent (Galand et al., 2005). While measuring
CH4 production at different concentrations of methyl fluoride (CH3F), an inhibitor of
10
acetoclastic methanogenesis, we also determined theδ13C of CH4, CO2and acetate.
We report these data and quantify the relative contribution of hydrogenotrophic and
acetoclastic methanogenesis to CH4 production. We hypothesized that the different
peat ecosystems differ in the extent of isotope fractionation due to different paths of
CH4production with the nutrient poor ombrotrophic and oligotrophic systems exhibiting
15
larger isotope fractionation than the mesotrophic fen.
2 Methods
Samples– Three replicate peat profiles were taken with a box sampler (8×8×100 cm)
in August 2003 from the Lakkasuo mire complex in central Finland (61◦48′N, 24◦19′E).
The samples were taken from a mesotrophic fen (MES), an oligotrophic fen (OLI) and
20
an ombrotrophic bog (OMB) at a depth of 10–20 cm below the water level. These
layers exhibited the highest potential CH4production rates (Galand et al., 2002). The
BGD
7, 5497–5515, 2010Carbon isotope fractionation in methanogenic
peatlands
P. E. Galand et al.
Title Page
Abstract Introduction
Conclusions References
Tables Figures
◭ ◮
◭ ◮
Back Close
Full Screen / Esc
Printer-friendly Version Interactive Discussion
Discussion
P
a
per
|
Dis
cussion
P
a
per
|
Discussion
P
a
per
|
Discussio
n
P
a
per
|
Incubation experiments – Peat samples were incubated anaerobically at 10◦C in
100-mL infusion bottles as described before (Galand et al., 2002). For inhibition
of acetoclastic methanogenesis methyl fluoride (CH3F) (99%, ABCR, Karlsruhe,
Germany) was added to the gas phase to give a final mixing ratio of 0.5–2.0% CH3F.
Aliquots of the gas phase were regularly analyzed for CH4 and CO2. Methane was
5
analyzed by gas chromatography using a flame ionization detector; CO2was analyzed
after conversion to CH4 with a methanizer. At the end of incubation, the pore water
was recovered by centrifugation and filtration through 0.2-µm pore size membrane filters (SRP 15; Sartorius, G ¨ottingen, Germany). The pH was measured using a glass electrode. Acetate (and other fatty acids) was analyzed by high pressure liquid
10
chromatography (HPLC) (Sykam, Gilching, Germany) equipped with both refraction
index detector and UV detector (Krumb ¨ock and Conrad, 1991). The δ13C of CH4
and CO2 were analyzed by gas chromatography combustion isotope ratio mass
spectrometry (GC-C-IRMS), and theδ13C of acetate was analyzed by HPLC-C-IRMS
as described before (Conrad et al., 2007). Analysis of δ13C in organic matter was
15
done at the Institute of Soil Science and Forest Nutrition (IBW) at the University of G ¨ottingen using an elemental analyzer coupled to an IRMS.
Calculations – Fractionation factors for a reaction A→B are defined after Hayes
(Hayes, 1993):
20
αA,B=(δ13CA+1000)/(δ13CB+1000) (1)
sometimes expressed as isotopic enrichment factorε≡1−α (in units of permil). The
δ13C for a newly formed CH4(δ
13
Cnew) was calculated from theδ
13
C at two time points
t=1 (δ13C1) andt=2 (δ13C2) by the following mass balance equation:
δ13C2=fnewδ13Cnew+(1−fnew)δ13C1 (2) 25
with fnew being the fraction of the newly formed C-compound relative to the total at
BGD
7, 5497–5515, 2010Carbon isotope fractionation in methanogenic
peatlands
P. E. Galand et al.
Title Page
Abstract Introduction
Conclusions References
Tables Figures
◭ ◮
◭ ◮
Back Close
Full Screen / Esc
Printer-friendly Version Interactive Discussion
Discussion
P
a
per
|
Dis
cussion
P
a
per
|
Discussion
P
a
per
|
Discussio
n
P
a
per
|
The fractionation factor for conversion of H2/CO2to CH4is given by
αCO2,CH4=(δ13CCO2+1000)/(δ13CCH4-CH3F+1000) (3)
whereδ13CCH4-CH3F is theδ
13
CCH4 produced in the presence of CH3F, i.e., with
aceto-clastic methanogenesis inhibited.
Relative contribution of H2+CO2-derived CH4 to total CH4 was determined using
5
the following mass balance equation (Conrad, 2005):
fCO2,CH4=(δ 13
CCH4−δ13CCH4-ac)/(δ13CCH4-CO2−δ13CCH4-ac) (4)
wherefCO2,CH4 is the fraction of CH4 formed from H2+CO2, δ
13
CCH4 the δ
13
C of
to-tal produced methane, andδ13CCH4-acand δ
13
CCH4-CO2 are theδ
13
C of CH4 derived
either from acetate or H2+CO2, which were determined by:
10
δ13CCH4-ac=δ13Corg+εorg,CH4 (5)
δ13CCH
4-CO2=δ 13C
CH4-CH3F (6)
In general, calculations were done using the averaged data (± standard error) from
triplicate incubations. Total amounts of gases in the headspace of the incubation ves-sels were calculated from the partial pressures using the volume of the gas space and
15
the gas constant.
3 Results
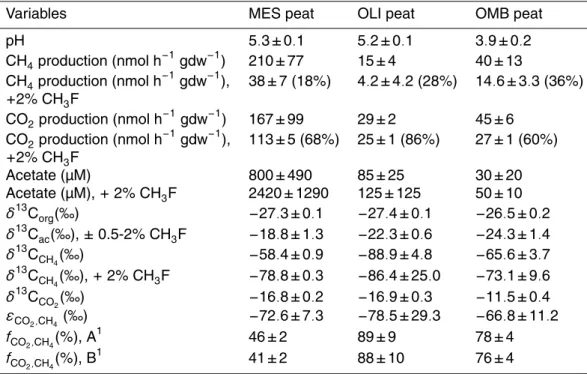
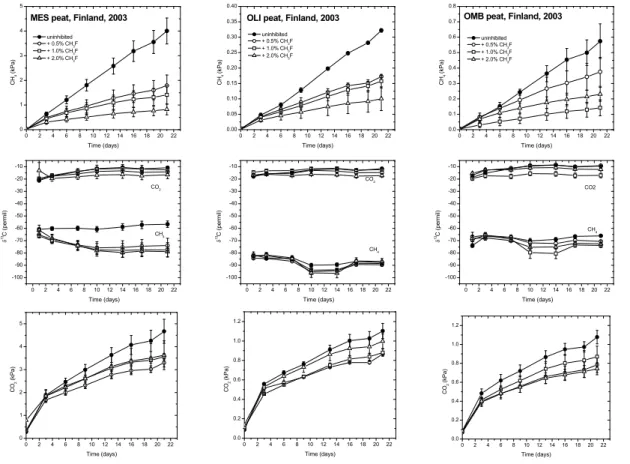
Production rates of CH4 were much higher in peat samples from the mesotrophic fen
(MES) than from the ombrotrophic peat (OMB) and the oligotrophic fen (OLI) (Table 1).
The same was found for CO2production (Table 1). The extent of inhibition of CH4
pro-20
duction by CH3F was larger in MES>OMB>OLI (Table 1). Production of CH4was
BGD
7, 5497–5515, 2010Carbon isotope fractionation in methanogenic
peatlands
P. E. Galand et al.
Title Page
Abstract Introduction
Conclusions References
Tables Figures
◭ ◮
◭ ◮
Back Close
Full Screen / Esc
Printer-friendly Version Interactive Discussion
Discussion
P
a
per
|
Dis
cussion
P
a
per
|
Discussion
P
a
per
|
Discussio
n
P
a
per
|
at 2% CH3F (Fig. 1), except in OMB where it was already reached at 1% CH3F (Fig. 1).
By contrast, maximum inhibition of CO2production was already reached at 0.5% CH3F.
However, CO2production was generally much less inhibited than CH4production
(Ta-ble 1). The concentration of acetate was also highest in MES (Ta(Ta-ble 1). Those in OLI and OMB were at least one order of magnitude lower. Inhibition of acetoclastic
5
methanogenesis should result in accumulation of acetate. Indeed acetate accumulated in MES, on the average to about 3-fold higher concentrations. However, in OLI and
OMB acetate accumulated only marginally (Table 1). In MES, caproate (<700 µM),
pro-pionate (<500 µM), butyrate (<200 µM), isopropanol (<100 µM) and valerate (<60 µM)
also accumulated, but in OLI and OMB accumulation of these compounds was mostly
10
not detectable.
Theδ13C of the organic matter of the peat samples was similar in the different peat
ecosystems, ranging between −27.4‰ and −26.5‰ (Table 1). An effect of CH3F on
theδ13C of acetate could not be discerned. Therefore, all acetate data were averaged.
Theδ13C of the averaged acetate in OMB and OLI was only by 2‰ and 5‰ larger than
15
that of Corg. However, that of MES was by almost 9‰ larger than that of Corg.
Theδ13C of CO2was relatively constant with incubation time (Fig. 1). It was similar
for MES and OLI (i.e., about−17‰) but was larger for OMB (−11‰) (Table 1). Addition
of CH3F had only a slight effect on δ
13
CCO2, decreasing the values by a few permil
only (Fig. 1). However, theδ13C of CO2were generally much higher (on average 15‰)
20
than those of Corg, (on average−27‰) indicating that CO2 was fractionated during its
further conversion to CH4. Such fractionation was apparent since the δ
13
C of CH4
was quite negative with values around −58‰ in MES, −66‰ in OMB and −89‰ in
OLI (Fig. 1, Table 1). Since CH4 can be produced from both hydrogenotrophic and
acetoclastic pathways, the latter was inhibited by addition of CH3F so thatδ
13
C of CH4
25
was only affected by CO2 reduction. Under these conditions, δ13CCH
4 indeed further
decreased already at the lowest CH3F concentration (Fig. 1). Interestingly, addition of
CH3F resulted only a comparatively small decrease ofδ
13
BGD
7, 5497–5515, 2010Carbon isotope fractionation in methanogenic
peatlands
P. E. Galand et al.
Title Page
Abstract Introduction
Conclusions References
Tables Figures
◭ ◮
◭ ◮
Back Close
Full Screen / Esc
Printer-friendly Version Interactive Discussion
Discussion
P
a
per
|
Dis
cussion
P
a
per
|
Discussion
P
a
per
|
Discussio
n
P
a
per
|
and OLI, indicating that acetoclastic methanogenesis did not contribute much to CH4
production in these peat ecosystems.
Assuming that any acetoclastic methanogenesis was inhibited completely by the
presence of CH3F, it is possible to calculate the fractionation factor of hydrogenotrophic
methanogenesis (αCO2,CH4 or εCO2,CH4) from the difference between the δ13CCH4
5
in the absence and the presence of CH3F. The fractionation factor was largest in
OLI>MES>OMB, i.e.,εCO2,CH4 ranging between−78.5‰ and−66.8‰ (Table 1).
The fraction (fCO2,CH4) of hydrogenotrophically produced CH4to total CH4production
was calculated from Eq. (4). The calculation assumed that theδ13C of
hydrogenotroph-ically produced CH4(δ
13
CCH4-CO2) was identical to theδ
13
CCH4 measured in the
pres-10
ence of CH3F, when acetoclastic methanogenesis was inhibited and CH4 was
exclu-sively produced from H2/CO2. The calculation further assumed that the δ
13
C of
ace-toclastically produced CH4(δ
13
CCH4-ac) was similar toδ
13
Corg. Previous studies have
found that theδ13C of the acetate-methyl from which CH4 is formed is less than 9‰
smaller thanδ13Corg (Conrad et al., 2007, 2009a, b, 2010b). In OMB and OLI acetate
15
concentrations were so low that acetate was probably utilized as it was produced so that there was no further carbon isotope fractionation during the conversion of
acetate-methyl to CH4. In MES, acetate concentrations were larger, so that further fractionation
is feasible. This fractionation should be on the order of less than 10‰ as typical for
Methanosaeta (Valentine et al., 2004; Penning et al., 2006), which was the
prevail-20
ing acetoclastic methanogen in MES (Juottonen et al., 2005; Galand et al., 2005).
Therefore, we assumed values ofδ13CCH4-ac being 5–10‰ smaller thanδ
13
Corg. The
resulting fCO2,CH4 showed that CH4 production in MES was predominantly by
aceto-clastic methanogenesis, whereas CH4 production in OMB and even more in OLI was
predominately due to hydrogenotrophic methanogenesis.
BGD
7, 5497–5515, 2010Carbon isotope fractionation in methanogenic
peatlands
P. E. Galand et al.
Title Page
Abstract Introduction
Conclusions References
Tables Figures
◭ ◮
◭ ◮
Back Close
Full Screen / Esc
Printer-friendly Version Interactive Discussion
Discussion
P
a
per
|
Dis
cussion
P
a
per
|
Discussion
P
a
per
|
Discussio
n
P
a
per
|
4 Discussion
Our study demonstrated that different peatlands in Finland exhibited different carbon
isotope fractionation during degradation of organic matter under anaerobic conditions.
These differences were obvious from the fact that while δ13C values of organic
mat-ter, the primary substrate, were similar (−27 to−26‰) in all three peatlands, theδ13C
5
values of CH4, the end product of degradation, were quite different. Rates of organic
matter degradation, as shown by CH4 and CO2 production, and concentrations of the
degradation intermediate acetate were also quite different among the three peatlands.
The differences in stable carbon isotope fractionation were explained by different paths
of organic matter degradation and different prevalence of the acetoclastic versus
hy-10
drogenotrophic methanogenesis.
Production rates of CH4and CO2were highest in peat from a mesotrophic fen (MES).
The rates in the other peat samples were less than 25% of those in MES. Rates were slightly higher in peat from the ombrotrophic bog (OMB) than the oligotrophic fen (OLI). Methanogenic degradation of organic matter normally expects the production of
15
equimolar amounts of CH4 and CO2. In OLI and OMB, the rates of CO2 production
were higher than those of CH4production. The rates of CO2production only consider
the gaseous CO2 measured in the headspace of the incubation vessels. While
bicar-bonate concentrations were negligible in the acidic peat samples, the concentrations
of dissolved CO2as calculated from Henry’s law (Stumm and Morgan, 1981) were not
20
negligible. Thus, rates of total CO2 production (gaseous plus dissolved CO2) were
about 50% higher than those of gaseous CO2alone. Hence, only MES produced CH4
and CO2in the expected equimolar amounts, while OMB and OLI produced much more
CO2 than CH4. Such imbalance has frequently been observed in methanogenic peat
samples, and has even been observed when great care was taken that potential
in-25
BGD
7, 5497–5515, 2010Carbon isotope fractionation in methanogenic
peatlands
P. E. Galand et al.
Title Page
Abstract Introduction
Conclusions References
Tables Figures
◭ ◮
◭ ◮
Back Close
Full Screen / Esc
Printer-friendly Version Interactive Discussion
Discussion
P
a
per
|
Dis
cussion
P
a
per
|
Discussion
P
a
per
|
Discussio
n
P
a
per
|
degradation of organic matter, e.g. certain humic compounds that are reduced while
others are concomitantly oxidized to CO2 (Heitmann et al., 2007; Keller et al., 2009).
Based on our observations, we hypothesize that organic oxidants are more important in the more oligotrophic than the mesotrophic peatlands.
The mesotrophic peat (MES) also exhibited much higher (more than 10 times)
ac-5
etate concentrations at the end of incubation than the oligotrophic peat samples (OMB, OLI). These acetate concentrations were further increased when acetoclastic
methano-genesis, the only conceivable acetate degradation process, was inhibited by CH3F. This
stimulation was again more strongly expressed in MES than in OMB or OLI. Hence, MES behaved as expected for an environment in which organic matter is first fermented
10
to acetate as the major fermentation product. Interestingly, MES also contained other potential fermentation products, i.e., caproate, propionate, butyrate, isopropanol, and valerate, albeit at much lower concentrations than acetate. Such compounds are fre-quently observed in methanogenic lake sediments or flooded soils (Lovley and Klug, 1982; Phelps and Zeikus, 1985; Chin and Conrad, 1995), but were not detected in
15
OMB and OLI. There, acetate and other fermentation products seemed to play a com-paratively minor role in the degradation of organic matter.
If degradation produces only little acetate, then acetoclastic methanogenesis should
be comparatively less important for CH4 production, which would predominantly be
formed by CO2 reduction. Indeed, isotopic mass balance calculations indicate that
20
CH4production in OMB and OLI was mainly due to hydrogenotrophic methanogenesis
accounting for more than 75% of total CH4 production. In MES, on the other hand,
CH4 was mainly (about 54–59%) produced by acetoclastic methanogenesis. These
data are consistent with an earlier study in which the percentage contribution of hy-drogenotrophic versus acetoclastic methanogenesis was determined by measuring the
25
conversion of14C-labelled bicarbonate to CH4(Galand et al., 2005). Theoretically, one
would expect that >66% of the CH4 is produced by acetoclastic methanogenesis, if
BGD
7, 5497–5515, 2010Carbon isotope fractionation in methanogenic
peatlands
P. E. Galand et al.
Title Page
Abstract Introduction
Conclusions References
Tables Figures
◭ ◮
◭ ◮
Back Close
Full Screen / Esc
Printer-friendly Version Interactive Discussion
Discussion
P
a
per
|
Dis
cussion
P
a
per
|
Discussion
P
a
per
|
Discussio
n
P
a
per
|
organic matter is degraded in a non-canonical way. We assume that in peatlands or-ganic substances are only partially degraded rather than completely. This speculation is consistent with recent studies in lake sediments (Conrad et al., 2009a; Conrad et al., 2010b), in particular with a study in the sediment of an acidic bog lake (Conrad et al., 2010a). Thus the complete degradation of an organic substance, e.g.,
5
C6H12O6+2 H2O→2 CH3COOH+2 CO2+4 H2 (7)
2 CH3COOH→2 CH4+2 CO2 (8)
4 H2+CO2→CH4+2 H2O (9)
net : C6H12O6→3 CO2+3 CH4 (10)
would contrast with incomplete degradation of an organic substance, e.g.,
10
C6H12O6+2 H2O→C4H8O4+2 CO2+4 H2 (11)
4 H2+CO2→CH4+2 H2O (12)
net : C6H12O6→C4H8O4+CO2+CH4 (13)
and the oxidation of an organic substance by using other one as oxidant, e.g.
C6H12O6+C4H8O4+H2O→CO2+C5H10O4+C4H10O4 (14)
15
Our data concerningfCO2,CH4 and relative production rates of CH4 versus CO2 would
be consistent with organic matter in OMB and OLI being mainly degraded by processes Eqs. (13) and (14), while in MES being mainly degraded by process Eq. (10).
This interpretation is also consistent with the effect of CH3F, which showed the
strongest inhibition (18% residual activity) for CH4 production in MES, which was
pre-20
BGD
7, 5497–5515, 2010Carbon isotope fractionation in methanogenic
peatlands
P. E. Galand et al.
Title Page
Abstract Introduction
Conclusions References
Tables Figures
◭ ◮
◭ ◮
Back Close
Full Screen / Esc
Printer-friendly Version Interactive Discussion
Discussion
P
a
per
|
Dis
cussion
P
a
per
|
Discussion
P
a
per
|
Discussio
n
P
a
per
|
methanogenesis is more sensitive, hydrogenotrophic methanogenesis was found to be
also inhibited at increasing concentrations of CH3F (Conrad and Klose, 1999). Hence
the observed decrease of CH4 production with increasing CH3F (Fig. 1) is not
unex-pected. Acetoclastic methanogenesis was probably completely inhibited at 1% CH3F,
since values ofδ13CCH4did not decrease further when more CH3F was added (Fig. 1).
5
Only in MES, but not in OMB or OLI, did CH3F result in a strong decrease ofδ
13
CCH4.
A strong decrease is expected when most of the CH4 is produced by acetoclastic
methanogenesis, which exhibits a much lower fractionation factor (αac,CH4≈1.009–
1.025) (Valentine et al., 2004; Penning et al., 2006; Goevert and Conrad, 2009) than
hydrogenotrophic methanogenesis (as much asαCO2,CH4≈1.090) (Conrad, 2005;
Pen-10
ning et al., 2005). In OMB and even more so in OLI,δ13CCH
4exhibited very low values
already when CH3F was not applied and decreased only a bit further upon
applica-tion. In MES, on the other hand, δ13CCH4 decreased only in the presence of CH3F
to values comparable to those found in OLI and OMB (note that data in Table 1 are
from newly formed CH4). The isotopic fractionation factors determined were on the
or-15
der ofαCO2,CH4≈1.067–1.078, orεCO2,CH4≈ −78 to−67‰; Table 1). Partial inhibition
of hydrogenotrophic methanogenesis by CH3F is also consistent with the observation
that CO2 production was less inhibited by CH3F than CH4 production. Inhibition of
only acetoclastic methanogenesis would result in equal inhibition of CO2and CH4
pro-duction because of Eq. (8). Inhibition of process Eq. (12), however, would inhibit CO2
20
consumption and thus result in more net CO2production.
A previous study found that the MES, OLI and OMB peatlands can also be dis-tinguished on the basis of their methanogenic archaeal communities (Galand et al., 2005). Interestingly, the most abundant group of methanogens in MES was related
to putatively acetoclastic Methanosaeta spp. On the other hand, OMB had a
com-25
pletely different methanogenic community composition dominated by the Fen cluster
ofMethanomicrobiales,while OLI contained a more diverse community including
dif-ferent clades of the Fen Cluster and Rice Cluster I (nowMethanocellales(Sakai et al.,
BGD
7, 5497–5515, 2010Carbon isotope fractionation in methanogenic
peatlands
P. E. Galand et al.
Title Page
Abstract Introduction
Conclusions References
Tables Figures
◭ ◮
◭ ◮
Back Close
Full Screen / Esc
Printer-friendly Version Interactive Discussion
Discussion
P
a
per
|
Dis
cussion
P
a
per
|
Discussion
P
a
per
|
Discussio
n
P
a
per
|
the presence of different paths for organic matter degradation. Noteworthy, a second
study, found similar proportions of putatively acetoclastic Methanosaetaspp. in both
OLI and MES (Juottonen et al., 2005). That study was, however, done later during the year (October vs. August).
In summary, our experiments showed that methanogenesis in peatlands was driven
5
by two fundamentally different processes. Canonical fermentation followed by
ace-toclastic and hydrogenotrophic methanogenesis was a major process only in the mesotrophic fen. In the oligotrophic peat, however, organic matter was apparently
de-graded to a large extent by a different path which finally involved hydrogenotrophic
methanogenesis as the major process while acetate formation and acetoclastic
10
methanogenesis played only a minor role. The exact path of methanogenesis in such oligotrophic peatlands is not completely clear, but probably involves incomplete
degra-dation of organic substances and use of organic compounds as oxidants so that CO2
rather than CH4is the major degradation product.
Acknowledgements. We thank Eeva-Stiina Tuittila and Jukka Laine (Forest Ecology, Helsinki,
15
Finland) for their advice and support with sample taking and Melanie Klose (MPI Marburg) for giving technical instructions during the tracer and inhibition experiments. Pierre Galand’s work was funded by the Academy of Finland and by a FEMS fellowship.
References
Avery, G. B., Shannon, R. D., White, J. R., Martens, C. S., and Alperin, M. J.: Effect of seasonal
20
changes in the pathways of methanogenesis on theδ13C values of pore water methane in a Michigan peatland, Global Biogeochem. Cy., 13, 475–484, 1999.
Bartlett, K. B. and Harriss, R. C.: Review and assessment of methane emissions from wetlands, Chemosphere, 26, 261–320, 1993.
Chanton, J. P., Glaser, P. H., Chasar, L. S., et al.: Radiocarbon evidence for the importance
25
BGD
7, 5497–5515, 2010Carbon isotope fractionation in methanogenic
peatlands
P. E. Galand et al.
Title Page
Abstract Introduction
Conclusions References
Tables Figures
◭ ◮
◭ ◮
Back Close
Full Screen / Esc
Printer-friendly Version Interactive Discussion
Discussion
P
a
per
|
Dis
cussion
P
a
per
|
Discussion
P
a
per
|
Discussio
n
P
a
per
|
Chasar, L. S., Chanton, J. P., Glaser, P. H., Siegel, D. I., and Rivers, J. S.: Radiocarbon and stable carbon isotopic evidence for transport and transformation of dissolved organic carbon, dissolved inorganic carbon, and CH4in a northern Minnesota peatland, Global Biogeochem. Cy., 14, 1095–1108, 2000.
Chin, K. J. and Conrad, R.: Intermediary metabolism in methanogenic paddy soil and the
5
influence of temperature, FEMS Microbiol. Ecol., 18, 85–102, 1995.
Conrad, R.: Contribution of hydrogen to methane production and control of hydrogen concen-trations in methanogenic soils and sediments [review], FEMS Microbiol. Ecol., 28, 193–202, 1999.
Conrad, R.: Quantification of methanogenic pathways using stable carbon isotopic signatures:
10
a review and a proposal, Org. Geochem., 36, 739–752, 2005.
Conrad, R. and Klose, M.: How specific is the inhibition by methyl fluoride of acetoclastic methanogenesis in anoxic rice field soil?, FEMS Microbiol. Ecol., 30, 47–56, 1999.
Conrad, R., Chan, O. C., Claus, P., and Casper, P.: Characterization of methanogenicArchaea and stable isotope fractionation during methane production in the profundal sediment of an
15
oligotrophic lake (Lake Stechlin, Germany), Limnol. Oceanogr., 52, 1393–1406, 2007. Conrad, R., Claus, P., and Casper, P.: Characterization of stable isotope fractionation during
methane production in the sediment of a eutrophic lake, Lake Dagow, Germany, Limnol. Oceanogr., 54, 457–471, 2009a.
Conrad, R., Klose, M., Claus, P., and Dan, J.: Activity and composition of the methanogenic
20
archaeal community in soil vegetated with wild rice versus cultivated rice, Soil Biol. Biochem. 41, 1390–1395, 2009b.
Conrad, R., Claus, P., and Casper, P.: Stable isotope fractionation during the methanogenic degradation of organic matter in the sediment of an acidic bog lake, Lake Grosse Fuchskuhle, Limnol. Oceanogr., doi:10.4319/lo.2010.55.5.0000, in press, 2010a.
25
Conrad, R., Klose, M., Claus, P., and Enrich-Prast, A.: Methanogenic pathway, 13C isotope fractionation, and archaeal community composition in the sediment of two clearwater lakes of Amazonia, Limnol. Oceanogr., 55, 689–702, 2010b.
Duddleston, K. N., Kinney, M. A., Kiene, R. P., and Hinesm, M. E.: Anaerobic microbial bio-geochemistry in a northern bog: Acetate as a dominant metabolic end product, Global
Bio-30
BGD
7, 5497–5515, 2010Carbon isotope fractionation in methanogenic
peatlands
P. E. Galand et al.
Title Page
Abstract Introduction
Conclusions References
Tables Figures
◭ ◮
◭ ◮
Back Close
Full Screen / Esc
Printer-friendly Version Interactive Discussion
Discussion
P
a
per
|
Dis
cussion
P
a
per
|
Discussion
P
a
per
|
Discussio
n
P
a
per
|
Galand, P. E., Fritze, H., Conrad, R., and Yrj ¨al ¨a, K.: Pathways for methanogenesis and diversity of methanogenic archaea in three boreal peatland ecosystems, Appl. Environ. Microbiol., 71, 2195–2198, 2005.
Galand, P. E., Saarnio, S., Fritze, H., and Yrj ¨al ¨a, K.: Depth related diversity of methanogen Archaeain Finnish oligotrophic fen, FEMS Microbiol. Ecol., 42, 441–449, 2002.
5
Goevert, D. and Conrad, R.: Effect of substrate concentration on carbon isotope fractionation during acetoclastic methanogenesis byMethanosarcina barkeri andM. acetivorans and in rice field soil, Appl. Environ. Microbiol., 75, 2605–2612, 2009.
Gorham, E.: Northern peatlands – Role in the carbon cycle and probable responses to climatic warming, Ecol. Applications, 1, 182–195, 1991.
10
Hayes, J. M.: Factors controlling13C contents of sedimentary organic compounds: principles and evidence, Mar. Geol., 113, 111–125, 1993.
Heitmann, T., Goldhammer, T., Beer, J., and Blodau, C.: Electron transfer of dissolved organic matter and its potential significance for anaerobic respiration in a northern bog, Glob. Change Biol., 13, 1771–1785, 2007.
15
Hines, M. E., Duddleston, K. N., Rooney-Varga, J. N., Fields, D., and Chanton, J. P.: Uncou-pling of acetate degradation from methane formation in Alaskan wetlands: connections to vegetation distribution, Global Biogeochem. Cy., 22, GB2017, doi:10.1029/2006GB002903, 2008.
Horn, M. A., Matthies, C., K ¨usel, K., Schramm, A., and Drake, H. L.: Hydrogenotrophic
20
methanogenesis by moderately acid-tolerant methanogens of a methane-emitting acidic peat, Appl. Environ. Microbiol., 69, 74–83, 2003.
Hornibrook, E. R. C., Longstaffe, F. J., and Fyfe, W. S.: Evolution of stable carbon isotope compositions for methane and carbon dioxide in freshwater wetlands and other anaerobic environments, Geochim. Cosmochim. Acta, 64, 1013–1027, 2000.
25
Juottonen, H., Galand, P. E., Tuittila, E. S., Laine, J., Fritze, H., and Yrj ¨al ¨a, K.: Methanogen communities and Bacteria along an ecohydrological gradient in a northern raised bog com-plex, Environ. Microbiol., 7, 1547–1557, 2005.
Keller, J. K., Weisenhorn, P. B., and Megonigal, J. P.: Humic acids as electron acceptors in wetland decomposition, Soil Biol. Biochem., 41, 1518–1522, 2009.
30
BGD
7, 5497–5515, 2010Carbon isotope fractionation in methanogenic
peatlands
P. E. Galand et al.
Title Page
Abstract Introduction
Conclusions References
Tables Figures
◭ ◮
◭ ◮
Back Close
Full Screen / Esc
Printer-friendly Version Interactive Discussion
Discussion
P
a
per
|
Dis
cussion
P
a
per
|
Discussion
P
a
per
|
Discussio
n
P
a
per
|
Kotsyurbenko, O. R., Chin, K. J. , Glagolev, M. V., et al.: Acetoclastic and hydrogenotrophic methane production and methanogenic populations in an acidic West-Siberian peat bog. Environ. Microbiol., 6, 1159–1173, 2004.
Kotsyurbenko, O. R., Friedrich, M. W. , Simankova, M. V., et al.: Shift from acetoclastic to H2 -dependent methanogenesis in a West Siberian peat bog at low pH values and isolation of an
5
acidophilicMethanobacteriumstrain, Appl. Environ. Microbiol., 73, 2344–2348, 2007. Krumb ¨ock, M. and Conrad, R.: Metabolism of position-labelled glucose in anoxic methanogenic
paddy soil and lake sediment, FEMS Microbiol. Ecol., 85, 247–256, 1991.
Lansdown, J. M., Quay, P. D., and King, S. L.: CH4production via CO2reduction in a temperate bog: a source of13C-depleted CH4, Geochim. Cosmochim. Acta, 56, 3493–3503, 1992.
10
Lovley, D. R., Klug, M. J.: Intermediary metabolism of organic matter in the sediments of a eutrophic lake, Appl. Environ. Microbiol., 43, 552–560, 1982.
Matthews, E. and Fung, I.: Methane emission from natural wetlands: Global distribution, area, and environmental characteristics of sources, Global Biogeochem. Cy., 1, 61–86, 1987. Metje, M. and Frenzel, P.: Effect of temperature on anaerobic ethanol oxidation and
methano-15
genesis in acidic peat from a northern wetland, Appl. Environ. Microbiol., 71, 8191–8200, 2005.
Metje, M. and Frenzel, P.: Methanogenesis and methanogenic pathways in a peat from subarc-tic permafrost, Environ. Microbiol. 9, 954–964, 2007.
Nakagawa, F., Yoshida, N., Nojiri, Y., and Makarov, V. N.: Production of methane from alasses
20
in eastern Siberia: implications from its14C and stable isotopic compositions, Global Bio-geochem. Cy., 16, 14-1–14-15, doi:10.1029/2000GB001384, 2002.
Penning, H., Claus, P., Casper, P., and Conrad, R.: Carbon isotope fractionation during ace-toclastic methanogenesis by Methanosaeta concilii in culture and a lake sediment, Appl. Environ. Microbiol., 72, 5648–5652, 2006.
25
Penning, H., Plugge, C. M., Galand, P. E., and Conrad, R.: Variation of carbon isotope frac-tionation in hydrogenotrophic methanogenic microbial cultures and environmental samples at different energy status, Glob. Change Biol., 11, 2103–2113, 2005.
Phelps, T. J. and Zeikus, J. G.: Effect of fall turnover on terminal carbon metabolism in Lake Mendota sediments, Appl. Environ. Microbiol., 50, 1285–1291, 1985.
30
BGD
7, 5497–5515, 2010Carbon isotope fractionation in methanogenic
peatlands
P. E. Galand et al.
Title Page
Abstract Introduction
Conclusions References
Tables Figures
◭ ◮
◭ ◮
Back Close
Full Screen / Esc
Printer-friendly Version Interactive Discussion
Discussion
P
a
per
|
Dis
cussion
P
a
per
|
Discussion
P
a
per
|
Discussio
n
P
a
per
|
Prater, J. L., Chanton, J. P., and Whiting, G. J.: Variation in methane production pathways associated with permafrost decomposition in collapse scar bogs of Alberta, Canada, Global Biogeochem. Cy., 21, GB4004, doi:10.1029/2006GB002866, 2007.
Rooney-Varga, J. N., Giewat, M. W., Duddleston, K. N., Chanton, J. P., and Hines, M. E.: Links between archaeal community structure, vegetation type and methanogenic pathway in
5
Alaskan peatlands, FEMS Microbiol. Ecol., 60, 240–251, 2007.
Sakai, S., Imachi, H., Hanada, S., Ohashi, A., Harada, H., and Kamagata, Y.: Methanocella paludicolagen. nov., sp. nov., a methane-producing archaeon, the first isolate of the lineage ’Rice Cluster I’, and proposal of the new archaeal order Methanocellales ord. nov., Int. J. Syst. Evol. Microbiol., 58, 929–936, 2008.
10
Steinmann, P., Eilrich, B., Leuenberger, M., and Burns, S. J.: Stable carbon isotope compo-sition and concentrations of CO2 and CH4 in the deep catotelm of a peat bog, Geochim. Cosmochim. Ac., 72, 6015–6026, 2008.
Stumm, W. and Morgan, J. J.: Aquatic Chemistry. An Introduction Emphasizing Chemical Equi-libria in Natural Waters, Wiley, New York, 1981.
15
Valentine, D. L., Chidthaisong, A., Rice, A., Reeburgh, W. S., and Tyler, S. C.: Carbon and hydrogen isotope fractionation by moderately thermophilic methanogens, Geochim. Cos-mochim. Ac., 68, 1571–1590, 2004.
Whiticar, M. J., Faber, E., and Schoell, M.: Biogenic methane formation in marine and fresh-water environments: CO2reduction vs. acetate fermentation – isotopic evidence, Geochim.
20
Cosmochim. Ac., 50, 693–709, 1986.
Yavitt, J. B. and Seidmann-Zager, M.: Methanogenic conditions in northern peat soils, Geomi-crobiol. J., 23, 119–127, 2006.
Zinder, S. H.: Physiological ecology of methanogens. In: Ferry JG (Ed) Methanogenesis. Ecol-ogy, PhysiolEcol-ogy, Biochemistry and Genetics, pp. 128–206, Chapman & Hall, New York, 1993.
BGD
7, 5497–5515, 2010Carbon isotope fractionation in methanogenic
peatlands
P. E. Galand et al.
Title Page
Abstract Introduction
Conclusions References
Tables Figures
◭ ◮
◭ ◮
Back Close
Full Screen / Esc
Printer-friendly Version Interactive Discussion
Discussion
P
a
per
|
Dis
cussion
P
a
per
|
Discussion
P
a
per
|
Discussio
n
P
a
per
|
Table 1.Production rates of CH4and CO2, concentrations of acetate, values ofδ13C, isotopic enrichment factors and fractions of CH4 produced from CO2 in samples from different boreal peatland ecosystems, i.e., mesotrophic fen (MES), oligotrophic fen (OLI), and ombrotrophic bog (OMB).
Variables MES peat OLI peat OMB peat
pH 5.3±0.1 5.2±0.1 3.9±0.2
CH4production (nmol h−1
gdw−1
) 210±77 15±4 40±13
CH4production (nmol h−1
gdw−1
), 38±7 (18%) 4.2±4.2 (28%) 14.6±3.3 (36%)
+2% CH3F
CO2production (nmol h−1gdw−1) 167±99 29±2 45±6 CO2production (nmol h−1
gdw−1
), 113±5 (68%) 25±1 (86%) 27±1 (60%)
+2% CH3F
Acetate (µM) 800±490 85±25 30±20
Acetate (µM),+2% CH3F 2420±1290 125±125 50±10
δ13Corg(‰) −27.3±0.1 −27.4±0.1 −26.5±0.2
δ13Cac(‰),±0.5-2% CH3F −18.8±1.3 −22.3±0.6 −24.3±1.4
δ13CCH
4(‰) −58.4±0.9 −88.9±4.8 −65.6±3.7 δ13CCH
4(‰),+2% CH3F −78.8±0.3 −86.4±25.0 −73.1±9.6 δ13CCO
2(‰) −16.8±0.2 −16.9±0.3 −11.5±0.4 εCO2,CH4 (‰) −72.6±7.3 −78.5±29.3 −66.8±11.2 fCO2,CH4(%), A
1
46±2 89±9 78±4
fCO2,CH4(%), B1 41±2 88±10 76±4
1f
CO2,CH4was calculated using Eq. (4) assuming
(A)δ13CCH
4-ac=δ 13
Corg−5, and (B)δ13CCH
4-ac=δ 13
BGD
7, 5497–5515, 2010Carbon isotope fractionation in methanogenic
peatlands
P. E. Galand et al.
Title Page Abstract Introduction Conclusions References Tables Figures ◭ ◮ ◭ ◮ Back Close
Full Screen / Esc
Printer-friendly Version Interactive Discussion Discussion P a per | Dis cussion P a per | Discussion P a per | Discussio n P a per |
0 2 4 6 8 10 12 14 16 18 20 22 0 1 2 3 4 5
0 2 4 6 8 10 12 14 16 18 20 22 -100 -90 -80 -70 -60 -50 -40 -30 -20 -10 CH 4 (k P a ) Time (days) uninhibited + 0.5% CH3F
+ 1.0% CH3F
+ 2.0% CH3F
CO2
CH4 MES peat, Finland, 2003
Time (days) 13C ( p ermil)
0 2 4 6 8 10 12 14 16 18 20 22 0.00 0.05 0.10 0.15 0.20 0.25 0.30 0.35 0.40
0 2 4 6 8 10 12 14 16 18 20 22 -100 -90 -80 -70 -60 -50 -40 -30 -20 -10 CH 4 (k P a ) Time (days) uninhibited + 0.5% CH3F
+ 1.0% CH3F
+ 2.0% CH3F
CO2
CH4 OLI peat, Finland, 2003
Time (days) 13C ( p ermil)
0 2 4 6 8 10 12 14 16 18 20 22 0.0 0.1 0.2 0.3 0.4 0.5 0.6 0.7 0.8
0 2 4 6 8 10 12 14 16 18 20 22 -100 -90 -80 -70 -60 -50 -40 -30 -20 -10 CH 4 (k P a ) Time (days) uninhibited + 0.5% CH3F
+ 1.0% CH3F
+ 2.0% CH3F
CO2
CH4 OMB peat, Finland, 2003
Time (days) 13C ( p ermil)
0 2 4 6 8 10 12 14 16 18 20 22 0.0 0.2 0.4 0.6 0.8 1.0 1.2 CO 2 (k P a ) Time (days) 0 2 4 6 8 10 12 14 16 18 20 22
0 1 2 3 4 5 CO 2 (k P a ) Time (days)
0 2 4 6 8 10 12 14 16 18 20 22 0.0 0.2 0.4 0.6 0.8 1.0 1.2 CO 2 (kP a ) Time (days)
Fig. 1.Time course of accumulation of CH4and CO2, and ofδ13C of the accumulated CH4and CO2in the absence and presence of different concetrations of CH3F, an inhibitor of acetoclastic methanogenesis (CH3F) using samples from three different peatland ecosystems in Finland, i.e., mesotrophic fen (MES), oligotrophic fen (OLI), and ombrotrophic bog (OMB); mean±SE,