Original Research Article doi: 10.12980/JCLM.3.2015J5-26 ©2015 by the Journal of Coastal Life Medicine. All rights reserved.
Water quality assessment of the Shatt al-Arab River, Southern Iraq
Mohammad Salim Moyel1*, Najah Aboud Hussain2
1
Department of Marine Environmental Chemistry, Marine Science Centre, Basrah University, Basra, Iraq
2
Department of Ecology, College of Science, Basrah University, Basra, Iraq
Journal of Coastal Life Medicine
*Corresponding author: Mohammad Salim Moyel, Department of Marine Environmental Chemistry, Marine Science Centre, Basrah University, Basra, Iraq. Tel: +9647707320699
E-mail: ms1977bio@yahoo.com
1. Introduction
Many countries are concerned with the presence, utilization, security and management of water resources. The assessment of water quality has become a sensitive issue, especially with an awareness that freshwater will be a scarce resource in the future[1,2]. Assessment parameters and criteria for monitoring water for various usages (protection of aquatic life preservation, contact recreation, potable water use, etc.) are generally well defined in various jurisdictions.
However, the overall water quality is sometimes difficult to evaluate due to large sample sizes and extensive analytical suites of parameters[3,4]. Although some monitored parameters could be analyzed either alone or grouped according to a common feature, such analysis provides partial information on the overall quality[1].
One of the most effective ways to report water quality trends to decision makers and the general public is used as indices[5]. Using water quality indices (WQIs) also help to assess changes in water quality[6] and facilitate comparison between different sampling sites and/or events[7]. WQI is a mechanism for presenting a cumulatively derived numerical expression defining a certain level of water quality[8] and summarizes large amounts of water quality data into simple terms (e.g., excellent, good, bad, etc.)[9]. Thus, it can be said that the use of a WQI in the operational management of river water quality can bridge the gap between water quality monitoring and reporting.
The climate change in recent years has a significant impact on the water quality of rivers of the world in terms of changing patterns of rainfall and increased evaporation rates as a result of high temperature, especially rivers located in arid and semi-arid zones, such as the Shatt al-Arab River, in Southern Iraq[10-12]. In general, surface water resources of Iraq (Tigris and Euphrates Rivers) and the Shatt al- Arab River have degraded and reduced over time due to low rainfall, temperature increases, increases in evaporation rate and the construction of dam’s on the upper reaches of riverine water resources.
A RT I C L E I N F O A B S T R AC T
Objective: To assess suitability of the water quality of Shatt al-Arab River for protection of aquatic life, potable water supply and irrigation uses.
Methods: The Shatt al-Arab River was monitored on a monthly basis from July 2009 to June 2010. A water quality index (WQI) was calculated to assess the suitability of water for protection of aquatic life, potable water supply and irrigation uses during the dry season from July to December 2009 and the wet season from January until June 2010.
Results: The results of the WQI showed that the lowest water quality values were scored during the dry season for all three uses of the river. Marginal water quality values were recorded for protection of aquatic life and fair (upstream) to poor (downstream) water quality values were recorded for irrigation uses. Moreover, the river water was not suitable for potable water supply without elaborate treatment.
Conclusions: Deterioration of the Shatt al-Arab water quality has been attributed to reduced freshwater discharges from Tigris and Euphrates Rivers, low annual precipitations and an advancing salt wedge from the Arabian Gulf. However, a combination of those factors such as low riverine discharge and advancing salt wedge with a continuous discharge of agriculture, oil industry and urban point effluent has polluted the waters and fostered the decline of the Shatt al-Arab River water quality during the study period. The study indicated that application of WQIs was a useful tool to monitor and assess the overall water quality of the Shatt al-Arab River.
Article history: Received 16 Mar 2015
Received in revised form 31 Mar, 2nd revised form 6 Apr 2015
Accepted 11 Apr 2015 Available online 7 May 2015
Keywords:
Water quality assessment Water quality index Shatt al-Arab River
The hydrological condition of the Shatt al-Arab River basin is affected by several factors including conditions at the upper reaches of the Tigris and Euphrates Rivers, the status of advancing flood tides from the Arabian Gulf, seepage of saline ground water into the basin, as well as the impact of climate conditions prevailing in the region on discharge rates and the payload of the river[13]. The discharge of moderately saline water from the East Hammar Marsh and limited precipitation exacerbates water quality and the hydrology of the region. These factors combined alter the basin hydrology through irregular input of riverine water[14].
The main objective of this study is to use a WQI as a simple tool to assess suitability of the water quality of Shatt al-arab River for protection of aquatic life, potable water supply and irrigation uses, during the dry season (DS) (July to December 2009) and the wet season (WS) (January to June 2010).
2. Materials and methods
2.1. Study site description
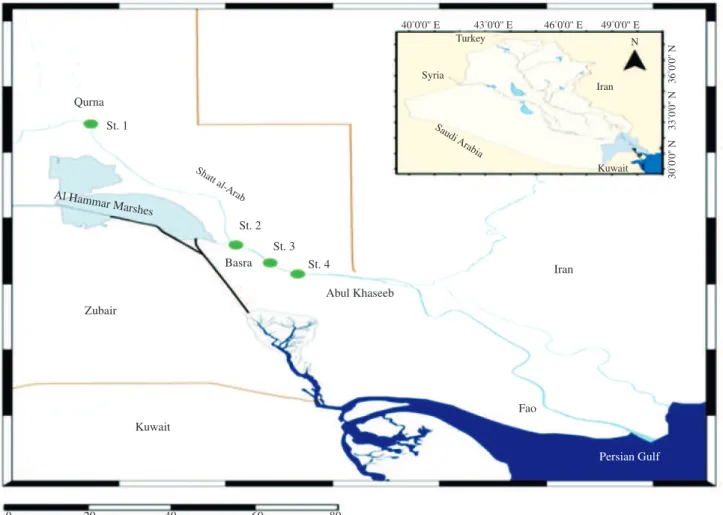
The confluence of Tigris and Euphrates Rivers at the town of Qurna, north of Basra City forms the Shatt al-Arab River, which flows to the south west to the Arabian Gulf. The Shatt al-Arab River has a length of 200 km, a width range between 400 m in Basra City and up to more than 2 km at the estuary and a depth between 8-15 m, considering tides[14,15]. Four stations were selected along the river axis in order to investigate water quality trends (Table 1 and Figure 1).
Table 1
Sampling locations and coordinates of sampling stations at Shatt al-Arab River.
Station number Station name Longitude Latitude St. 1 Qurna 47°28'49.33'' 30°58'52.55''
St. 2 Maqal 47°47'16.60'' 30°33'55.60''
St. 3 Ashar 47°51'30.92'' 30°30'12.77''
St. 4 Abul Khaseeb 47°55'35.35'' 30°28'4.65''
The Shatt al-Arab basin is located in the vicinity of Basra Governorate, which weather stations record extremely hot summer temperatures and cooler with some rain in the winter. Temperature ranges between 8.4 °C and 45 °C in the months of January and
August respectively[16,17].
2.2. Field sampling and analytical procedures
Water samples were collected on a monthly basis from July 2009 to June 2010 at each sampling station along the Shatt al-Arab River. Water samples collected for analysis of nutrient, major ion concentrations were filtered using Millipore filter paper (0.45 µm), were preserved and analyzed according to American Public Health Association[18]. Physical and chemical parameters including water temperature (WT), electrical conductivity (EC), and pH, were measured in situ using a Lovipond multi-meter model SensoDirect 150. Turbidity was determined in situ using a Lovipond TurbiDirect turbidity meter. Dissolved oxygen (DO) was determined by the Winkler method. Samples for biochemical oxygen demand after 5 days (BOD5) determinations were incubated
40°0'0'' E 43°0'0'' E 46°0'0'' E 49°0'0'' E
Turkey
Syria
Iran
Iran St. 4
St. 3 St. 2 St. 1
Qurna
Basra
Zubair
Abul Khaseeb
Kuwait
0 20 40 60 80
Fao
Persian Gulf
N
Kuwait
Saudi Arabia
Shatt al-Arab
Al Hammar Marshes
30
°0'0'' N 33 °0'0'' N 36 °0'0'' N
at 20°°C before the remaining DO determined by Winkler method.
Total hardness (TH) and concentrations of Ca+2and Mg+2 were measured by ethylenediaminetetraacetic acid complexometric titration. Na+ concentration was measured by flame photometry and Cl- concentration was measured by silver nitrate titration. Sulphate (SO4-2) concentration was determined specrophotometrically using the barium sulphate turbidity method. Boron (B-) concentration was determined by the curcumin method and sodium adsorption ratio (SAR) was calculated. Nitrate nitrogen (NO3-N) and orthophosphate phosphorus (PO4-P) concentrations were measured by cadmium reduction and molybdate ascorbic acid methods, respectively. Fecal coliform (FC) numbers were determined by membrane filtration method using fecal coliform agar base at 44.5 °C.
2.3. Application of
WQIThis study considered the WQI developed by the Canadian Council of Ministers of the Environment based on the formulation introduced by British Columbia Ministry of Environment. WQI of Canadian Council of Ministers of the Environment does not specify any water quality parameters or time period since the parameters vary by location and depend on the environmental conditions. At least four measurements of four parameters are required for the calculation of this index[19]. This WQI is comprised of three factors (ranging from 0 to 100) which test the levels of individual parameters against the guideline value or objective considered and describes the water quality from poor to excellent, as shown in Table 2[19].
Table 2
Water quality index categories.
WQI score 95-100 80-94 65-79 45-64 0-44
Water quality categories Excellent Good Fair Marginal Poor
Seventeen parameters were used in the WQI calculation at the four monitoring stations for the water quality based on the protection of aquatic life, potable water supply and irrigation purposes (Table 3). Ten parameters (WT, EC, turbidity, pH, DO, BOD5, TH, NO3-N, PO4-P and FC) were chosen to assess the quality of the Shatt al-Arab River for protection of aquatic life; thirteen parameters (EC, turbidity, pH, DO, BOD5, TH, NO3-N, SO4-2, Cl-, Na+, Ca+2, Mg+2 and FC) were
selected to assess the quality of the river for potable water supply and six parameters (EC, pH, Cl-, B-, NO3-N and SAR) were used to assess the quality of the river for irrigation purposes (Table 3).
Table 3
Water quality parameters and comparative guidelines.
Parameters Water uses
Aquatica
Potableb,c
Irrigationd
WT (°C) 10-35 NS NS
EC (mS/cm) 5 2.5b ˂
3
pH 6.5–8.5 6.5–8.5b 6.5–8.4
Turbidity (NTU) ˂ 45 ˂ 5b
NS
DO (mg/L) ˃ 5 ˃ 5c
NS
BOD5 (mg/L) ˂ 5 ˃ 3
b
NS
TH (mg/L) 500 500b
NS
Ca+2 (mg/L) NS ˂ 150c NS
Mg+2
(mg/L) NS ˂ 100c
NS Na+
(mg/L) NS ˂ 200c
NS Cl-
(mg/L) NS ˂ 350c ˂
145 SO4
-2
(mg/L) NS ˂ 500b NS
B-
(mg/L) NS NS ˂ 2
SAR (mg/L) NS NS ˂ 9
NO3-N (mg/L) ˂ 45 ˂ 10
b
5-30
PO4-P (mg/L) 0.04 NS NS
FC (CFU/100 mL) ˂ 100 0b
NS
a
: Iraqi standard for the protection general of water resources; b: World Health Organization (WHO) guideline recommended for drinking water; c
: Iraqi guideline recommended for drinking water; d: Food and Agriculture Organization standard for irrigation purpose; mS/cm: MilliSiemens per centimeter; NTU: Nephelometric turbidity unit; meq/L: Milliequivalent per liter; CFU: Colony forming unit; NS: Not specified.
The application of the WQI requires water quality guidelines or standards. Therefore, an appropriate guideline or standard for each water use was selected (Table 3). The Iraqi standard for the protection of general water resources (number 25, updated, 1980) was used to evaluate the Shatt al-Arab River for protection of aquatic life[20]. WHO[21] and Iraqi guidelines were used for potable water supply (number 417) (updated 2009)[22], and the Food and Agriculture Organization standards[23] were chosen to evaluate the river water for irrigation purposes (Table 3).
Table 4
Seasonal variation.
Parameters DS WS t df P
Range Mean ± SD Range Mean ± SD
°C 17.00-29.00 24.23 ± 4.56 13.00-29.80 21.8.00 ± 5.35 1.270 45.7 0.210
pH 7.48-8.57 7.98 ± 0.32 7.26-7.96 7.57 ± 0.18 4.156 36.2 0.003*
DO (mg/L) 5.80-9.00 7.30 ± 0.77 6.20-11.50 7.89 ± 1.27 -1.463 39.0 0.150
BOD5 (mg/L) 3.50-6.10 4.74 ± 0.62 2.20-5.70 4.51 ± 0.79 0.057 45.1 0.955
FC (CFU/100 mL) 2 210.00-6 700.00 4 411.00 ± 1 222.00 710.00-4 400.00 2 429.00 ± 1 023.00 3.668 40.8 0.001*
Turbidity (NTU) 10.10-39.30 22.64 ± 6.18 9.80-33.60 21.23 ± 6.85 0.639 45.7 0.526
Hardness (mg/L CaCO3) 1 400.00-2 600.00 1 876.00 ± 352.00 500.00-1 090.00 783.00 ± 136.00 5.534 25.1 0.000 *
EC (mS/cm) 3.90-18.45 11.07 ± 4.07 1.92-4.51 3.13 ± 0.60 5.112 23.6 0.000*
NO3 (µg/L) 15.98-88.50 53.75 ± 21.00 7.98-68.70 25.76 ± 15.00 3.895 42.8 0.006
*
PO4 (µg/L) 0.29-2.12 0.75 ± 0.59 0.01-0.32 0.15 ± 0.079 4.456 23.8 0.003
*
Cl
(mg/L) 597.00-5 937.00 2 843.00 ± 1 876.00 224.00-890.00 522.00 ± 162.00 4.251 23.3 0.005*
SO4 -2
(mg/L) 1 017.00-2 064.00 1 410.00 ± 198.00 752.00-1 209.00 1 007.00 ± 132.00 4.702 33.2 0.001*
Na+ (mg/L) 582.00-1 413.00 992.00 ± 230.00 208.00-613.00 395.00 ± 101.00 5.559 26.6 0.001* Ca+2
(mg/L) 140.00-621.00 351.30 ± 133.00 100.00-284.00 154.70 ± 45.00 4.464 27.4 0.001*
Mg+2
(mg/L) 54.00-481.00 242.70 ± 129.00 44.00-151.00 96.50 ± 27.00 3.218 43.9 0.003*
B
(mg/L) 0.43-2.64 1.61 ± 69.00 0.03-2.15 0.72 ± 0.61 3.218 43.9 0.002*
SAR (meq/L) 6.63-12.81 9.91 ± 1.64 3.59-8.53 6.10 ± 1.33 4.972 35.9 0.002*
*
9.0 8.5 8.0 7.5 7.0 6.5 6.0 10 8 6 4 2 0 1.0 0.8 0.6 0.4 0.2 0.0 80 60 40 20 0 10 8 6 4 2 0 2000 1500 1000 500 0 3000 2000 1000 0 400 300 200 100 0 50 40 30 20 10 0 2.0 1.5 1.0 0.5 0.0 1400 1200 1000 800 600 400 200 0 5000 4000 3000 2000 1000 0 1200 1000 800 600 400 200 0 20 15 10 5 0 400 300 200 100 0 14 12 10 8 6 4 2 0 pH
BOD (mg/L) PO
4 ( μ g/L ) NO 3 ( μg/L )
DO (mg/L) TH (mg/L)
CI
- (mg/L)
Ca
+2 (mg/L)
T
urbidity (NTU)
B
- (mg/L)
SO
4
-2 (mg/L)
FC (CFU/100 mL)
Na
+ (mg/L)
SAR (mg/L)
Mg
+2 (mg/L)
EC (mS/sec)
Figure 3. Spatial variation of the four stations along the axis of Shatt al-Arab River.
St. 1 St. 2 St. 3 St. 4 St. 1 St. 2 St. 3 St. 4 St. 1 St. 2 St. 3 St. 4 St. 1 St. 2 St. 3 St. 4
Figure 2. Seasonal variation of water quality parameters in the Shatt al-Arab River.
30 25 20 15 10 7000 6000 5000 4000 3000 2000 1000 0 40 30 20 10 0 90 80 70 60 50 40 30 20 10 0 2.5 2.0 1.5 1.0 0.5 0.0 6000 5000 4000 3000 2000 1000 0 2500 2000 1500 1000 500 1500 1000 500 0 700 600 500 400 300 200 100 0 500 400 300 200 100 0 3 2 1 0 15 10 5 0 7 6 5 4 3 2 20 15 10 5 0 9.0 8.5 8.0 7.5 7.0 12 11 10 9 8 7 6 5 3000 2000 1000 0 WT FC T urbidity NO 3 PO 4 Cl -SO 4 -2 Na + Ca +2 Mg +2 B -SAR BOD EC pH DO TH
16 12 8 4 0 4 8 12 16
25 20 15 10 5 0 5 10 15 20 25
20 15 10 5 0 5 10 15 20 30 20 10 0 10 20 30 30 20 10 0 10 20 30 16 12 8 4 0 4 8 12 16
16 12 8 4 0 4 8 12 16 40 30 20 10 0 10 20 30 40 20 15 10 5 0 5 10 15 20 1210 8 6 4 2 0 2 4 6 8 10 12 20 15 10 5 0 5 10 15 20 12 10 8 6 4 2 0 2 4 6 8 10 12 16 12 8 4 0 4 8 12 16 25 20 15 10 5 0 5 10 15 20 25
16 12 8 4 0 4 8 12 16 30 20 10 0 10 20 30 20 15 10 5 0 5 10 15 20 Count
Count
Count Count Count Count
Count Count Count Count Count
Count Count Count
Count Count Count
Count
Count
Count Count Count Count
Count Count Count Count Count
Count Count Count
Count Count Count
Season
Season
Season
Season Season Season Season Season
Season Season Season
Season Season
Season Season
Dry
Dry
Dry
Dry Dry Dry Dry Dry
Dry Dry Dry
Dry Dry
Dry Dry
Wet
Wet
Wet
Wet Wet Wet Wet Wet
Wet Wet Wet
3. Results
3.1. Environmental parameters
The basic statistical seasonal variations for the water quality parameters are summarized in Table 4 and illustrated in Figure 2. Generally, the mean concentrations of most analysed water quality parameters were significantly different in the DS and WS, with the exception of WT, BOD5, DO and turbidity.
Significant differences were observed between sampling locations for all parameters (except PO4-P) at the (P < 0.05). The mean concentrations of water quality parameters (except DO and turbidity) increased at downstream stations (Table 4 and Figure 3).
3.2.
WQIThe WQIs calculated during the study period for the four studied stations are represented in Table 5. The WQI score values for aquatic life during the DS and annually at the stations Qurna, Maqal, Ashar and Abul Khaseeb showed that the water was ranked as marginal at Qurna and Maqal stations, and poor at the other stations. Relatively better WQI score values were obtained during the WS and water at all stations was ranked as marginal (Table 5).
Table 5
WQI values and their categories for dry and wet seasons for the studied stations.
Study stations Seasons Aquatic Potable Irrigation WQI Categories WQI Categories WQI Categories Qurna Dry 58 Marginal 23 Poor 63 Marginal
Wet 61 Marginal 24 Poor 83 Good Annual 57 Marginal 21 Poor 78 Fair Maqal Dry 49 Marginal 15 Poor 31 Poor
Wet 57 Marginal 17 Poor 62 Marginal Annual 50 Marginal 16 Poor 47 Marginal
Ashar Dry 41 Poor 13 Poor 27 Poor
Wet 51 Marginal 16 Poor 61 Marginal Annual 43 Poor 13 Poor 36 Poor Abul Khaseeb Dry 39 Poor 12 Poor 23 Poor Wet 52 Marginal 17 Poor 65 Fair Annual 42 Poor 14 Poor 28 Poor
WQI score values for potable water supply were ranked as poor at all stations for both DS and WS, as well as annually, mainly as a result of the concentrations of most parameters (except pH and DO) exceeded the permissible level recommended by WHO and Iraqi guidelines for drinking water (Table 3).
Irrigation WQI score values during the DS for the river at the Qurna was ranked as marginal however, Maqal, Ashar and Abul Khaseeb were ranked as poor. In the WS, values were significantly higher and accordingly they fell good (Qurna), marginal (Maqal and Ashar) and fair at Abul Khaseeb station (Table 5). The special variance in WQIs observed was supported by the analytical results of the selected physic-chemical and biological parameters (Table 3 and Table 5).
4. Discussion
Temperature is an important water quality parameter due to its influence on other parameters. Temperature affects the solubility and, consequently, the availability of gases such as oxygen in water[24]; it also affects the toxicity of some chemicals in water systems as well as the sensitivity of living organisms to toxic substances[25]. In this study, the variability in temperature values at the study locations
may have resulted from the weather condition at the time of study. The pH is an important parameter that determines the suitability of water for different purposes. The pH results show seasonal and spatial differences but for all. Stations fall within the acceptable range of 6.5 to 8.5; the average values tend to be slightly alkaline during the study period which is consistent with previous studies made on aquatic ecosystems in Southern Iraq[26-28].
DO is essential for aquatic life, as it is needed to keep organisms alive. The results showed decreasing DO concentrations in the DS at downstream stations. This is possibly a result of high consumption of DO by microorganisms to mineralize dissolved organic matter which release from urban and agricultural runoff, high temperatures especially during the summer (DS) or aeration in the water. These factors could have a negative impact on the level of DO concentrations in Shatt al-Arab River[14,16]. Our results showed that the DO concentrations did not decline below 5 mg/L for all stations during both the WS and DS which indicates good circulation of water and DO at acceptable levels.
BOD5 is a measure of the quantity of oxygen used by microorganisms in the oxidation of organic matter. The mean concentration of BOD5 in the Shatt al-Arab River was the highest during the DS, particularly at the Ashar and Abul Khaseeb stations, respectively. These two stations are impacted by heavily populated areas of Basra City and it is likely that high values of BOD5 in these stations indicate water pollution resulted from and sewage effluents discharged from Basra City, as well as industrial and agricultural activities.
Turbidity is widely considered as an important parameter for water quality assessment. Turbidity is a measure of suspended particles (inorganic and/or organic matters) in water systems and usually correlates significantly with microbial load; hence, high turbidity will more often than not support the growth of pathogens and increase the chances of infection[29]. Turbidity can also limit the growth of phytoplankton and macrophytes when light penetration within the water column is restricted. In this study, turbidity was generally slightly higher during the DS, which could be attributed to decrease river volume and increase pollutants. Although, the observed values were within acceptable limits by the Iraqi standard for the protection general water resources, exceeded the permissible level recommended by the WHO for drinking water.
subsequent decline of these parameters were observed during the WS when precipitation and increased discharge from the Tigris and Euphrates rivers occur, further limiting the influence of salt wedge front from Arabian Gulf. Furthermore, the volume and impact of runoff and discharges from anthropogenic activities in the region are higher in the downstream monitoring locations.
The nutrient content of water is an indication of the degree of sustainability of the system of primary production. Excess nutrients in the ecosystem may lead to diverse problems such as increase in the occurrence and extent of algal blooms, loss of oxygen, taste and odour problems, fish deaths and loss of biodiversity[31]. The concentrations of both NO3-N and PO4-P compounds were dramatically increased from upstream to downstream stations. Higher values were observed at stations Ashar and Abul Khaseeb respectively, which were impacted by the most heavily populated area of Basra City, indicating that the level of nutrient contamination at these stations was relatively significant due to domestic and industrial sewage. The same was concluded by other authors of Al Hejuje[28], Al-Amarah et al.[32] and Hameed and Aljorany[33]. Seasonally, higher nutrients concentrations were recorded during the DS, attributed to decreased water volumes from the Tigris, Euphrates and Karun Rivers which effectively were diluted nutrient concentrations in the main river basin[33].
Quantification of coliform and FC bacteria is one of the most widely used methods to test the quality of surface water[34]. The presence of FC indicates that the water may have been contaminated by fecal material of human or other warm blooded animals. Elevated FC is indicative of the presence of pathogenic organisms and limitation imposed even on recreational usageand complete restriction on potable uses[35]. In our study, excessively high FC numbers were observed at all monitoring stations. The FC counts increased at downstream stations and the vicinity of high human population density where sewage effluent discharges into the river are likely to increase. Seasonally, the highest values of FC were recorded during the DS which may represent favorable growth conditions in terms of elevated temperature and the presence of effluents discharges into the river.
The evaluation of overall water quality is not an easy task particularly when different criterias for different uses are applied[36]. Moreover, a large quantity of water samples analysed for many parameters is required to get a clear overall picture of the suitability of water for different purposes[37]. Therefore, use of a WQI approach for the Shatt al-Arab River in southern of Iraq is the purpose for providing a simple, meaningful method for expressing the results of several parameters in order to assess the water quality for different uses. The use of the WQI allows us to collect and integrate the information of several parameters into a single number allowing interpretation and simultaneous analysis of several water quality parameters.
Some results illustrated the fluctuation of WQI score values for protection of aquatic life along the stretch of Shatt al-Arab River throughout the study period. The present study showed that the overall water quality of Shatt al-Arab River was low, particularly during the DS, when WQI was ranked as marginal at Qurna and Maqal stations and poor at the other downstream stations. The lowest water quality status during the study period was linked which can be attributed to the in river with increase in WT, EC, turbidity, BOD5, TH, NO3-N, PO4-P, and FC and decrease in DO concentrations. Relatively better quality water was observed
during the WS marginal for all stations in which the category of WQI became marginal for all the stations. It can be attributed to the increased in river discharge and precipitation and decreased temperature resulting in the reduction of parameters including EC, BOD5, TH, NO3-N, PO4-P, FC and DO seen to increase.
Clear temporal and spatial variations in the irrigation WQI were observed which ranged between good and poor during the study period. The highest WQI for irrigation purposes was recorded at the Qurna station, the furthest upstream, which fell between marginal and good categories in DS and WS respectively. This station is located at upstream of Basra City, distanting from industrial activities to dens population centers and therefore receives fewer pollutants compared with the rest of the stations. As well as, it was less affected by the saline intrusions even in the DS when the impact of salt wedge water proliferated further upstream. The lowest value for irrigation WQI was recorded during DS at Abul Khaseeb station followed by the Ashar and Maqal stations respectively. The deterioration in the irrigation water quality of the Shatt al-Arab River especially during the DS can be attributed to the increase in concentrations of dissolved salts from the intrusion of marine salt wedge front of Arabian Gulf, the decrease of freshwater quality and quantity brought by Tigris and Euphrates inputs, and increases of anthropogenic discharges including industrial and agriculture discharges from Basra City and other towns situated on the axis of the river. These factors resulted increased values of EC, Cl, SAR, B and nitrate rendering the water unsuitable for irrigation purposes. Poor potable WQIs were observed at all stations along the river which were increased in salinity and other ions were much higher than the Iraqi and international permissible limit for human consummation beside high occurrence of fecal coliform colonies more than healthy excepted limit for potable purposes. Even more limiting was the massive FC contamination, magnitudes above the recommended limits for even recreational use. Various effluents, generated anthropogenically, especially in the vicinity of Ashar and Abul Khaseeb stations (downstream), including untreated domestic sewage discharge from Basra City, contribute substantially to the WQIs.
Noticeable decrease in freshwater amount from the sources at upper reaches of Tigris and Euphrates Rivers basin was observed during the study period, especially in September and October months. This study period was characterized by increased dryness and irregularity of the hydrological system. Severe seasonal fluctuations in water regime through DS and WS led to a significant difference in volumes and water payload of the Shatt al-Arab River. The seasonal patterns observed in the Shatt al-Arab River reflect the interaction between water discharge and climatic conditions which are further impacted by anthropogenic discharges. Low freshwater inputs during the hot DS can be the most important factors controlling the seasonal variation of parameters in the water, especially in those stations located downstream.
Conflict of interest statement
We declare that we have no conflict of interest.
Acknowledgments
References
[1] Pesce SF, Wunderlin DA. Use of water quality indices to verify the impact of Córdoba City (Argentina) on Suquía River. Water Res 2000;
34(11): 2915-26.
[2] Bonanno G, Lo Giudice R. Application of two quality indices as monitoring and management tools of rivers. Case study: the Imera Meridionale River, Italy. Environ Manage 2010; 45: 856-67.
[3] Almeida CA, Quintar S, González P, Mallea MA. Influence of urbanization and tourist activities on the water quality of the Potrero de los Funes River (San Luis-Argentina). Environ Monit Assess 2007; 133: 459-65.
[4] Al-Shujairi SOH. Develop and apply water quality index to evaluate water quality of Tigris and Euphrates Rivers in Iraq. Int J Mod Eng Res
2013; 3(4): 2119-26.
[5] Akkoyunlu A, Akiner ME. Pollution evaluation in streams using water
quality indices: a case study from Turkey’s Sapanca Lake Basin. Ecol
Indic 2012; 18: 501-11.
[6] Chapman D. Water quality assessment. London: Chapman and Hall; 1992, p. 585.
[7] Debels P, Figueroa R, Urrutia R, Barra R, Niell X. Evaluation of water quality in the Chillán River (Central Chile) using physicochemical parameters and a modified water quality index. Environ Monit Assess
2005; 110: 301-22.
[8] Bordalo AA, Teixeira R, Wiebe WJ. A water quality index applied to an international shared river basin: the case of the Douro River. Environ Manage 2006; 38: 910-20.
[9] Boyacioglu H. Utilization of the water quality index method as a classification tool. Environ Monit Assess 2010; 167: 115-24.
[10] Sato T, Kimura F, Kitoh A. Projection of global warming onto regional precipitation over Mongolia using a regional climate model. J Hydrol
2007; 333(1): 144-54.
[11] Altansukh O, Davaa G. Application of index analysis to evaluate the water quality of the Tuul River in Mongolia. J Water Resour Prot 2011;
3: 398-414.
[12] Al-Hamdani FZ. Water pollution in Iraq between disastrous border and no real solutions. A study. J Genet Environ Res Conserv 2013; 1(2): 111-8.
[13] Al-Mahmood HK. The monthly variations of discharge and effect that on a total dissolve suspended and salinity in Shatt al-Arab River (South of Iraq). Iraqi J Sci 2009; 50(3): 355-68.
[14] Moyel MS. Assessment of water quality of the Shatt al-Arab River, using multivariate statistical technique. Mesopotomia Environ J 2014; 1(1): 39-46.
[15] Abdulla SS. An investigation to river load of Shatt al-Arab in Basrah [dissertation]. Basrah: Marine Science Center, Basrah University; 1990. [16] Hussain NA, Al-Najar HH, Al-Saad HT, Yousif UH, Al-Saboonchi AA.
[Shatt al-Arab basic scientific studies]. Basrah: Marine Science Centre Publ; 1991, p. 391. Arabic.
[17] Al-Maliky J, Peterson A, Hassan WF, Callow N. Analysis of water quality and the impact of the salt wedge from the Arabian Gulf on the Shatt al-Arab River, Iraq [dissertation]. Brisbane: Queensland University; 2012. [18] American Public Health Association. Standard method for the
examination of water and wastewater. 21th ed. Washington, D.C.: American Public Health Association; 2005, p. 1193.
[19] Canadian Council of Ministers of the Environment. Canadian water quality guidelines for the protection of aquatic life. Canada: Canadian Council of Ministers of the Environment; 2001. [Online] Available from:
http://www.ccme.ca/files/Resources/calculators/WQI%20User’s%20
Manual%20(en).pdf [Accessed on 8th May, 2014]
[20] Ministry of Planning and Development Cooperation. [Maintenance of rivers and public water system from contamination No. (25) for the year 1967]. Baghdad: Ministry of Planning and Development Cooperation; 1980. Arabic.
[21] World Health Organization. Guidelines for drinking-water quality [electronic resource]: incorporating first addendum. Vol. 1, Recommendations. 3rd ed. Geneva: World Health Organization; 2008. [Online] Available from: www.who.int/water_sanitation_health/dwq/ gdwq3rev/en/ [Accessed on 1st October, 2014]
[22] Ministry of Planning and Development Cooperation. [Standard No. (417) for drinking water (second update 2009)]. Baghdad: Ministry of Planning and Development Cooperation; 2010. Arabic.
[23] Ayers RS, Westcot DW. Water for agriculture. Rome: Food and Agriculture Organization Irrigation and Drainage Paper (29 Rev.1); 1985. [24] Rubio-Arias H, Ochoa-Rivero JM, Quintana RM, Saucedo-Teran R,
Ortize-Delgado RC, Rey-Burciaga NI, et al. Development of water quality index (WQI) of an artificial aquatic ecosystem in Mexico. J Environ Prot 2013; 4: 1296-306.
[25] Dojlido JR, Best GA. Chemistry of water and water pollution. New York: Ellis Horwood Limited; 1993.
[26] Al-Mahmood HKH, Al-Shawi IJ, Al-Imarah FJ. Survey for the evaluation of physical-chemical parameters of Shatt al-Arab Water from (1974-2005). Basrah Mag Agric Sci 2008; 21: 433- 448.
[27] Al-Lami ORT. Some marine properties for Arabian Gulf on north part’s
hydrology of Shatt al-Arab riverbed [dissertation]. Basrah: University of Basrah; 2009.
[28] Al Hejuje MMK. Application of water quality and pollution indices to evaluate the water and sediments status of Shatt al-Arab River [dissertation]. Basrah: University of Basrah; 2014, p. 293.
[29] Obi CL, Momba MNB, Samie A, Igumbor JO, Green E, Musie E. Microbiological, physico-chemical and management parameters impinging on the efficiency of small water treatment plants in Limpopo and Mpumalanga Provinces of South Africa. Water South Africa 2007;
33(2): 229-37.
[30] Prathumratana L, Sthiannopkao S, Kim KW. The relationship of climatic and hydrological parameters to surface water quality in the lower Mekong River. Environ Int 2008; 34: 860-6.
[31] Varol M, Şen B. Assessment of nutrient and heavy metal contamination in surface water and sediments of the upper Tigris River, Turkey. Catena
2012; 92: 1-10.
[32] Al-Imarah FJM, Allaywi YJ, Monais FS. Monthly variations in the levels of nutrients and chlorophyll in Shatt al-Arab water. MarMesopotamia
2001; 16(1): 347-57.
[33] Hameed AH, Aljorany YH. Investigation on nutrient behavior along Shatt al-Arab River, Basra, Iraq. J Appl Sci Res 2011; 7(8): 1340-5.
[34] Valiela I, Alber M, LaMontagne M. Fecal coliform loadings and stocks in buttermilk bay, Massachusetts, USA, and management implications.
Environ Manage 1991; 15(5): 659-74.
[35] Said A, Stevens DK, Sehlke G. Environmental assessment an innovative index for evaluating water quality in streams. Environ Manage 2004; 34: 406-14.
[36] Bordalo AA, Nilsumranchit W, Chalermwat K. Water quality and uses of the Bangpakong River (Eastern Thailand). Water Res 2001; 35(15): 3635-42.