www.atmos-chem-phys.net/10/8881/2010/ doi:10.5194/acp-10-8881-2010
© Author(s) 2010. CC Attribution 3.0 License.
Atmospheric
Chemistry
and Physics
CO
2
and its correlation with CO at a rural site near Beijing:
implications for combustion efficiency in China
Y. Wang1, J. W. Munger2, S. Xu1, M. B. McElroy2, J. Hao1, C. P. Nielsen3, and H. Ma1
1Department of Environmental Science and Engineering and State Key Joint Laboratory of Environment Simulation and
Pollution, Tsinghua University, Beijing, China
2Department of Earth and Planetary Sciences and School of Engineering and Applied Sciences, Harvard University,
Cambridge, Massachusetts, USA
3Harvard China Project and School of Engineering and Applied Sciences, Harvard University, Cambridge, Massachusetts,
USA
Received: 20 April 2010 – Published in Atmos. Chem. Phys. Discuss.: 17 May 2010 Revised: 1 September 2010 – Accepted: 6 September 2010 – Published: 21 September 2010
Abstract. Although China has surpassed the United States as the world’s largest carbon dioxide emitter, in situ mea-surements of atmospheric CO2 have been sparse in China.
This paper analyzes hourly CO2and its correlation with CO
at Miyun, a rural site near Beijing, over a period of 51 months (Dec 2004 through Feb 2009). The CO2-CO correlation
anal-ysis evaluated separately for each hour of the day provides useful information with statistical significance even in the growing season. We found that the intercept, representing the initial condition imposed by global distribution of CO2with
influence of photosynthesis and respiration, exhibits diurnal cycles differing by season. The background CO2 (CO2,b)
derived from Miyun observations is comparable to CO2
ob-served at a Mongolian background station to the northwest. Annual growth of overall mean CO2at Miyun is estimated at
2.7 ppm yr−1while that of CO2,bis only 1.7 ppm yr−1similar
to the mean growth rate at northern mid-latitude background stations. This suggests a relatively faster increase in the re-gional CO2sources in China than the global average,
consis-tent with bottom-up studies of CO2emissions. For air masses
with trajectories through the northern China boundary layer, mean winter CO2/CO correlation slopes (dCO2/dCO)
in-creased by 2.8±0.9 ppmv/ppmv or 11% from 2005–2006 to 2007–2008, with CO2increasing by 1.8 ppmv. The increase
in dCO2/dCO indicates improvement in overall combustion
efficiency over northern China after winter 2007, attributed to pollution reduction measures associated with the 2008
Correspondence to:Y. Wang ([email protected])
Beijing Olympics. The observed CO2/CO ratio at Miyun is
25% higher than the bottom-up CO2/CO emission ratio,
sug-gesting a contribution of respired CO2from urban residents
as well as agricultural soils and livestock in the observations and uncertainty in the emission estimates.
1 Introduction
Carbon dioxide (CO2)is an important greenhouse gas.
En-hanced CO2level in the atmosphere and its relationship with
global climate change have not only drawn increasing atten-tion from the scientific community but also presented great political and economic challenges to the entire world. A number of factors influence atmospheric CO2mixing ratios.
Long-term increase in CO2 following the Industrial
Revo-lution is attributed to emissions from human activity, espe-cially fossil fuel combustion. A fraction of anthropogenic emissions is absorbed by ocean and terrestrial biosphere. To-gether ocean and terrestrial biosphere uptake take up about 60% of CO2 emissions. The fraction of emitted CO2 that
remains in the atmosphere has large interannual variability, attributed in part to global climate anomalies such as ENSO (Keeling et al., 1976). The terrestrial biosphere regulates the amplitude and phase of CO2 seasonal cycles (Fung et
al., 1987; Keeling et al., 1989; Taguchi, 1996). Net accu-mulation of carbon by forests in the northern hemisphere is thought to be an important mechanism in maintaining the current hemispheric gradient in CO2 (Tans et al., 1990;
and Atmospheric Administration (NOAA) Earth System Re-search Laboratory (ESRL) background stations, has con-tributed to the progress in our understanding of the global carbon budget.
The most recent energy use and emission inventories in-dicate that China surpassed the United States as the world’s largest carbon emitter in 2006 (Gregg et al., 2008). China’s recent economic growth has been largely fueled by fossil energy, particularly coal. In 2006, China’s energy-related emissions of CO2 reached approximately 1.6 Pg C (Levine
and Aden, 2008). Most estimates of China’s energy-related carbon emissions are derived from official energy statistics, which are subject to large uncertainties. Based on inventories of biomass and soil carbon, ecosystem models, and atmo-spheric inversions, it is estimated that the biosphere in China removed roughly 28–37% of Chinese fossil fuel CO2
emis-sions during the 1980s and 1990s (Piao et al., 2009). The overall CO2budget of China has large uncertainties.
Obser-vations of CO2 variations in the atmosphere, reflecting the
combined effect of all sources and sinks, would provide ad-ditional constraints to reduce uncertainty in bottom-up esti-mates of natural and anthropogenic components of the Chi-nese carbon budget.
Significant improvement in current understanding of the related processes and evaluation of bottom-up emission in-ventories of CO2will require an extensive network of CO2
observations in China. Among all NOAA/ESRL background stations distributed globally, there are two adjacent sites up-wind and downup-wind of China, Ulaan Uul (UUM) in Mongo-lia and Tae-ahn Peninsula (TAP) in South Korea respectively (Fig. 1a). The Chinese Academy of Meteorological Sciences operates Waliguan Baseline Observatory (WLG) at Mount Waliguan (WLG) on the Qinghai-Tibet Plateau (Fig. 1a) in mainland China which has provided background atmospheric CO2 data since 1991 (Zhou et al., 2005, 2003). CO2 at
WLG is dominated mostly by the exchange between the at-mosphere and terrestrial biosphere (Zhou et al., 2006). Sim-ilar to other background stations, the inter-annual variabil-ity of CO2 at WLG – after the removal of the trend – is
influenced by the long-range transport of pollution. How-ever, because of its high elevation the observations at WLG are weakly influenced by local and regional CO2 sources
and sinks, thus providing limited information about anthro-pogenic CO2emissions in China, but offering a good
repre-sentation of global background CO2 signal that influences
surface observations throughout China by vertical mixing. There are a few background CO2sites located downwind of
China. Continuous monitoring of CO2 at those sites
pro-vided some implications of carbon emissions and uptakes from China. Cho et al. (2007) studied the continuous CO2
measurements at Anmyeondo, South Korea from 1999 to 2006, and attributed the 2.6 ppmv/yr growth rate of atmo-spheric CO2to the recent industrialization and urbanization
of Korea and China. Jin et al. (2008) reported a continu-ous 1-year atmospheric CO2measurement at Gosan, Seoul,
Anthropogenic CO Emissions (2006)
(a)
Beijing
50 km
site
(
b)
(b)
Fig. 1. (a)Locations of the Miyun site (filled black triangle) and
several background sites in and around China (WLG, UUM, TAP) (filled red triangles). The color shading indicates anthropogenic
CO emissions for 2006 (Zhang et al., 2009). (b)A regional map
shows the location of the site (white circle) relative to Beijing urban area and other population centers(yellow), major roads (red), airport (magenta), and terrain. The color shading indicates elevation from low (green – near sea level) to high (darkest brown corresponding to 1400 m). Miyun city is indicated by the red dot. Reproduced from Wang et al. (2008)
and Yanbian stations during 2004–2005, and using a chem-ical transport model identified the potential source regions as the northeastern and eastern parts of China. Zhang et al. (2008) analyzed the atmospheric CO2mixing ratio obtained
via a regular flask air sampling program onboard a ferry in the southernmost part of Japan from 1993 to 2006 and found some mixing ratios with large deviation from global mean CO2, which could have resulted from terrestrial biotic
2
Korea may shed some light on the net source or sink of CO2
over China. The Miyun observatory outside Beijing was es-tablished to address the paucity of continuous high quality trace gas measurements within China. Here we examine the potential for the resulting data to better constrain estimates of local to regional carbon budgets.
CO is a product of inefficient combustion that has often been used as a tracer of CO2from combustion (Bakwin et al.,
1997; Potosnak et al., 1999; Turnbull et al., 2006). The emis-sion ratio of CO2to CO varies with the efficiency of
combus-tion (Andreae and Merlet, 2001). Observed CO2-CO
corre-lation slopes thus provide useful constraints for identifying source types. For example, in modern power plants burn-ing fossil fuels conversion of fuel carbon to CO2is nearly
quantitative, whereas in biomass combustion with low fuel to air ratios 10% or more of carbon remains as CO. Conse-quently, the CO2/CO ratio observed in power plant plumes,
derived conventionally from the CO2-CO correlation slope,
should be an order of magnitude greater than the ratio in biomass burning plumes. The emission ratio of CO2 to
CO from vehicles varies significantly depending on emission control technologies adopted and vehicle maintenance. Vehi-cle CO2to CO emission ratios in the US derived from tunnel
measurements increased from about 10 ppmv/ppmv for pre-1975 vehicles to 50 ppmv/ppmv for vehicles in early 1990s (Bishop et al., 1996), with further increases measured for vehicles in late 1990s and early 2000s (Bishop and Sted-man, 2008). Higher CO2-CO ratios are expected from
ve-hicles meeting the Euro IV standard that will be mandated in China in 2010. Observations during the TRACE-P air-craft campaign over the Northwest Pacific in spring 2001 of air masses influenced by northeastern China yielded a slope of 10–20 ppmv/ppmv, which is significantly lower than the slope of 80 ppmv/ppmv sampled in outflow from Japan (Sun-tharalingam et al., 2004). Measurements at an urban site in Beijing, after excluding background air masses, suggested a CO2/CO ratio of 23 ppmv/ppmv in winter compared with
that of 33 ppmv/ppmv in fall (Han et al., 2009). Han et al. (2009) attributed the lower ratio in winter to low efficiency domestic heating, while the higher ratio in fall would also be consistent with stronger input from respiration when it is warmer. The CO2/CO correlation slope thus provides a
char-acteristic signature of the source region’s overall combustion efficiency, corresponding well to its mixture and distribution of energy sources.
CO2and CO have been measured continuously at Miyun,
a rural site 100 km northeast of Beijing since December 2004. This paper presents hourly averaged data for a pe-riod of 51 months (Dec 2004 through Feb 2009). The CO2
record at Miyun will provide valuable data for future mod-eling analysis of Chinese carbon sources and sinks. Hourly observations of CO2 and its correlation with CO at Miyun
are expected to provide more constraints on the local to re-gional influences of fossil fuel and biomass combustion and biospheric uptake and release on the abundance of CO2over
China which cannot be obtained from background stations such as WLG alone.
China’s 11th Five-Year Plan (FYP) set a target of reduc-ing China’s energy intensity (energy consumption per unit of GDP) by 20% from 2005 to 2010 (NDRC, 2006). The atmospheric CO2 to CO ratio measured at the Miyun site
will provide an additional independent constraint to the ques-tion whether there has been improvement in combusques-tion effi-ciency in China during the study period, an indirect measure of the effectiveness of the 11th FYP. However, we note the distinction between combustion efficiency, which can be de-tected from CO2/CO ratio, and energy intensity, which
can-not be inferred from our data. In addition to this national pol-icy incentive, the pollution reduction measures implemented on the local and regional scale to improve air quality dur-ing the 2008 Beijdur-ing Olympics are expected to contribute to changes in CO and the CO2/CO ratio.
We begin by introducing the site and instrumentation (Sect. 2). In Sect. 3, we examine the temporal variations of CO2 on different time scales, focusing on the different
characteristics of CO2between rural and background sites.
The CO2 to CO correlation analysis provides a convenient
method to separate contributions from different sources of CO2. The year-to-year changes in CO2/CO ratio at Miyun
outside the growing season are discussed in Sect. 4. Section 5 explains the effect of the Olympics on the CO2-CO
rela-tionship at Miyun. Concluding remarks are given in Sect. 6.
2 Site and instrumentation
The Miyun site (40◦29′N, 116◦46.45′E) is located at an
are warm-temperate deciduous broad-leaved forest and tem-perate coniferous forest.
Measurements began in November 2004 and include con-tinuous observations of CO, CO2, and basic meteorological
data (temperature, relative humidity, wind speed and direc-tion) as well as other pollutants (O3, NO, NOy, SO2). The
present study focuses on hourly mean measurements of CO2
and CO over the course of more than four years (Dec 2004 through Feb 2009). Details of the infra-red absorbance based CO instrument and calibration procedure are presented by Wang et al. (2008) and not repeated here.
The CO2mixing ratio is measured by the differential
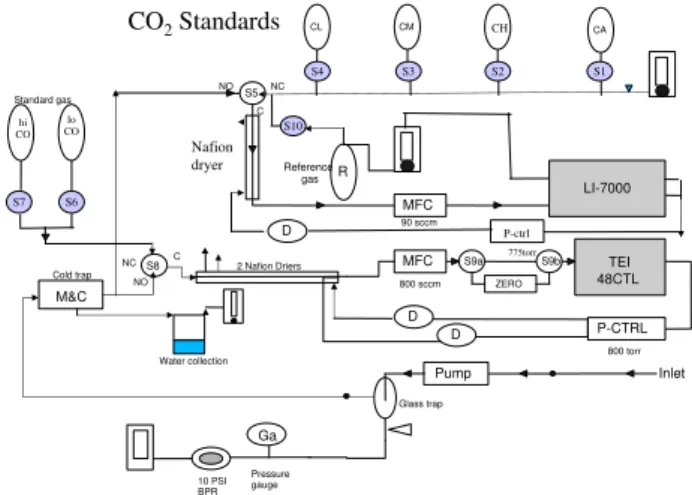
non-dispersive infrared (NDIR) method (LI-COR Biosciences Li-7000), shown schematically in Fig. 2. The measurement system incorporates extensive automatic calibration and ac-tive control of pressure and flow to assure reliable measure-ments that are compatible with global measurement stan-dards. Sample air is drawn first into the inlet 6m above the ground and passed through a 2◦C cold trap and a Nafion dryer to reduce water vapor to a low and constant mixing ratio. The reference cell is purged with compressed air with
∼375 ppmv CO2. Active mass flow and pressure controllers
installed upstream and downstream of the instrument, respec-tively, maintain a constant cell pressure in the analyzer. In-strument zero is determined every 2 h by passing the refer-ence gas into both the referrefer-ence and sample cells. Data are recorded as raw absorptances and converted to CO2mixing
ratios relative to dry air using a second order polynomial fit to calibration data obtained every 6 hours by introducing CO2
standards of high, middle and low mixing ratio that bracket the range of expected ambient mixing ratios into the sample cell. Every 7 days, the instrument accuracy is checked by in-troducing a separate CO2standard into the sample cell, and
comparing the calculated mixing ratio with the known mix-ing ratio. The three workmix-ing and surveillance standards were obtained from Scott-Marrin Inc. and calibrated to 0.1 ppm accuracy against a suite of NOAA primary standards main-tained as part of a dedicated calibration system in our lab-oratory at Harvard that supports several other ground-based measurement sites and airborne instruments (Daube et al., 2002). Measurement of the surveillance standard is espe-cially intended to detect long-term drifts and shifts associated with periodic replacement of the working standards. Com-pared with the expected mixing ratio of 382.12 ppmv (mea-sured before shipment to the site in 2004) for the archive standard, the mean of 177 validated points over the whole study period is 382.42±0.70 ppmv. Although the expected mixing ratio is not within the 95% confidence interval of the validated points (382.31−382.52 ppmv), there was no evi-dence of drift or calibration shifts; the slope of a linear re-gression of the mixing ratio over time is not significantly different from zero at 95% significance level. Because the archive standard is still in service, a post-use recalibration is not available at this time to determine if its true mixing ratio has changed since delivery to the site. The analytical
S5
S9a S9b
NO NC C
M&C
Cold trap 2 Nafion Driers
MFC 800 sccm
MFC 90 sccm
ZERO D
P-CTRL 800 torr TEI 48CTL LI-7000 R
Reference gas
CL CM CH CA
C
S8
NO NC
Ga
Pump Glass trap
Inlet
Pressure gauge 10 PSI BPR
S4 S3 S2 S1
S10
S6 hi CO
Standard gas
S7 lo CO
P-ctrl
D
Rev 6/8/04
77 5
775torr
D CO2Standards
Nafion dryer
Water collection
Fig. 2.Schematic of the CO2measurement set-up at Miyun.
Sam-ple and calibration flows are denoted by solid lines with arrowheads to indicate direction. Computer-controlled solenoid valves are indi-cated by shaded circles and identified as S1-10. The normally-open and normally-closed and common ports are identified by NO, NC and C. Mass-flow controllers are indicated by boxes labeled MFC, with the nominal flow rate given beneath. Likewise Pressure con-trollers (P-ctrl) list the nominal pressure below. Drierite traps to remove residual water in the instrument exhaust flow prior to the Nafion driers are indicated by ellipses identified with a D. Man-ually controlled needle valves with integrated rotometers regulate
the venting of standard, to ensure rapid flushing between CO2
cal-ibration, and flow of reference gas. Upstream sample pressure is controlled by a back-pressure regulator (BPR) set to 10 psi; a ro-tometer is installed to confirm that pump output is generating an excess flow.
precision of the CO2measurements derived from 1-minute
standard deviations of the calibration signals is 0.08 ppm
(2-σ.
3 Results
3.1 General statistics of CO2
3.1.1 Diel variations
Diel patterns of CO2 averaged by months are shown in
Fig. 3. The diel pattern is standardized by subtracting 24-hr mean CO2 from hourly CO2 (Murayama et al., 2004).
The day/night shift between photosynthesis and respiration, boundary layer dynamics, and pollution transport all con-tribute to observed diel cycles in CO2mixing ratio, with the
magnitude dependent on sampling height above the surface (Bakwin et al., 1998). Pronounced diel cycles of CO2can be
found in summertime, with peaks at night and troughs in the afternoon, driven mostly by nighttime respiration and day-time CO2 drawdown by photosynthesis in the surrounding
2
0 2 4 6 8 10 12 14 16 18 20 22 -20
-10 0 10 20
C O2 d e v i a t i o n f r o m 2 4 -h r m e a n p p m v
Local Time (hr)
Mar Apr May Jun Jul Aug Sep Oct Nov Dec Jan Feb
2005-2008
Figure 3. Mean standardized diurnal variation of CO by month at Miyun (2005-2008).
Fig. 3. Mean standardized diurnal variation of CO2by month at
Miyun (2005–2008).
CO2is somewhat higher at night because surface sources are
confined by a shallow boundary layer and stronger vertical mixing in the day brings down lower CO2air from aloft. The
mean diel ranges in summer and winter were around 33 ppmv and 7 ppmv respectively. The diel range is largest in August, reaching approximately 39 ppmv on average.
3.1.2 Trends and seasonal variations
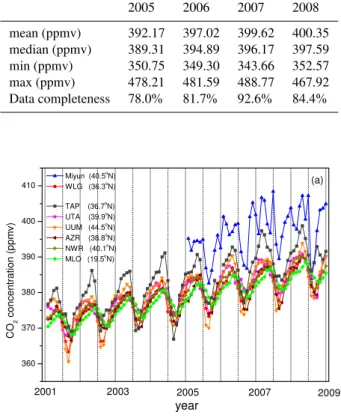
Although influenced somewhat by the frequency and tim-ing of data gaps, annual summary statistics for CO2
ob-served at Miyun (Table 1) show an average increase from 392.2 ppmv in 2005 to 400.4 ppmv in 2008, at an average rate of 2 ppmv/yr. Median mixing ratios increased at a similar rate. Substantial variability was observed for CO2at hourly
time steps, as indicated by the range of observations listed in Table 1. The large short-term variations were attributed to the influence of anthropogenic pollution plumes, biospheric activity and synoptic weather conditions, as the site is lo-cated near urban and agriculture areas. The annual mean is approximately 3 ppmv higher than the median in each year, indicating that the distribution of hourly CO2 was skewed
toward the higher end.
Figure 4 presents the monthly mean CO2at Miyun
com-pared with observations at several background stations of NOAA/ESRL (GLOBALVIEW-CO2, 2009; Conway et al.,
2009) and other agencies, including Mt. Waliguan (WLG; 36.29◦N, 100.9◦E, 3810 m a.s.l) in western China, Ulaan Uul (UUM; 44.45◦N, 111.10◦E, 914 m a.s.l) in Mongolia, Tae-ahn Peninsula (TAP; 36.73◦N, 126.13◦E, 20 m a.s.l) in South Korea, Niwot Ridge (NWR; 40.05◦N, 120.58◦W, 352 m a.s.l) and Wendover (UTA; 39.90◦N, 113.72◦W, 1320 m a.s.l) in the United States, and Terceira Island (AZR;
Table 1. Descriptive statistics of CO2observation from 2005 to
2008.
2005 2006 2007 2008
mean (ppmv) 392.17 397.02 399.62 400.35
median (ppmv) 389.31 394.89 396.17 397.59
min (ppmv) 350.75 349.30 343.66 352.57
max (ppmv) 478.21 481.59 488.77 467.92
Data completeness 78.0% 81.7% 92.6% 84.4%
C
O2
c o n c e n t r a t i o n p p m v
360 370 380 390 400
410 (a)
year
CO
2
concent
rat
ion (ppmv)
Miyun (40.5o
N) WLG (36.3oN)
TAP (36.7o
N) UTA (39.9o
N) UUM (44.5oN)
AZR (38.8o
N) NWR (40.1oN)
MLO (19.5o
N)
2009 2007
2005 2003
2001
Fig. 4.Monthly mean CO2at Miyun site and several NOAA/ESRL
sites. The solid gray lines denote January of each year, with the dotted gray lines indicating June.
38.77◦N, 27.38◦W, 40 m a.s.l) in the Azores. These ERSL
sites were selected because they are located either in/around China or are at about the same latitude as Miyun. CO2 at
Mauna Loa (MLO; 19.54◦N, 155.58◦W, 3397 m a.s.l) is
in-cluded to represent the mean global CO2trend. Unlike the
ESRL background stations, which are typically high eleva-tion or coastal sites that are not influenced by local sources and vegetative activity, the Miyun site is situated within a heavily vegetated region and near major anthropogenic sources. These factors will strongly influence atmospheric CO2levels at Miyun. Monthly mean CO2mixing ratios
ob-served at the Miyun site are typically more than 10 ppmv higher than those observed at the ESRL stations. The sea-sonal transition in CO2 is not smooth at Miyun. Enhanced
CO2levels are observed frequently in early summer (June) at
Miyun, often of comparable magnitude to CO2levels in
win-ter. This feature can be explained by frequent sampling of an-thropogenic pollution exported from the Beijing urban area under the prevailing southwesterly winds associated with the East Asian summer monsoon.
The weekly averages of hourly CO2 are presented in
2005 2006 2007 2008 2009
CO
2
conce
n
tr
at
ion
(ppmv)
Weekly average
year
370 380 390 400 410 420 430
3-month smoothed CO2 12-month smoothed CO2
Fig. 5.Weekly mean CO2at Miyun from December 2004 to
Febru-ary 2009 (black line). The red and blue line is an FFT-filtered curve of the seasonal and annual variations, respectively. The thin solid gray lines denote January of each year, with the dotted gray lines indicating June.
subsequent discussions. The weekly means ranged from 375 ppmv to 425 ppmv. From the weekly data, one can see clearly that the minima of CO2were observed in middle and
late summer, the season with the strongest local photosyn-thetic uptake of CO2 and lowest global background.
Al-though high CO2in June is significant, the peaks occurred
more frequently in winter when biological fluxes are only positive (i.e., release of CO2 from respiration), strong
tem-perature inversions trap emissions near the surface, and an-thropogenic sources increase due to domestic heating. A fast Fourier transform (FFT) method (Thoning et al., 1989) was used to smooth out the weekly data in order to reveal the seasonal amplitude and annual rate of increase of CO2
at Miyun. In the FFT filtering, the point window was se-lected as 13 (i.e., 13-week, roughly 3-month) and 52 (i.e., 12-month) to derive the seasonal (red line in Fig. 4) and annual (blue line in Fig. 4) variations respectively. The FFT filtering removes short-term variability and reveals the seasonal cycle of CO2similar to those found at the ESRL background sites:
minima in summer, maxima in winter, and smooth transi-tion in other seasons. The average seasonal amplitude of CO2 (detrended) is 7.4 ppmv. The average rate of increase
is 2.7 ppmv per year over the study period, similar to that reported by Cho et al. (2007). If nighttime (7 p.m.–7 a.m.) observations are excluded, the average seasonal amplitude (detrended) is 13.6 ppmv for daytime CO2, and the average
rate of increase is 2.5 ppmv per year over the study period. If only the afternoon observations (noon – 6 p.m.) are consid-ered, the average seasonal amplitude (detrended) increased to 16.5 ppmv and the average rate of growth is 1.9 ppmv. The rate of increase appears to have slowed with time. Mixing ratios of CO2increased by approximately 4.0 ppmv from the
0 200 400 600 800 1000
year
CO
conce
n
tr
at
io
n (ppbv)
Miyun (40.5o
N) WLG (36.3o
N)
TAP (36.7o
N) UTA (39.9o
N) UUM (44.5o
N) AZR (38.8o
N) NWR (40.1o
N) MLO (19.5o
N)
2009 2007
2005 2003
2001
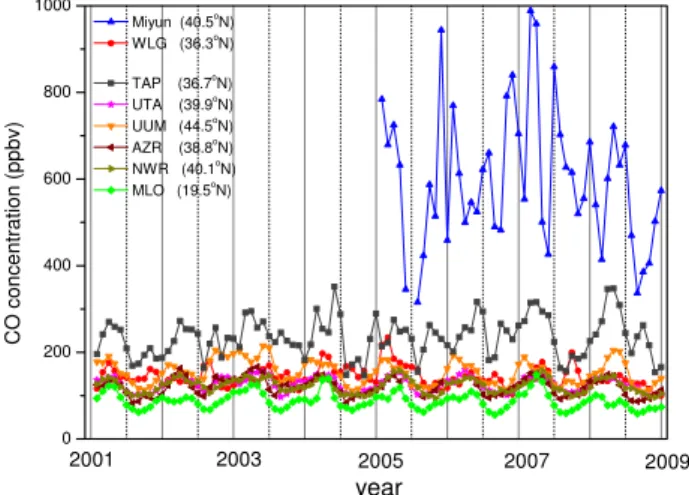
Fig. 6.Monthly mean CO at Miyun site and several NOAA/ESRL
sites. The solid gray lines denote January of each year, with the dotted gray lines indicating June.
beginning of 2005 to the beginning of 2006, 4.2 ppmv from 2006 to 2007, 1.4 ppmv from 2007 to 2008, and 1.2 ppmv from 2008 to 2009. Based on the energy statistics, Gregg et al. (2008) suggested that the rate of increase in CO2
emis-sions from fossil fuel combustion and cement production in China slowed from 18% in 2004 to 8% in 2006. Although the relative decrease in the growth rate of emissions appears comparable to that of Miyun CO2concentrations, the timing
when the change had occurred does not exactly match (2006 for emissions versus 2007 for Miyun CO2). The regional
im-pact of the emission reduction measures that reduced traffic or shut down industrial sectors implemented prior to, during, and after the 2008 Olympic Games in Beijing is expected to have large influence on emissions of CO2in 2007–2008
(to be discussed in Sect. 5). Atmospheric CO2observed at
Miyun may reflect a combination of these factors.
3.2 CO2-CO Correlation
CO is co-emitted with CO2from combustion sources,
lead-ing to a significant positive correlation between them when combustion is a significant source of observed CO2. A
sum-mary of the monthly mean CO at Miyun is presented in Fig. 6 comparing with CO observations at the background stations listed above (Novelli and Masarie, 2010). Monthly mean CO ranged from 300 ppbv to 1000 ppbv with irregular seasonal-ity. High CO levels indicate that regional pollution sources are frequently sampled at Miyun and will be reflected also in concurrent measurements of CO2. Detailed analysis of CO
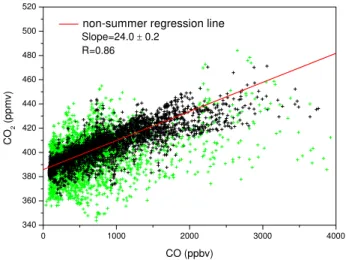
seasonality at Miyun is given by Wang et al. (2010a). Figure 7 presents the relationship between hourly CO2and
2
340 360 380 400 420 440 460 480 500 520
CO
2
(
ppm
v)
CO (ppbv)
0 1000 2000 3000 4000
non-summer regression line Slope=24.0 ± 0.2
R=0.86
Fig. 7. CO2-CO relationship observed at Miyun (March 2007–
February 2008). Each data point represents hourly mean mixing
ratios of CO (x-axis) and CO2(y-axis). The green crosses represent
summertime observations. The correlation coefficient and slope shown in insert are derived from the reduced major axis method (see text). The red line is the regression line for non-summer obser-vations.
two variables should be treated as symmetrical. Therefore, the reduced major axis method (Hirsch and Gilroy, 1984) was adopted to derive the correlations, instead of using the ordinary least square method. CO2and CO had strong
corre-lation in the winter, indicating strong influences of combus-tion emissions on CO2. The correlation coefficient was much
smaller in the spring and fall, with correlation slopes similar to that observed in winter. As illustrated by the diel cycles, the CO2signal is dominated by the biosphere from May to
September, with a maximum drawdown of 39 ppmv in daily CO2 in the summer. Biospheric activity, however, has little
impact on CO except for the CO source from in situ oxida-tion of biogenic hydrocarbons. The correlaoxida-tion between CO2
and CO in the summer was insignificant (the summer data is highlighted by green crosses in Fig. 7). Excluding the sum-mer data, the overall CO2/CO correlation slope at Miyun was
about 24 ppmv/ppmv during 2007–2008. Suntharalingam et al. (2004) derived the CO2/CO ratio of 18 ppmv/ppmv from
the TRACE-P aircraft measurements downwind of China in the spring of 2001. Han et al. (2009) derived the CO2/CO
ratio of 23 ppmv/ppmv in winter at an urban site in Bei-jing. The emission ratio of CO2to CO in 2000, derived from
the bottom-up emission inventories of Streets et al. (2003) for CO2 and Streets et al. (2006) for CO, was 15 mol/mol
(mol/mol is equivalent to ppmv/ppmv) for the whole country and 14 mol/mol for provinces in northern China. More re-cent bottom-up studies on Chinese anthropogenic emissions by Zhang et al. (2009) for CO and Gregg et al. (2008) for CO2indicated that the emission ratio of CO2to CO in China
was about 21 mol/mol in 2006.
In addition, non-combustion (biospheric) sources of CO2
that are comingled with combustion sources over large spa-tial scales will contribute to observed CO2-CO correlations
because their variances are affected by the same atmospheric transport (Gloor et al., 2001; Folini et al., 2009). In partic-ular, the overall respiration component from a densely pop-ulated urban area may be significant relative to combustion. Because respiratory CO2 emissions by urban residents are
collocated with urban combustion sources, respired CO2will
be part of the urban plume and contribute to the observed CO2/CO correlations. Based on per capita energy
consump-tion and average human respiratory emissions, respiraconsump-tion by urban residents should add about another 2 mole CO2 per
mole of CO (supplementary material S.1). Respiratory CO2
from soils and livestock is likely an important source of CO2,
but because these sources are spatially distinct from densely populated urban areas we expect the correlation between this CO2and CO to have a weaker correlation. Soil respiration
in winter is likely minimized by cold temperatures and arid climate. Furthermore, sources of CO2and CO outside China
may contribute to the observed CO2/CO correlation at Miyun
to the extent that neither gas is significantly perturbed by chemical reaction or surface exchange during transport. In Sect. 4, background trajectory analysis will be employed to segregate air masses representing regional emissions from northern China. The CO2/CO correlation slopes for those
observations will be compared with bottom-up emission es-timates.
The magnitude of CO2 variance driven by surface
ex-change with soils and vegetation exceeds the variance from combustion sources, hence CO2:CO correlations are low in
the summer. The correlation coefficient (R) between CO2
and CO was 0.4 for the whole dataset in the summer of 2007. To distinguish between the relative contributions of an-thropogenic emissions and biospheric activities to CO2
dur-ing the period of active vegetation (summer), the correlation analysis was modified to account for diel patterns imparted by photosynthesis and respiration. The meanR for entire summer increased to about 0.5 when CO2:CO correlation
was computed separately for each hour of the day. Binning the data by both hour and month (3 month×24 h) increases the averageR above 0.6, though each data group was left with only about 30 data points. The separation by time of day and month is analogous to the CO2-CO analysis by Potosnak
et al. (1999) but without the added factor based on local CO2
flux that would account for influence of temperature, solar ra-diation, water availability, and other factors that affect CO2
uptake and emission, which reduced the summertime corre-lation coefficients below the values observed in winter. Nev-ertheless, compared to the overall correlation analysis, the grouping method by local time can provide useful informa-tion with statistical significance for the CO2-CO relationship
during warm seasons. The CO2/CO slope observed at Miyun
Figure 8. The correlation coefficients (R), correlation slope (dCO /dCO), and intercep
Fig. 8. The correlation coefficients (R), correlation slope
(dCO2/dCO), and intercepts of CO2-CO regression at Miyun as a
function of local time for summer (left) and winter (right), 2007.
distribution and non-CO related CO2sources and sinks. In
what follows, the CO2/CO correlation slope (or enhancement
ratio) is denoted as dCO2/dCO and correlation intercept as
CO2,i.
Figure 8 displays CO2/CO correlation coefficient (R),
dCO2/dCO, and CO2,ias a function of local time in the
sum-mer (JJA) (left panel) and winter (DJF) (right panel) of 2007. Note that the intercept is not strictly interpreted as back-ground CO2because background CO is not zero. The winter
intercept remains largely constant within the 24 h, indicating that photosynthesis is dormant and respiratory CO2influence
is more or less constant throughout the day. In contrast, the summer intercept shows a pronounced diel cycle, with a peak of 394.5 ppmv at 5 a.m. and a trough of 357.7 ppmv at 2 p.m. This reflects the uptake of CO2by photosynthesis during the
day and release of it by respiration at night. The mean diur-nal range of the intercepts is about 37 ppmv in the summer of 2007. The diurnal cycle of the intercepts is in phase with the diurnal cycle of CO2(33 ppmv) and with comparable
am-plitude, lending support to the correlation analysis by local time.
3.3 Background CO2
We define “background” CO2 as the level that would exist
without influence of combustion sources, but still affected by net uptake or emission from biosphere. CO2mixing
ra-tio at remote sampling sites (e.g. ESRL flask network) is not directly comparable with background defined here be-cause it excludes the influence of regional and local bio-sphere. Although the Miyun site is located near major source regions, continuous high-frequency measurements of CO2
and CO at the site allow for identification of background CO2. The intercept of the CO2-CO correlation (CO2,i)was
370 380 390 400 410 420
2009 WLG
UUM TAP Miyun
Estimated Background
CO
2
co
nce
n
tr
at
ion
(
p
pm
v)
year
2008 2007
2006 2005
50 100 150 200 250 300 350
2009 WLG
UUM TAP
Estimated Background
CO
c
onc
ent
ra
ti
on (
p
p
b
v)
year
2008 2007
2006 2005
(a)
(b)
Fig. 9. Background CO2(a) and CO (b) derived at Miyun (green)
compared to three ESRL sites (WLG, UUM, and TAP). The solid gray lines denote January of each year, with the dotted gray lines
in-dicating June. Background CO2at Miyun is derived using Eq. (1).
Background CO at Miyun is derived as the 5th percentile of obser-vations in each month.
used to derive CO2 at Miyun that has excluded the
com-ponent correlated with the combustion tracer, CO. As dis-cussed above, dCO2/dCO and CO2,iare calculated by hours
for each month, including the summer months. Averaging these hourly values by month gives the monthly mean inter-cepts and slopes. Because the intercept represents the ex-pected value of CO2 when CO mixing ratio is zero, but in
reality there is a finite background CO, we use the 5th per-centile of the CO distribution for each month as an estimate of background CO (CObg)and calculate the CO2mixing
ra-tio at CObgby adding the product of dCO2/dCO and CObgto
the CO2intercept (denoted as CO2,bhereafter):
CO2,b=CO2,i+CO|5%×dCO2/dCO (1)
Background CO2and CO estimated for each month is shown
2
Miyun is generally comparable with CO at the nearby back-ground sites (Fig. 9b), except for a couple of months in sum-mer due to data coverage issue or synoptic weather pattern not favorable for sampling of clean continental air masses. The uncertainty in CObgis estimated at about 20 ppbv,
lead-ing to 0.5 ppmv uncertainty in CO2,b. The monthly mean
CO2,b is about 11.1 ppmv lower than the overall monthly
means at Miyun and exhibits regular seasonal cycles from year to year. Annual mean CO2,b is 386.1 ppmv at Miyun.
Among the ESRL sites selected, UUM is located directly upwind of Miyun during the periods of northwesterly pre-vailing winds (UUM is 640 km northwest of Miyun), while WLG is a high-elevation site located on the Qinghai-Tibetan Plateau in western China with smaller seasonal variability in CO2. TAP is a Korean site located downwind of Miyun with
higher CO2 all year around than other ESRL sites at
sim-ilar latitude, likely due to the impact of regional pollution. Background CO2at Miyun shows seasonal cycles similar to
monthly mean CO2observed at UUM. The differences
be-tween CO2,b at Miyun and CO2 at the upwind UUM site,
although confounded somewhat by air mass trajectories and exchange with the overlying free troposphere, can be inter-preted in terms of whether the biosphere is a net source or sink of CO2in the region between the two sites. It can be
seen from Fig. 9a that CO2,bat Miyun and CO2at UUM are
largely overlapping with no substantial differences outside their uncertainties. This implies that the terrestrial biosphere over the region between the two sites is neither a very large sink nor a very large source of CO2, which is consistent with
the aridity and mountainous terrain with sparse vegetation between the sites
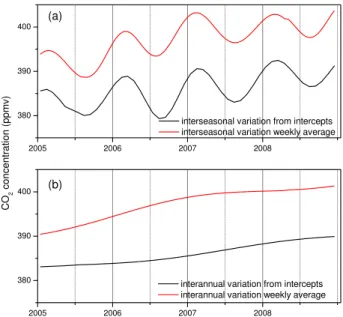
Monthly mean CO2,b and overall CO2 (FFT-filtered) are
compared in Fig. 10a. The difference between CO2,b and
overall CO2 reflects combustion contributions from local
and regional sources in China that are correlated with CO. Mean CO2 observed at the site exceeds CO2,b because
lo-cal to regional sources influence the high values of CO2
mixing ratio. Secular trends of CO2,b and CO2 are
pre-sented in Fig. 10b. Annual growth of overall mean CO2is
increasing by 2.7 ppm yr−1 while CO2,b is only increasing
by 1.7 ppm yr−1, which is not significantly different from the annual increase at the northern mid-latitude ESRL back-ground stations (Fig. 4). The mean growth rate for CO2
over the same period is 1.69 ppmv/yr at UUM, 1.37 ppmv/yr at WLG, and 1.6 ppmv/yr for all the northern mid-latitude ESRL stations shown in Fig. 4. Faster growth of mean CO2,
which depends on the middle and upper portion of the prob-ability distribution of CO2observations that are affected by
local and regional inputs, suggests relatively faster increase in the regional CO2sources in northern China than the global
average. Indeed, the Carbon Dioxide Information Analysis Center (CDIAC) (Marland et al., 2007) reported an 8% in-crease in CO2 emissions from fossil fuel consumption and
cement production in China for 2006 compared to a 3.2% increase in global average emissions. This corresponds to a
2005 2006 2007 2008
380 390 400
2005 2006 2007 2008
380 390 400
(b)
interannual variation from intercepts interannual variation weekly average
(a)
CO
2
c
o
n
c
en
tr
at
io
n (
p
pm
v
)
interseasonal variation from intercepts interseasonal variation weekly average
Fig. 10. The interseasonal (a) and annual (b) variations of CO2
observed at Miyun (red) and background CO2(black) derived from
the CO2-CO correlation analysis.
ratio of 2.5:1 (8/3.2) between China’s emission growth rate and the world’s in 2006, while Miyun data indicate a smaller ratio of 1.6: 1 (2.7/1.7) between regional CO2increases and
global background. As this is a simple comparison, the dis-crepancy can be due to multiple factors such as the uncertain-ties in emission estimates, representativeness error of Miyun data for all of China, and the role of biosphere on regional and global CO2.
4 Year-to-year variations in CO2/CO ratio in winter
In this section, we examine year-to-year variations in dCO2/dCO in wintertime at Miyun, as an indicator of
com-bustion efficiency changes over northern China, during the study period extending five winters (Dec 2004 through Feb 2009). In this study, the winter season of a given year refers to a period of three months, from December of that year to February of the following year. For example, winter 2008 denotes Dec 2008 through Feb 2009.
We restrict our analysis to observations in winter for four reasons. First, the CO2-CO correlation in this season is
strongest suggesting that biospheric influence on CO2 is
less variable when photosynthesis is weak and the anthro-pogenic signature in CO2 can be separated more robustly
using CO as a tracer. Both CO2 and CO have relatively
longer atmospheric lifetimes in winter (∼3 months for CO and∼100 years for CO2)because photosynthetic uptake of
CO2is minimal in the north China region and CO oxidation
Table 2.The CO2-CO correlation slope (dCO2/dCO) and trend for winter observations at Miyun.
Overall data3 CO-filtered data2 NCN air masses3(CO filtered)
Winter1 slope error slope error slope error
2004 13.3 0.4 17.1 0.5 17.3 0.6
2005 21.8 0.4 23.5 0.6 23.8 0.9
2006 20.7 0.5 26.1 0.8 26.0 1.0
2007 25.7 0.4 27.7 0.8 28.6 1.1
2008 21.2 0.6 26.8 0.8 26.6 0.9
Change in mean slope from
2005–2006 and to 2007–2008 2.2±0.5 2.5±0.8 2.8±0.9
1Winter refers to a period of three months, from December of the listed year to February of the following year. 2The CO-filtered dataset refer to the data with CO levels between the 30th–90th percentiles. See text for details. 3CO
2-CO scatter plots for the overall data and for the NCN air masses are shown in supplementary material S.2 and S.3 respectively.
to be preserved during a day or two of transport as suggested by Gloor et al. (2001) of the tower transport time and foot-print area. Second, the influence of biomass burning emis-sions is smallest in winter. Third, emisemis-sions associated with domestic heating, which contributes to a significant portion of fossil fuel consumption in China, are presented in win-ter observations. As a result, the winwin-ter CO2-CO
relation-ship should reflect more aspects of anthropogenic emissions compared with that of the other seasons. To avoid results that are dominated by specific local sources within a few km that are trapped in a shallow nighttime inversion layer, this analysis is restricted to daytime data when observations are more regionally representative (larger than tens of km). Fourth, vertical mixing is weaker in winter and local influ-ences are accentuated. The observed CO levels and back trajectory cluster analysis were employed to segregate ob-servational data that are representative of regional character-istics of emissions for northern China. The significance test (F-test) for the rate of change was conducted, withp (prob-ability) less than or equal to 0.05 considered as statistically significant at 95% confidence interval (C.I.).
4.1 Initial evaluation
A simple first step was to evaluate the overall dCO2/dCO
over the five winters before separating different air mass types, such as background and regional pollu-tion. The overall dCO2/dCO in each winter is
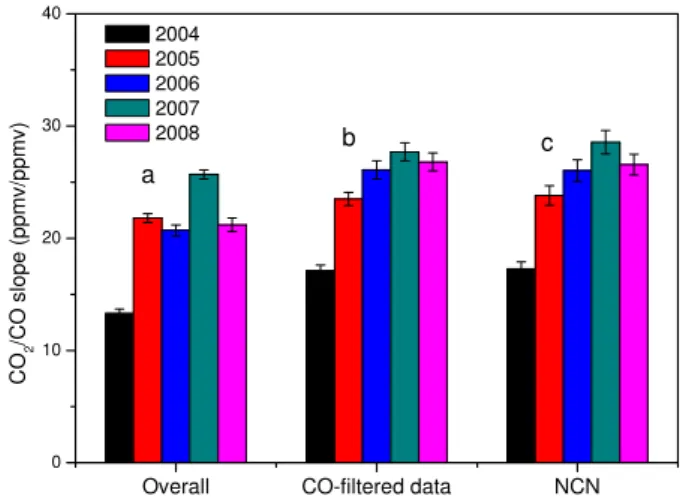
sum-marized in Table 2 and Fig. 11a. The CO2/CO slope
increased from 13.3±0.4 ppmv/ppmv in winter 2004 to 25.7±0.4 ppmv/ppmv in winter 2007, and slightly de-creased to 21.2±0.6 ppmv/ppmv in winter 2008. The slope for winter 2004 was distinctly lower than the slopes for sub-sequent years. Measurements in winter 2004 had more gaps than subsequent winters due to instrument startup and restart period during the initial site setup. Examination of the scatter plots for individual years (supplementary material S.2) points to different patterns for the high and low CO data points,
sug-Overall CO-filtered data NCN
0 10 20 30 40
CO
2
/CO slo
pe
(pp
m
v/ppmv)
2004 2005 2006 2007 2008
a
b c
Fig. 11.The CO2-CO correlation slope (dCO2/dCO) for winter
ob-servations at Miyun. The slopes are evaluated for the overall dataset
(a), the CO-filtered dataset (with CO between the 30th and 90th
per-centiles)(b), and the CO-filtered northern China air masses (NCN)
(c). The uncertainty bar is the uncertainty level of the slope
calcu-lated by RMA regression method.
gesting the CO-selective analysis described in the following section. It is inadequate to evaluate the overall slope using all the data and it is necessary to analyze the trend for se-lected air masses representing regional emissions from north-ern China.
2
0 500 1000 1500 2000 2500 3000
0.000 0.002 0.004 0.006 0.008
Fr
equenc
y
CO (ppbv) (a)
0 500 1000 1500 2000 2500 3000 0%
90%
C
umulative Probabl
ity
CO (ppbv)
30% 100%
(b)
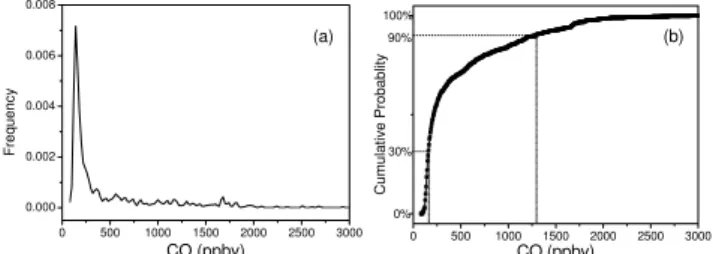
Fig. 12. Histogram (a) and cumulative probability distribution
(b)of daytime CO mixing ratios in winter 2007 (December 2007
through February 2008).
clean background continental air masses from the north. The long tail toward very high CO (>1000 ppbv) represents ur-ban pollution plumes and local rural pollution with high lev-els of CO. The distribution of CO in winters of other years is similar. Based on the cumulative probability distribution of CO (Fig. 12b), the wintertime dataset can be divided roughly into three subsets using CO as a criterion: below the 30th percentile, between the 30th and 90th percentile, and above the 90t h percentile of CO. The dataset with CO below the 30th percentile all had CO levels less than 160 ppbv, typi-cally continental background air masses from the north. The dataset with CO exceeding the 90th percentile is high in both CO2 (>385 ppmv) and CO (>1000 ppbv), but with lower
CO2/CO slopes (about 3.3 ppmv/ppmv) compared with the
other datasets, indicating the dominance by local sources (e.g. biofuel combustion in the nearby village) that typically have low combustion efficiency and are trapped in a shallow inversion layer (Streets et al., 2006). The dataset with CO be-tween the 30th and 90th percentile is selected to represent the regional signature of CO2and CO over northern China with a
well-mixed blend of sources. Hereafter, we refer to this sub-set of the datasub-set as the China regional datasub-set or CO-filtered dataset. The CO2-CO correlation slopes for the China
re-gional dataset are summarized in Table 2 and Fig. 11b. As for the overall slopes, the CO2/CO slope in CO-filtered data was
significantly lower in 2004 than in subsequent years. The CO2/CO slope increased from 17.1±0.5 ppmv/ppmv in
win-ter 2004 to 23.5±0.6 ppmv/ppmv in winter 2005. The slope continued to increase from 2005–2007 and dropped some-what in 2008.
4.2 Air mass groups using cluster analysis
A more robust method to identify influential source regions is to understand transport paths of air masses to the site through back trajectory modeling. The HYSPLIT (Hybrid Single-Particle Lagrangian Integrated Trajectory) model (version 4.9) (http://www.arl.noaa.gov/HYSPLIT.php) (Draxler and Hess, 1998) was employed in this study to calculate back-ward trajectories of observations in winter. The meteoro-logical data employed to calculate the back trajectories are
GDAS reanalysis data at 1◦×1◦spatial resolution. The back
trajectories are calculated twice a day, at 1000 h and 1500 h local time respectively, with the initial height of 6m and time steps of 1 h. To show the regional effect, 72-h (3-day) back trajectories are calculated for each day of the five winters (2004–2008). This corresponded to 722 back trajectories, which are classified into four air-mass groups (Fig. 13a–d) based on cluster analysis (Dorling et al., 1992). Mean alti-tudes of the four groups are displayed in Fig. 13e. As a result of the influence of the Siberian High (a massive high pressure system on the Eurasian terrain driving the northwesterly win-ter monsoon) on synoptic patwin-terns in winwin-ter, the majority of the 3-day back trajectories originated from the northwest and was typically confined below 2 km. The four air-mass groups are: Central Eastern Siberia (CES) (13a), Aged Continental (AC) (13b), Northwest China (NWC) (13c), and North China Plain (NCP) (13d). The CES air masses originated in the rel-atively clean central Eastern Siberian region (east of 90◦E
and north of 55◦N) and can be considered background con-tinental air. The AC air masses originated in central Asia west of 90◦E and were transported over long distances be-fore arriving at the site. Newell and Evans (2000) suggested that this type of air mass is responsible for influxes of aged pollution from Europe to China. The NWC air masses origi-nated in northwestern China and Mongolia (west of 100◦E), and were transported eastward to the site with the majority of their courses in China. Most of the NCP air mass originated and traveled within northern China. The CES, AC, NWC, and NCP groups, respectively, account for 22%, 20%, 17%, and 39% of all air masses calculated for the four winters. A small portion (<2%) of the trajectories is of an unclassi-fied type. The average fractional time that each group of air masses spends below 500 m in China is 21%, 22%, 46%, and 69% for the CES, CA, NWC, and NCP groups, respectively. In the following discussion, the NWC and NCP air masses were grouped into one “North China” (NCN) group, in part because the two air mass groups spent a significant fraction of their travel times within the northern China boundary layer before arriving at Miyun and had similar mixing ratios of CO2and CO. The NCN group is the predominant air mass
group in the winter, most representative of surface fluxes (sources or sinks) of CO and CO2in northern China.
(a) Cluster 1(CES)
30oN
35oN
40oN
45oN
50oN
55oN
60oN
65oN
70oN
60oE 80oE 100oE 120oE
(b) Cluster 2(AC)
30oN
35oN
40oN
45oN
50oN
55oN
60oN
65oN
70oN
60oE 80oE 100oE 120oE
(c) Cluster 3(NWC)
30oN
35oN
40oN
45oN
50oN
55oN
60oN 65oN
70oN
60oE 80oE 100oE 120oE
(d) Cluster 4(NCP)
30oN
35oN
40oN
45oN
50oN
55oN
60oN 65oN
70oN
60oE 80oE 100oE 120oE
80 E 100 E 120 E
(e) mean altitude of each cluster
0 20 40 60
hr 0
250 500 750 1000 1250 1500
meters above the surface
1(CES) 2(AC)
3(NWC)
4(NCP)
Fig. 13. Back trajectories for wintertime observations at Miyun
(2004–2008) by clusters: Central East Siberia (CES)(a), Aged
Continental (AC) (b), Northwest China (NWC) (c), and North
China Plain (NCP)(d). The mean altitude of each cluster is shown
in(e).
influenced by local emissions and concentrated urban pollu-tion plumes, both of which cannot be resolved by the back trajectory model. In what follows, air mass groups refer to the CO-filtered dataset instead of the whole dataset, unless stated explicitly. In Sect. 4.3, we will examine the sensitivity of our results if the whole dataset is segregated by air mass groups.
Table 3 summarizes mean CO2, CO, and their
relation-ship for the three air mass groups averaged over the five winters. As the CO-filtered dataset excludes the relatively clean air masses with CO less than the 30th percentile, the CES group accounts for only 12% of the CO-filtered data. The NCN group is the predominant group in the CO-filtered dataset, accounting for 69%. This group has the highest CO mixing ratios (666±104.4 ppbv) and CO2mixing ratios
(400±4.4 ppmv), followed by the AC group and CES group. As expected of background air, the correlation between CO2
and CO for the CES group is weaker than those of the AC or NCN groups. The difference in chemical composition of the three air mass groups is consistent with the expected gra-dients based on cluster analysis of air mass origins, lending support to the method adopted here.
2004 2005 2006 2007 2008
0 200 400 600
Numb
er of
O
b
servatio
ns CES AC NCN
2004 2005 2006 2007 2008
0.0 0.2 0.4 0.6 0.8 1.0
F
rac
ti
on
Winter
(a) The number of observations in each winter by clusters; (b) The fract
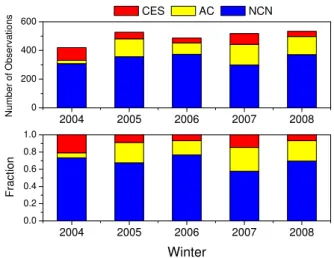
Fig. 14. (a)The number of observations in each winter by clusters;
(b)The fraction of each cluster in total observations in each winter.
Figure 14 summarizes the number of CO2-CO data pairs
in each air mass group (14a) and their fractional contribu-tion to the total number of CO-filtered observacontribu-tions (14b) for each winter. The total number of observations is com-parable between winters 2005 and 2008, but lower in winter 2004 because of measurement gaps associated with instru-ment startup during the initial site setup period. The NCN group is the predominant group in each winter, consisting of more than 300 data pairs and accounting for 55%–75% of the total observations. For the CES and AC group, however, the year-to-year variations in the number of data points are more significant and the changes in dCO2/dCO was not
con-ducted for these groups. We examine next the variability in dCO2/dCO for the NCN group.
4.3 CO2/CO ratio for NCN air masses
The year-to-year changes in wintertime dCO2/dCO for the
NCN air mass group are summarized in Fig. 11c. The correlation slope, dCO2/dCO, for the NCN air mass group
increased from 17.3±0.6 ppmv/ppmv in winter 2004 to 28.6±1.1 ppmv/ppmv in winter 2007. It dropped some-what to 26.6±0.9 ppmv/ppmv in winter 2008. A linear fit of the five data gives an annual rate of increase of 2.61 ppmv/ppmv/yr (p=0.05). When the whole dataset of NCN air masses was considered (i.e., without the CO fil-tering), the rate of increase in dCO2/dCO was estimated at
2.64 ppmv/ppmv/yr (p=0.13) over the five winters, compa-rable to the results above but with lower p-value. As back-ground air masses low in CO are not representative of Chi-nese emissions and thus not expected to show a trend in the CO2/CO ratio, including them in the trend analysis
2
Table 3.Mean CO2, CO, and their relationship for each air mass group (CO-filtered) over the five winters (2004–2008).
Cluster Share (%) Mean CO2(ppmv) Mean CO (ppbv) Intercept (ppmv) Slope (ppmv/ppmv) R
CES 12 392.4 284.5 383.1±3.7 33.1±4.6 0.79
AC 19 396.3 496.6 385.0±2.2 23.0±6.7 0.93
NCN 69 400.2 666.1 384.2±3.5 24.4±4.4 0.94
Fig. 15.Box plots of CO2(a)and CO(b)observations for the NCN
air mass group at Miyun in winter, 2004–2008.
When winter 2004 was not included, the rate of increase in dCO2/dCO reduced by 30%, to 1.6 ppm/ppm/yr (p=0.15)
for the NCN group, suggesting that the small dCO2/dCO in
winter 2004 has exerted a large impact on trend calculation above. Nevertheless, the increase in dCO2/dCO from
win-ter 2006 to winwin-ter 2007 is significant (2.6±1.4 ppmv/ppmv), whereas the difference between other adjacent years is less significant. Therefore, we averaged dCO2/dCO before
win-ter 2007 (excluding winwin-ter 2004) and afwin-ter winwin-ter 2007. Mean dCO2/dCO was 27.6±0.71 ppmv/ppmv for winters
2007–2008, compared to 24.8±0.68 ppmv/ppmv for winters 2005–2006. The increase in mean dCO2/dCO from winters
2005-2006 to winters 2007–2008 was 2.8±0.9 ppm/ppm or roughly 11%.
Analysis of the year-to-year changes in CO2and CO of the
NCN air masses separately (Fig. 15) suggested that the rate of increase in dCO2/dCO was caused primarily by decreases
in CO in 2007–2008 compared with 2005–2006, offsetting the effect of slowing CO2increases during the same period.
Mean CO of the NCN air masses in the winter decreased at a rate of about−42.5 ppbv/yr (p=0.25), although the trend is not statistically significant due to large variability in CO ob-served at Miyun. Large decreases in both CO and CO2were
observed in winter 2007. Mean CO was lower by 230 ppbv and CO2 by 3 ppmv compared to winter 2006. This was
likely associated with the pollution reduction measures im-plemented in preparation for the 2008 Summer Olympics and Paralympics Games in Beijing. According to the plans listed by the Beijing municipal government (http://www.bjepb.gov. cn/bjhb/publish/portal0/tab151/info9190.htm, read 10 Dec, 2009), a number of highly polluting and energy inefficient cement, coking, steel, petrochemical, and power plants in
Beijing had been relocated or closed off by the end of 2007. Inefficient small boilers and coal stoves for domestic heat-ing were also replaced. These policies were implemented in stages before the actual Games, in contrast to the more temporary policies instituted during the two months of the Games that will be discussed in Sect. 5. It is estimated that approximately 50% of the industrial boilers were closed be-fore December 2007 after the implementation of the 13th stage of emission control policies planned by the Beijing En-vironmental Protection Bureau (Wang et al., 2010b). Ob-servations of CO2 and CO at Miyun in winter 2007 (Dec
2007 through Feb 2008) suggest that these emission reduc-tion measures had indeed become effective by early 2008, leading not only to reductions in pollution levels, but also reductions in overall energy consumption and increases in combustion efficiency as indicated by changes in CO2 and
dCO2/dCO respectively. Mean CO in winter 2008 was higher
than winter 2007, probably due to different transport patterns as indicated in the different fraction of NCN air masses be-tween the two winters (Fig. 14), but lower than winter 2006 and before, suggesting that some but not all of the emission reduction measures associated with the 2008 Olympics had led to permanent reduction of pollution levels. Examples of the permanent measures are replacing inefficient residential boilers and stoves, while temporary shutdown of industrial boilers before the Games only had a short-term effect on CO. This will be further discussed in the next Section and Table 5. As discussed above, the NCN air mass group is the pre-dominant group in winter and most representative of regional emissions from northern China. The significant increase in the CO2/CO correlation slope in this group of air masses
from 2005–2006 to 2007–2008 suggests that the emission ratio between CO2 and CO over northern China may have
increased during the study period. As CO is a tracer of inef-ficient combustion, the increase in the emission ratio of CO2
The CO2/CO correlation slope for the NCN group was
26.0±1.0 ppmv/ppmv in winter 2006. As discussed above, the emission ratio between CO2 and CO for China was 21
mol/mol in 2006 as derived from bottom-up inventories of anthropogenic emissions of CO2 (Gregg et al., 2008) and
CO (Zhang et al., 2009). Observationally based estimates of CO2/CO are sensitive to all sources of CO2and CO that
have statistical correlation. Both co-emitting sources and ad-jacent but separate sources that become correlated because of transport are included. In particular CO2 from
respira-tion by residents of dense urban areas will be correlated with other urban emissions including vehicles and boilers when the urban plume is sampled downwind, leading to an enhanced CO2/CO ratio relative to bottom-up
invento-ries that only account for combustion sources. Indeed the observed CO2/CO ratio at Miyun (26 ppmv/ppmv) is 25%
higher than the bottom-up estimate of CO2/CO emission
ra-tio (21 ppmv/ppmv), which is consistent with a contribura-tion of respired CO2from urban residents. However, the
enhance-ment exceeds the ∼10% expected from a simple estimate based on per capita energy use and average CO2respiration
discussed above. Additionally, the difference between inven-tory and observed ratios may indicate the presence of sea-sonality and spatial variability that generate differences when annual national means are compared to a site-specific winter-only value. Another explanation is that the bottom-up inven-tories either underestimated Chinese combustion emissions of CO2 or overestimated emissions of CO. Future analysis
of the discrepancy will combine higher resolution transport model and detailed inventories of all CO2and CO sources
to simulate the CO2 and CO correlations at Miyun and be
discussed in a subsequent manuscript.
5 Case study: CO2/CO ratio during the 2008 Beijing
Olympics
To improve air quality during the 2008 Olympics (8–24 Au-gust) and the Paralympic Games (9–17 September), aggres-sive emission reduction measures were implemented tem-porarily for about two months in Beijing and its surrounding regions, including Tianjin municipality, Hebei, Inner Mon-golia, Shanxi, and Shandong. Starting 1 July, 2008, all ve-hicles that failed to meet the Euro 1 standards for exhaust emissions were banned from traveling on Beijing roads. Be-tween July 20 and September 20, private vehicles in Bei-jing were only allowed to travel on odd or even numbered days according to their plate number. Companies were re-quired to take strict control measures by the end of June to ensure that their pollution did not exceed permitted levels. Wang et al. (2009), through comparative analysis of long-term Miyun observations before and during the Olympics, suggested that the emission reduction measures during the Olympics were effective in reducing pollutant concentrations such as O3, CO, SO2, and NOx in Beijing. In this section,
observations of CO2and its correlation with CO at the site
during the Olympics are presented as a case study to exam-ine the effect of the pollution reduction measures on energy consumption and combustion efficiency.
Most of the emission control measures were in effect from July until the end of September in 2008. To minimize the impact of the biosphere on CO2, we focus on CO2and CO
observations in September instead of those in July or August. The monthly average CO mixing ratio in September was the lowest in 2008 among the four years (Wang et al., 2009). Table 4 compares mean CO2-CO correlation slopes with
un-certainties for each September over the four years. The CO2
-CO correlation slopes were calculated as the averages of the hourly CO2-CO slope for each month. The CO2-CO slope
in September 2008 was 46.4±4.6 ppmv/ppmv, higher by about a factor of two than the range of 23–29 ppmv/ppmv in September 2005–2007. The increase in the CO2/CO ratio
was driven primarily by the decrease in CO, resulting from the temporary ban of vehicles, which have low combustion efficiency compared to most other fossil energy uses, from the road. Mean mixing ratios of CO2increased by 1.6 ppmv
in September 2008 as compared to September 2007, consis-tent with the mean annual growth in CO2observed at the site
that is driven by rising global background. The increase in the CO2/CO ratio in September 2008 indicates that emission
reduction measures implemented during the Games period resulted in significant improvement in overall combustion ef-ficiency.
Table 5 compares the CO2-CO correlation slopes for
Oc-tober, November, and December in 2008 with the average slopes during the corresponding months in 2005–2007. The CO2-CO correlation slopes were calculated as the averages
of the hourly CO2-CO slope for each month. The CO2/CO
correlation slope declined after the Olympics, as the tem-porary emission reduction measures such as traffic controls were relaxed. However, dCO2/dCO of October, November
and December 2008 were still higher than previous years, im-plying that the emission reduction measures associated with the Olympics had long lasting effects on improved combus-tion efficiency in Beijing as discussed above.
6 Concluding remarks
We have analyzed temporal variations of CO2 and its
cor-relation with CO at Miyun, a rural site near Beijing, based on continuous measurements over a period of 51 months (Dec 2004 through Feb 2009). The site is located 100 km northeast of Beijing’s urban center, well situated to measure both the urban pollution and the relatively clean continen-tal background. Compared with CO2mixing ratios reported
by ESRL for background sites at similar latitudes, monthly mean CO2 mixing ratios at Miyun are 10 ppmv higher on
2
Table 4.Mean CO2and CO mixing ratio and their correlations for September, 2005–2008. CO2-CO scatter plots for September observations
in individual years are shown in supplementary material S.4.
2005 2006 2007 2008
CO (ppbv) Mean 586.80 482.14 615.10 385.25
Median 450.52 441.49 566.09 303.03
25-percentile 124.55 180.27 309.22 179.68
75-percentile 821.15 640.87 813.32 553.13
CO2 (ppmv) Mean 390.01 386.82 395.76 397.41
Median 389.33 386.05 394.02 397.12
25-percentile 381.81 377.63 385.85 385.94
75-percentile 396.80 394.7 402.78 407.18
dCO2/dCO (ppmv/ppmv) 23.9±8.4 27.7±10.0 28.8±5.6 46.4±4.6
R 0.84±0.05 0.65±0.11 0.56±0.14 0.76±0.06
Table 5.dCO2/dCO for October, November, and December, 2005–
2008. CO2-CO scatter plots for observations in individual years are
shown in supplementary material S.4.
dCO2/dCO (ppmv/ppmv) Oct Nov Dec
Average for 2005–2007 24.8±4.3 21.5±5.2 23.2±2.4
2008 38.7±5.5 30.9±2.7 29.6±1.4
The overall CO2-CO correlation is significant for winter
months, but degraded by the influence of photosynthesis and respiration in the growing season. However, CO2-CO
corre-lations segregated by local time can still provide useful in-formation with statistical significance for the CO2-CO
rela-tionship during the growing season. The intercept (CO2,i)
defines a component in total CO2that is independent of CO,
combining transport from background, and net effect of bio-genic sources and sinks as well as any combustion sources that are CO free. The diurnal range of CO2,i has an
ampli-tude near zero in the winter when both combustion and biotic emissions are relatively constant. The amplitude of diurnal cycle for CO2,iis 38 ppmv in the summer when the
magni-tude of surface CO2exchange is large and the sign changes
between night and day.
Background CO2levels (CO2,b)at Miyun as derived from
CO2,i are comparable with CO2 levels observed at UUM,
an upwind background site 640 km northwest of Miyun, in terms of both magnitude and seasonality. The difference can be used as a diagnostic for the net source/sink of CO2across
Mongolia and China north of the Miyun site. The difference between CO2,band overall CO2at Miyun reflects
combus-tion contribucombus-tions from local and regional sources in north China. Mean CO2 observed at the site exceeds CO2,b
be-cause local to regional sources influence the high values of CO2mixing ratio. Annual growth of overall mean CO2is
in-creasing by 2.7 ppm yr−1while CO2,bis only increasing by
1.7 ppm yr−1. The mean growth rate for CO2for the northern
mid-latitude ESRL background stations is 1.6 ppm yr−1over the same period. Faster growth of mean CO2suggests
rela-tively faster increase in the regional CO2 sources in
north-ern China than the global average. Bottom-up studies of CO2emissions (Marland et al., 2007) suggested annual
in-crease in Chinese fossil CO2 emissions is a factor of 2.5
(8/3.2=2.5) larger than the global average in 2006. The Miyun data, however, suggests a much smaller difference of 1.6 (2.7/1.7=1.6). As this is a simple comparison, the dis-crepancy can be due to multiple factors such as the uncertain-ties in emission estimates, representativeness error of Miyun data for whole China, and the role of biosphere on regional and global CO2.
For the group of air masses coming from the northern China boundary layer as segregated using back trajectory analysis (NCN air masses), mean winter CO2/CO
correla-tion slopes (dCO2/dCO) increased by 2.8±0.9 ppmv/ppmv
or 11% from 2005–2006 to 2007–2008. The increase in dCO2/dCO was caused primarily by decrease in CO over the
study period, offsetting the slowing down of CO2growth rate
between 2007–2008. As CO is a tracer of inefficient combus-tion, the observed trend of increase in dCO2/dCO at Miyun
suggests improvement in overall combustion efficiency over northern China during the study period. The increase in dCO2/dCO resulted from pollution reduction measures
as-sociated with the 2008 Summer Olympics and Paralympic Games in Beijing. On one hand, some measures such as the gradual phasing out of inefficient and polluting factories and boilers were implemented in stages in advance of the ac-tual Games, leading to the changes in dCO2/dCO observed
for winter 2007–2008. On the other hand, there were ag-gressive, temporary policies instituted during the two months of the Games, such as traffic bans. We found that the tem-porary pollution reduction measures resulted in increases in dCO2/dCO by a factor of two in September 2008, relative to