ACPD
13, 27287–27326, 2013In-situ measurement of atmospheric CO2
at the four WMO/GAW stations in China
S. X. Fang et al.
Title Page
Abstract Introduction
Conclusions References
Tables Figures
◭ ◮
◭ ◮
Back Close
Full Screen / Esc
Printer-friendly Version Interactive Discussion
Discussion
P
a
per
|
D
iscussion
P
a
per
|
Discussion
P
a
per
|
Discuss
ion
P
a
per
|
Atmos. Chem. Phys. Discuss., 13, 27287–27326, 2013 www.atmos-chem-phys-discuss.net/13/27287/2013/ doi:10.5194/acpd-13-27287-2013
© Author(s) 2013. CC Attribution 3.0 License.
Atmospheric Chemistry and Physics
Open Access
Discussions
This discussion paper is/has been under review for the journal Atmospheric Chemistry and Physics (ACP). Please refer to the corresponding final paper in ACP if available.
In-situ measurement of atmospheric CO
2
at the four WMO/GAW stations in China
S. X Fang1, L. X. Zhou1, P. P. Tans2, P. Ciais3, M. Steinbacher4, L. Xu1, and
T. Luan1
1
Chinese Academy of Meteorological Sciences (CAMS), China Meteorological Administration (CMA), Beijing, China
2
Earth System Research Laboratory (ESRL), National Oceanic and Atmospheric Administration (NOAA), Boulder, CO, USA
3
Laboratory for the Science of Climate and the Environment (LSCE), Paris, France
4
Empa, Swiss Federal Laboratories for Materials Science and Technology, Laboratory for Air Pollution/Environmental Technology, Duebendorf, Switzerland
Received: 31 August 2013 – Accepted: 14 October 2013 – Published: 21 October 2013
Correspondence to: L. X. Zhou ([email protected])
ACPD
13, 27287–27326, 2013In-situ measurement of atmospheric CO2
at the four WMO/GAW stations in China
S. X. Fang et al.
Title Page
Abstract Introduction
Conclusions References
Tables Figures
◭ ◮
◭ ◮
Back Close
Full Screen / Esc
Printer-friendly Version Interactive Discussion
Discussion
P
a
per
|
D
iscussion
P
a
per
|
Discussion
P
a
per
|
Discuss
ion
P
a
per
Abstract
Atmospheric carbon dioxide (CO2) mole fractions were continuously measured from January 2009 to December 2011 at 4 atmospheric observatories in China ((Lin’an, LAN), (Longfengshan, LFS), (Shangdianzi, SDZ), and (Waliguan, WLG)) using Cavity Ring Down Spectroscopy instruments. All sites are regional (LAN, LFS, SDZ) or global
5
(WLG) measurement stations of the World Meteorological Organization/Global Atmo-sphere Watch program (WMO/GAW). LAN is located near the megacity of Shanghai, in China’s most economically developed region. LFS is in a forest and rice production area, close to the city of Harbin in the northern east of China. SDZ is located 150 km north east of Beijing. WLG, hosting the longest record of measured CO2 mole
frac-10
tions in China, is a high altitude site in northwest China recording background CO2 values. The CO2 growth rates are 2.2±0.2 ppm yr
−1
for LAN, 2.3±0.2 ppm yr−1 for LFS, 2.0±0.2 ppm yr−1 for SDZ, and 1.2±0.1 ppm yr−1 (1σ) for WLG, during the pe-riod of 2009 to 2011. The growth rate at WLG may be underestimated due to the data gaps during the observation period. The highest annual mean CO2 mole fraction of
15
404.1±4.1 ppm was observed at LAN in 2011. A comprehensive analysis of CO2 vari-ations, their diurnal and seasonal cycles as well as the analysis of the influence of different wind regimes on the CO2mole fractions allows a thorough characterization of the sampling sites and of the key processes driving the CO2mole fractions. These data form a basis to improve our understanding of atmospheric CO2variations in China and
20
the underlying fluxes, using atmospheric inversion models.
1 Introduction
Carbon dioxide (CO2) represents the most important contribution to increased radia-tive forcing (IPCC, 2007). The increase of atmospheric CO2of∼110 ppm above pre-industrial level has been unequivocally attributed to human emissions (GLOBALVIEW,
25
ACPD
13, 27287–27326, 2013In-situ measurement of atmospheric CO2
at the four WMO/GAW stations in China
S. X. Fang et al.
Title Page
Abstract Introduction
Conclusions References
Tables Figures
◭ ◮
◭ ◮
Back Close
Full Screen / Esc
Printer-friendly Version Interactive Discussion
Discussion
P
a
per
|
D
iscussion
P
a
per
|
Discussion
P
a
per
|
Discuss
ion
P
a
per
|
land-use changes (Houghton, 2003; Peters et al., 2012). The oceans and terrestrial ecosystems act as sinks for atmospheric CO2 and absorb approximately half of the anthropogenic emissions (Ballantyne et al., 2012). To enhance our understanding of the carbon cycle, it is crucial to quantify atmospheric CO2 variations as they are in-fluenced by regional fluxes (Peters et al., 2007; Tans et al., 1990). For this purpose,
5
55 yr ago, long-term measurements of atmospheric CO2concentration began at Mauna Loa, Hawaii (Keeling et al., 1976; Keeling, 2008). So far there are more than 150 sites around the world where greenhouse gas concentrations are measured (Artuso et al., 2009; Dlugokencky et al., 1995; Necki et al., 2003; Sirignano et al., 2010; Tans et al., 1990; WMO, 2012). Studies show that the current global CO2 observation network
10
can at best constrain emissions at continental scales, and that tropical regions remain unconstrained because observations in that region are too sparse (Chevallier et al., 2011; Thompson et al., 2009). Regional networks with ongoing CO2observations mea-sure gradients between stations, which can be used to retrieve information on regional emissions and sinks. At present, relatively dense networks exist over North America
15
and Western Europe, which allow us to constrain regional fluxes using inverse models (e.g. Broquet et al., 2013; Gourdji et al., 2012). But North East Asia, a region of fast economic growth with high emissions, is not adequately sampled, and global inversion results give divergent results for its CO2 budget (e.g. Peylin et al., 2013; Sirignano et al., 2010).
20
With the rapid development of its economy, China has become the number one fossil fuel CO2emitter in 2006 and emitted 1.8 Pg C in 2011 (Le Quéré et al., 2013; Marland, 2012). Nevertheless, the emissions of China deduced from energy statistics are uncer-tain, and could be higher than currently reported by up to 0.38 Pg C yr−1 (Guan et al., 2012). Peters et al. (2011) also reported that more than half of the growth in global CO2
25
ACPD
13, 27287–27326, 2013In-situ measurement of atmospheric CO2
at the four WMO/GAW stations in China
S. X. Fang et al.
Title Page
Abstract Introduction
Conclusions References
Tables Figures
◭ ◮
◭ ◮
Back Close
Full Screen / Esc
Printer-friendly Version Interactive Discussion
Discussion
P
a
per
|
D
iscussion
P
a
per
|
Discussion
P
a
per
|
Discuss
ion
P
a
per
Liu et al., 2009; Tang et al., 2006; Xing et al., 2005). Long-term atmospheric CO2 obser-vations in China have been relatively sparse. The China Meteorological Administration (CMA) has been responsible for background greenhouse gas measurements. The first station installed in China is Mt. Waliguan (WLG) in the Qinghai province, at 3816 m a.s.l. Since May 1991 CMA has collected weekly air samples in glass flasks. These samples
5
were shipped to the National Oceanic and Atmospheric Administration (NOAA) Earth System Research Laboratory (ESRL) in Boulder, Colorado, United States and analyzed for a suite of greenhouse gases. In 1994, the station was established as a global World Meteorological Organization (WMO)/Global Atmosphere Watch (GAW) measurement site, and was equipped with CO2 situ measurements [LI-COR, nondispersive
in-10
frared (NDIR) analyzer]. This instrument produced nearly fourteen years of high quality data, which is the longest continuous atmospheric CO2 record in China (Zhou et al., 2003, 2005, 2006). In 2009, the aging instrument was replaced by a Cavity Ring Down Spectroscopy (CRDS) analyzer (G1301, Picarro Inc.). Three GHGs continuous mea-surement stations were established as regional WMO/GAW sites at Lin’an (LAN) in
15
Zhejiang province (near Shanghai), Longfengshan (LFS) in Heilongjiang province (near Harbin, in the Northeast of China), and Shangdianzi (SDZ) near Beijing, respectively. Initially, those were automatic weather stations only, and in-situ CO2measurement sys-tems began in 2009 using CRDS instruments (G1301). In this study, we present and analyze the first 3 yr of measurements at the four stations.
20
2 Experimental
2.1 Sampling sites
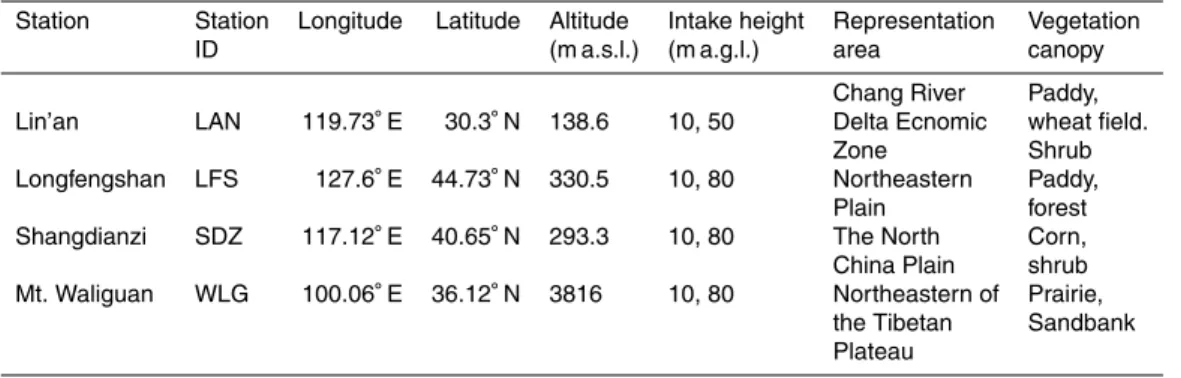
Locations of the Lin’an (LAN), Longfengshan (LFS), Shangsianzi (SDZ) and Mt. Waliguan (WLG) are shown in Fig. 1. LAN is located in the center of Yangzi Delta area, China and is about 50 km from Hangzhou (Capital of Zhejiang Province) and 200 km
25
ACPD
13, 27287–27326, 2013In-situ measurement of atmospheric CO2
at the four WMO/GAW stations in China
S. X. Fang et al.
Title Page
Abstract Introduction
Conclusions References
Tables Figures
◭ ◮
◭ ◮
Back Close
Full Screen / Esc
Printer-friendly Version Interactive Discussion
Discussion
P
a
per
|
D
iscussion
P
a
per
|
Discussion
P
a
per
|
Discuss
ion
P
a
per
|
6 km northeast of the town of Lin’an, which has a population of∼100 000. Lin’an is a
tourist town and has no industries with strong CO2emissions. North of the LAN station (1.4 km away) is a small factory where charcoal is manufactured from bamboo wood. The station is built on the top of a small hill with pieces of paddy rice field surrounded.
LFS is 140 km southeast of Harbin city. Wuchang, the nearest city, has ∼200 000
5
inhabitants and is 40 km to northwest of the site. The station is located on the northwest edge of the Longfengshan water reservoir, which has an area of 20 km2. The reservoir’s dam is located 0.1 km to the north of LFS. Right beyond the dam to the north, there is a small area of paddy rice field and several small villages (100 inhabitants). The station is located in a forest park with mainly pine trees.
10
SDZ is located at 150 km northeast of Beijing. The observatory is built on a mountain-side (with the highest peak on the north). There is a small village (∼300 inhabitants) at about 0.8 km the south of the station. A railway used by diesel-driven trains runs from south to north,∼0.6 km away from the station. Local vegetation is mainly shrubs and
corn.
15
WLG is situated in western China at 3816 m a.s.l., remotely from industrial and popu-lated centers. Measurements from WLG provide essential information on sources and sinks over the Eurasian continent (Zhou et al., 2004, 2005). At SDZ, LAN and LFS, the sampling inlets were initially fixed on the top of wind poles (10 m above the ground). Near each sampling inlet, a wind direction and speed sensor were also installed. The
20
distance from the wind pole to the nearby observatory buildings are 60, 25 and 65 m for SDZ, LAN, and LFS, respectively, to ensure that the air sample is minimally affected by human activities in the buildings. In 2010, new sampling towers of 50 m and 80 m height were erected at LAN and LFS, respectively. In 2011, an 80 m sampling tower was built at SDZ. A second sampling inlet was installed at the top level of each tower,
25
ACPD
13, 27287–27326, 2013In-situ measurement of atmospheric CO2
at the four WMO/GAW stations in China
S. X. Fang et al.
Title Page
Abstract Introduction
Conclusions References
Tables Figures
◭ ◮
◭ ◮
Back Close
Full Screen / Esc
Printer-friendly Version Interactive Discussion
Discussion
P
a
per
|
D
iscussion
P
a
per
|
Discussion
P
a
per
|
Discuss
ion
P
a
per
air sample inlet is fixed at an 80 m height of an 89 m sampling tower located 15 m from the laboratory.
2.2 Measurement system
CRDS systems (G1301, Picarro Inc.) are used for continuous measurements of atmo-spheric CO2 and CH4. This type of instrument has been proven suitable for making
5
precise measurement of CO2and CH4mole fraction since its response is both highly linear and very stable (Chen et al., 2010; Crosson, 2008). The detailed schematic of the measurement setup is described in Fang et al. (2003). The residence time of the air from the top of the inlets to inlet of the Picarro is less than 30 s. The individual systems were installed in 1 January 2009 at LAN, LFS, SDZ, and WLG, respectively, and are
10
still running. In this study, the analysis is restricted to the January 2009 to December 2011 period.
2.3 Calibration, quality control and data processing
Carbon dioxide mole fractions are referenced to a Working High standard (WH) and a Working Low standard (WL). Additionally, a calibrated cylinder filled with compressed
15
ambient air is used as a target gas (T) to check the precision and stability of the system routinely. All standard gases are pressurized in 29.5 L treated aluminum alloy cylinders (Scott-Marrin Inc.) fitted with high-purity, two-stage gas regulators. The standard gases are calibrated with cylinders assigned by the GAW CO2Central Calibration Laboratory operated by NOAA/ESRL. All data are reported on the WMO X2007 scale (Zhao and
20
Tans, 2006; Zhao et al., 1997). Calibration of the working standards and target gases is done at CMA’s Central Laboratory in Beijing before and after use at the measurement stations. An automated sampling module equipped with a VICI 8 port multi-position valve is designed to sample from separate gas streams (standard gas cylinders and ambient air). The three standards are analyzed by the system for 5 min every 6 h.
ACPD
13, 27287–27326, 2013In-situ measurement of atmospheric CO2
at the four WMO/GAW stations in China
S. X. Fang et al.
Title Page
Abstract Introduction
Conclusions References
Tables Figures
◭ ◮
◭ ◮
Back Close
Full Screen / Esc
Printer-friendly Version Interactive Discussion
Discussion
P
a
per
|
D
iscussion
P
a
per
|
Discussion
P
a
per
|
Discuss
ion
P
a
per
|
The discrete flask samples collected weekly at WLG have been measured by the Carbon Cycle Greenhouse Gases group (CCGG) of NOAA/ESRL in Boulder, CO, USA. Two flask samples were collected in series at 08:00 local time (LT) using glass flasks and a portable battery powered sampling apparatus with a 5 m (a.g.l.) intake height (Dlugokencky et al., 1994). The samples were measured at NOAA using a
non-5
dispersive infrared (NDIR) analyzer, with a repeatability of approximately 0.1 ppm (Zhou et al., 2005). The average time between sampling and analysis is about 2 months. All CO2measurements are also tied to the WMO CO2scale X2007. The co-located NOAA flask program at WLG ensures that the long-term CMA in -situ measurements can be routinely compared with an independent record.
10
Because of dead volumes in the in-situ sampling system, the response of the ana-lyzer is usually not stable until 1 min after switching to a different gas source using the multi-position valve. Every standard gas cylinder was measured for 5 min and the data processing routine used the last 3 min of each 5 min segment to compute CO2 mole fractions. The same is done for the ambient air data after switching in 5 min intervals
15
from one sampling height to the other and after the reference gas measurements. The ambient measurements were calibrated using a linear two-point fit through the most recent standard gas measurements (WH & WL). Ambient CO2 measurements were retained only during periods when the measurement of the most recent target gas (T) using this same calibration procedure was within±0.1 ppm of its assigned value. 20
Ambient air data were recorded as 5 min averages. More than 97 % of the total 5 min average data points were retained for meeting this criterion at the four stations.
After computing the CO2 mole fractions, the data were manually inspected. Occa-sionally, analytical or sampling problems, including poor instrument performance or local influences such as nearby fires, vehicles, and cattle identified according to the
25
ACPD
13, 27287–27326, 2013In-situ measurement of atmospheric CO2
at the four WMO/GAW stations in China
S. X. Fang et al.
Title Page
Abstract Introduction
Conclusions References
Tables Figures
◭ ◮
◭ ◮
Back Close
Full Screen / Esc
Printer-friendly Version Interactive Discussion
Discussion
P
a
per
|
D
iscussion
P
a
per
|
Discussion
P
a
per
|
Discuss
ion
P
a
per
peak-to-peak amplitude, we used the curve fitting method described by Thoning et al. (1989). The data were first fitted to a function with 3 polynomial terms and 4 har-monic terms. Residuals from the function were then filtered (smoothed) in the time domain using two different low pass filters (Butterworth filter, which computes weighted averages over 1.07 yr at Full Width at Half Maximum of the weighting function, and the
5
second filter 1.5 month at FWHM). The smoothed residuals are then added to the func-tion to obtain smoothed time series with the seasonal cycle removed (1.07 yr FWHM) or representative of about monthly values for the second filter, as seen in Fig. 2. All of the averaged data in this study were reported with 95 % confidence intervals (CI).
3 Results and discussions
10
3.1 Carbon dioxide data
Fig. 2 shows the hourly averages of the processed ambient air CO2 data at the 4 stations. The data gaps at WLG are due to a malfunction of the instrument. Valid flask sample pair measurements at WLG during the same period are also shown. To test the data quality of the Picarro system, differences between discrete flask measurements
15
from NOAA ESRL and corresponding hourly CO2values from the Picarro instrument at WLG are studied. During most of time, differences between flasks and in-situ systems vary by±1 ppm. The mean value of the difference (flask minus in-situ) is 0.1±0.1 ppm
(95 % CI, the same as below) for 168 sampling events (336 flasks). This result sug-gests that NOAA flask and CMA in-situ measurements at WLG are in good agreement
20
and the CMA calibration and quality control procedures are well implemented without generating systematic biases. The differences between the two data sets are likely due to the sampling height and method (Zhou et al., 2005). The discrete flask sampler col-lects air 5 m above the ground while the in-situ system is measuring air at 80 m. Due to unique topography at WLG station (located at the top of mountain Waliguan in
Ti-25
ACPD
13, 27287–27326, 2013In-situ measurement of atmospheric CO2
at the four WMO/GAW stations in China
S. X. Fang et al.
Title Page
Abstract Introduction
Conclusions References
Tables Figures
◭ ◮
◭ ◮
Back Close
Full Screen / Esc
Printer-friendly Version Interactive Discussion
Discussion
P
a
per
|
D
iscussion
P
a
per
|
Discussion
P
a
per
|
Discuss
ion
P
a
per
|
before the updraft in the daytime may bring the local contaminations from the valley. The NOAA flask sampler collects air samples almost instantaneously (sampling period < 1 min) whereas the Picarro system generally has a continuous coverage during each hour. Thus, a part of the differences can be most likely explained by the atmospheric CO2fluctuations.
5
3.2 Mean diurnal cycles
The mean diurnal cycles of CO2 variations in April, July, October, and January are used to represent the average variations in spring, summer, autumn, and winter. Only days containing 24 hourly average values are used, because the day-to-day variations of CO2can be quite large. The mean diurnal variations are shown in Fig. 3. Generally,
10
diurnal variations of atmospheric CO2 are affected by two factors: local sources/sinks and short/medium range transport (Artuso et al., 2009; Gerbig et al., 2006). In summer, the CO2 diurnal variation has a similar phase between the sites, with peak value in the early morning and minima in afternoon. After sunrise, photosynthetic CO2 uptake and mixing of near surface air with lower concentrations aloft makes the CO2 mole
15
fractions decrease gradually and reach a stable minimum at about 14:00–16:00 LT. In the late evening, when respiration dominates and the boundary layer becomes neutral or stable, CO2increases near the surface, and reaches a maximum at 06:00–07:00 LT in the morning, except at LFS where maximum values are observed at∼05:00 LT. The earlier maximum at LFS is likely due to an earlier sunrise time.
20
The LAN station is located in the subtropics. Compared with the other three stations, variations of air temperature (yearly average: 14◦C and solar radiation are relatively small during the year. As a result, photosynthetic/respiration fluxes are active (Kerang et al., 2004) in all seasons and diurnal CO2 variations are thus significant through-out the year. The peak to peak mean diurnal amplitudes are 20.7±5.0, 43.2±6.4,
25
20.0±4.0 and 8.3±4.6 ppm for spring, summer, autumn and winter, respectively. The
ACPD
13, 27287–27326, 2013In-situ measurement of atmospheric CO2
at the four WMO/GAW stations in China
S. X. Fang et al.
Title Page
Abstract Introduction
Conclusions References
Tables Figures
◭ ◮
◭ ◮
Back Close
Full Screen / Esc
Printer-friendly Version Interactive Discussion
Discussion
P
a
per
|
D
iscussion
P
a
per
|
Discussion
P
a
per
|
Discuss
ion
P
a
per
Distinct CO2variations at LFS are also observed in summer. The diurnal amplitude is 50.6±7.0 ppm, which is larger than at the other three stations. This is likely due to the active CO2 fluxes from nearby paddy rice fields and forests (Yue et al., 2005). The LFS station is located in the most important rice production area (> 40 000 km2) of China. In spring and autumn, the CO2 diurnal variations are moderate, and display
5
maxima in the morning and minima in the afternoon with a peak to peak amplitude of 4.5±1.9 ppm in spring and 7.3±4.8 ppm in autumn. There is no clear diurnal CO2 variation in winter (< 1.9±2.9 ppm), which reflects weak local sources at LFS station.
The SDZ station exhibits complex CO2 variations in the four seasons. In summer, the confidence intervals of the hourly averages (error bars in Fig. 3) are the highest
10
among the four stations. The mean standard deviations for hourly CO2values are 9.5, 21.5, 15.9 and 12.7 ppm for spring, summer, autumn and winter, respectively which is much higher than for the other stations. These large values imply that the day to day variations of CO2 are large compared to the periodic diurnal cycle. It can also be inferred that this site may be influenced by nearby emissions. In spring and autumn,
15
the diurnal variations have amplitudes of 5.5±3.7 and 8.8±6.7 ppm, respectively. The larger diurnal variation in autumn may be due to the straw burning in the northern China plain (Cao et al., 2008; Li et al., 2008). In summer and winter, the standard deviations of the hourly averages are so large that the daily amplitudes could not be calculated.
The WLG high mountain station receives well-mixed air masses from the lower
tro-20
posphere, with very small diurnal variability (see also Keeling et al., 1976). CO2 are systematically lower than at the three regional near surface stations. Diurnal cycles are small throughout the year with largest intensity in summer when a diurnal amplitude of 3.4±1.4 ppm is recorded. Observed seasonal and diurnal variations are similar to those observed from 1994 to 2000 reported by Zhou et al. (2002). Nevertheless, the
25
ACPD
13, 27287–27326, 2013In-situ measurement of atmospheric CO2
at the four WMO/GAW stations in China
S. X. Fang et al.
Title Page
Abstract Introduction
Conclusions References
Tables Figures
◭ ◮
◭ ◮
Back Close
Full Screen / Esc
Printer-friendly Version Interactive Discussion
Discussion
P
a
per
|
D
iscussion
P
a
per
|
Discussion
P
a
per
|
Discuss
ion
P
a
per
|
3.3 Comparison of CO2mole fractions between different levels
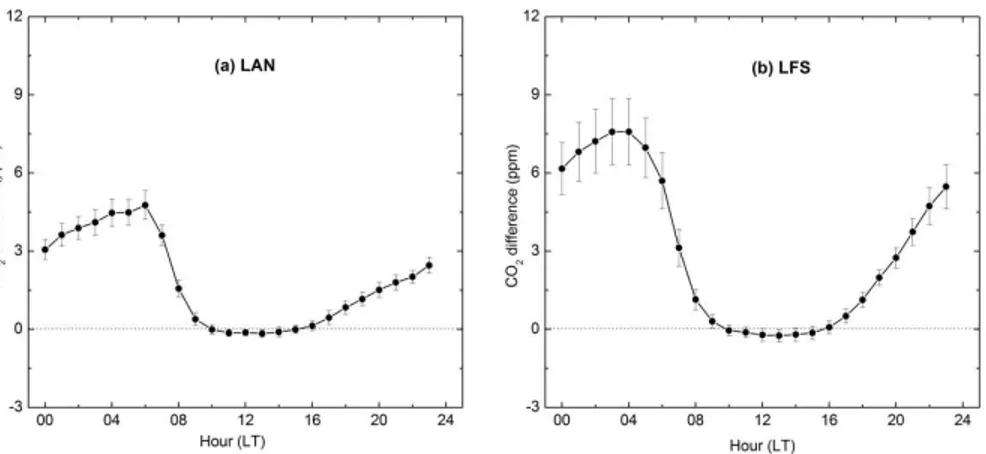
To understand the effect of local sources on observed CO2 values, the hourly diff er-ences (over 1 yr record) between 10 m and the top of the sampling tower (50 m for LAN and 80 m for LFS) are shown in Fig. 4 (excepted for SDZ where the record is too short which only contains six months). Generally, CO2 mole fractions at 10 m are
5
higher than the top levels. The differences at LAN and LFS show distinct diurnal vari-ations with large positive values at night (or early morning) and smaller values in the daytime, partly driven by the coupling between respired CO2emitted at night that usu-ally accumulates in a shallow stable nocturnal boundary layer and net CO2 uptake and efficient vertical mixing during daytime. At night, the maximum differences are
10
4.8±0.5 ppm for LAN and 7.6±1.3 ppm for LFS. The larger difference at LFS reflects there are stronger sources near the LFS observatory. Nevertheless, the height of top level at LAN (50 m) may also contribute to the smaller difference. In the midday, dif-ferences at the two regional stations are the smallest and relatively stable. The values are less than 0.2±0.2 ppm from 10 to 16:00 LT at LAN and 0.3±0.2 ppm from 09:00
15
to 16:00 LT at LFS. Given the CO2 diurnal variations at the two regional stations, the observed data during these periods should be the least influenced by local sources. These significant differences between 10 m and 50/80 m due to the covariance of local vegetation fluxes with vertical mixing prevents inversion models to use night-time data at 10 m for regional flux estimates. Data during daytime at 10 m could be used in
inver-20
sions with a bias correction of 0.2 to 0.3 ppm. The magnitude of this correction has to be compared with mean daytime CO2 spatial gradients between stations, upon which are constrained inversion fluxes.
3.4 Impact of local surface wind
To understand the influence of local surface wind on the observed CO2results, average
25
ACPD
13, 27287–27326, 2013In-situ measurement of atmospheric CO2
at the four WMO/GAW stations in China
S. X. Fang et al.
Title Page
Abstract Introduction
Conclusions References
Tables Figures
◭ ◮
◭ ◮
Back Close
Full Screen / Esc
Printer-friendly Version Interactive Discussion
Discussion
P
a
per
|
D
iscussion
P
a
per
|
Discussion
P
a
per
|
Discuss
ion
P
a
per
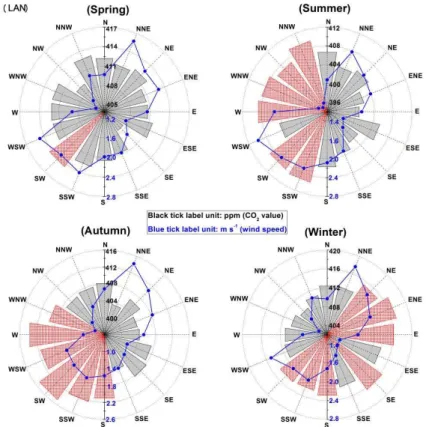
Spring: March to May, Summer: June to August, Autumn: September to November, Winter: December to February are plotted in Figs. 5 to 8.
At LAN, in the four seasons, winds from the SW-SSW are associated with higher CO2 mole fractions relative to the seasonal average (Fig. 5). Especially in autumn, the maxi-mum enhancement relative to the seasonal average (407.5±0.4 ppm) is 7.4±1.6 ppm
5
when winds are from SW sector. This direction is the town of Lin’an, 6 km away. The higher wind speed (average > 1.6 m s−1) in the four seasons (Fig. 5) may easily bring emissions from there. It is interesting to note that during the winter, the wind rose dis-tribution pattern is different from the other seasons with higher CO2 values on north-east direction. The maximum CO2is from the ENE sector, with values of 3.7±1.7 ppm 10
higher than the average seasonal value (413.9±0.3 ppm). The higher values from the
NE to E sectors are likely due to the transport of CO2 emitted from Shanghai and Hangzhou cities (200 and 50 km from the station) whereas in the other seasons, veg-etation uptakes atmospheric CO2 and weakens the regional source strength signal during transport.
15
At LFS, in spring, summer and autumn, higher CO2 is observed when winds are from the E to SSE sector (Fig. 6). A previous study also found that atmospheric CH4 mole fraction in the SSE sector was much higher than in the other sectors (Fang et al., 2013). The LFS station is surrounded by forest and paddy rice fields, which are strong sinks for atmospheric CO2. As a result, the lack of forests and paddy rice fields in the
20
E to SSE sector (the Longfengshan reservoir is located in this sector) induces higher atmospheric CO2 mole fractions. The maximum enhancement is 13±3.2 ppm on E sector relative to the average value (389±0.5 ppm) in summer. In winter, the average
air temperature is lower than−17◦C. Emissions from the soil and plants are very weak and fossil fuel local emission (coal for domestic heating) is the main factor affecting the
25
ACPD
13, 27287–27326, 2013In-situ measurement of atmospheric CO2
at the four WMO/GAW stations in China
S. X. Fang et al.
Title Page
Abstract Introduction
Conclusions References
Tables Figures
◭ ◮
◭ ◮
Back Close
Full Screen / Esc
Printer-friendly Version Interactive Discussion
Discussion
P
a
per
|
D
iscussion
P
a
per
|
Discussion
P
a
per
|
Discuss
ion
P
a
per
|
The SDZ station is located in a complex terrain with many local and regional sources and sinks. The CO2distribution per wind sector differs in the four seasons (Fig. 7). The prevailing winds during the four seasons are ENE (> 10 %) and WSW (> 17 %). The wind speeds on these sectors are also higher than most sectors. Beijing is in the WSW direction. As a result, CO2on this sector is generally higher than from all other sectors.
5
Especially in winter, CO2 value is 11.7±1.7 ppm higher from WSW than the seasonal mean (403.1±0.4 ppm). A previous study of hydrofluorocarbons (HFCs) and
perfluo-rocarbons (PFCs) at this station also observed that most compounds mole fractions are enhanced from WSW and SW directions (Yao et al., 2012). In addition, a railway (∼48 trains per day) running from south to north is at 600 m from the observatory. The 10
higher CO2 mole fractions from NW to SW sector all year round may also be partly due to emissions from diesel engine of the trains. When surface winds are from the mountain peak (north of the station), CO2 mole fractions are obviously lower than the seasonal averages. The lowest decrease is in summer with a value of 6.4±4.4 ppm
lower than the seasonal average (402±0.6 ppm). Obviously, surface winds originating
15
from north may dilute the emissions in the valley and represent a better mixed volume in this area.
CO2 mole fractions at WLG are relatively stable and have smaller variations in the four seasons. Similar to the analysis of CH4 variability (Zhou et al., 2004), winds orig-inating from NE-ENE sector are associated with CO2enhancements with a maximum
20
value of 3.6±1.0 ppm above the seasonal average (391.4±0.1 ppm) in winter (Fig. 8). This likely reflects air masses exposed to regions with higher population density. Fur-thermore, Tang et al. (1999) studied the relationship of black carbon (BC) with surface winds and long-range transport and also found that the highest BC concentrations occur with air mass originating from the NE-NNE sector. They attributed these
ele-25
ACPD
13, 27287–27326, 2013In-situ measurement of atmospheric CO2
at the four WMO/GAW stations in China
S. X. Fang et al.
Title Page
Abstract Introduction
Conclusions References
Tables Figures
◭ ◮
◭ ◮
Back Close
Full Screen / Esc
Printer-friendly Version Interactive Discussion
Discussion
P
a
per
|
D
iscussion
P
a
per
|
Discussion
P
a
per
|
Discuss
ion
P
a
per
(Xining) (150 km to the northeast) are easily transported to the WLG and hence can cause elevated CO2. In winter, in addition to NE-ENE sector, CO2values on E-ESE-SE sectors are also obviously higher. It is probably due to the emissions from coal burning for heating in Guide County, which is 5 km away east to the station.
Hourly CO2 mole fractions during the three years were also calculated for different
5
wind speeds (Beaufort scale): 0 scale: < 0.3 m s−1, 1st scale: 0.3 to 1.5 m s−1, 2nd scale: 1.6 to 3.3 m s−1, 3rd scale: 3.4 to 5.4 m s−1, 4th scale: 5.5 to 7.9 m s−1, 5th scale: 8.0 to 10.7 m s−1, 6th scale: 10.8 to 13.8 m s−1,≥7th scale:≥13.9 m s−1. Results show
that the observed CO2value is strongly dependent on the wind speed at the four sta-tions. At LAN, LFS and SDZ, lower CO2 values are always accompanied with higher
10
wind speed in the four seasons, even in summer when the local photosynthesis is very active. These results prove that higher wind speed (and longer range transport) may dilute the local emissions. Even in summer, the local anthropogenic emissions may be so strong that it plays a more important role than the biogenic sinks and sources. From the yearly average, the average CO2 mole fractions are 416.2±1.0, 402.7±3.9
15
and 411.0±1.3 ppm, respectively in calm conditions (scale-0). When the wind is on Beaufort scale 5, the average values are 397.1±3.5, 397.2±1.3 and 398.9±1.4 ppm
for LAN, LFS and SDZ, respectively. For WLG, in winter and spring, decreasing CO2 values are also observed with increasing wind speed. However, during summer and autumn, an opposite behavior is observed. CO2increases with increasing wind speed,
20
which may reflect that the local photosynthesis dilute the anthropogenic signals. For example, in summer, the average CO2 mole fraction is 384.5±1.5 ppm at calm condi-tion (scale-0) and 388.2±0.9 ppm on wind scale 7. The higher wind speed may bring
emissions from a larger regional area (such as emissions from Northwest of China, Xining city of Qinghai province) and contribute to the higher CO2mole fractions.
25
ACPD
13, 27287–27326, 2013In-situ measurement of atmospheric CO2
at the four WMO/GAW stations in China
S. X. Fang et al.
Title Page
Abstract Introduction
Conclusions References
Tables Figures
◭ ◮
◭ ◮
Back Close
Full Screen / Esc
Printer-friendly Version Interactive Discussion
Discussion
P
a
per
|
D
iscussion
P
a
per
|
Discussion
P
a
per
|
Discuss
ion
P
a
per
|
the atmospheric CO2 burden in China, in the following the data were split into two subsets.
3.5 Evaluation of “regional” mole fractions
A data filtering approach was applied to the CO2 data at the three regional stations (SDZ, LFS and LAN), to divide the time series into periods under predominantly “local”
5
and “regional” influence. Regional episodes rather represent CO2levels driven primar-ily by distant sources and sinks (>∼10 km), while the CO2 mole fractions during local episodes are more strongly influenced by local sources and sinks (≤∼10 km).
Com-paring measurements from the 10 m intake and the top level of the sampling tower show that during the midday when the boundary layer is high, atmospheric CO2 mole
10
fractions are the least influenced by local sources and the differences between the two levels are at a minimum. However, even during mid-day there is still a mixture of regional and local evens because the local sources and sinks are so strong at the re-gional stations. To get “the least influenced” CO2mole fractions, the local surface wind speed and wind rose distribution patterns are further used to flag the data.
15
Based on the analysis of the observed diurnal cycles and the comparison of the CO2mole fractions at the different inlet heights (Sects. 3.2 and 3.3), hourly data were considered to be regionally representative during daytime hours, i.e. from 09:00 LT to 17:00 LT at LAN and during 08:00 LT and 17:00 LT at LFS and SDZ. As discussed in Sect. 3.2, WLG is a remote measurement station with only small diurnal variations of
20
atmospheric CO2 mole fractions except in summer, when a systematic pattern is ob-served. Thus for WLG, only data from 06:00 to 07:00 LT in summer are considered to be under local influence when the observed CO2 mole fractions are about 1.9±0.8 ppm higher than the seasonal average (385.2±0.1 ppm). All other data are treated as
re-gionally representative.
25
ACPD
13, 27287–27326, 2013In-situ measurement of atmospheric CO2
at the four WMO/GAW stations in China
S. X. Fang et al.
Title Page
Abstract Introduction
Conclusions References
Tables Figures
◭ ◮
◭ ◮
Back Close
Full Screen / Esc
Printer-friendly Version Interactive Discussion
Discussion
P
a
per
|
D
iscussion
P
a
per
|
Discussion
P
a
per
|
Discuss
ion
P
a
per
LFS and SDZ, CO2data are rejected when surface winds speeds are below 1.5 m s −1
(scale-0 & 1). At WLG, as discussed above, higher wind speeds may also transport emissions from the broader region and induce higher CO2 mole fractions. Thus the CO2 mole fractions are excluded to be regional when surface wind speeds are below 1 scale or over scale 6.
5
Finally, the CO2values are considered to be locally influenced when CO2mole frac-tions from a specific wind sector are higher than the corresponding seasonal means for all sectors. At LAN, these are SW sector for spring, SW to SSW and W to NNW sector for summer, S to WNW sector for autumn, and SW to S, SE, E to NE sector for winter (Fig. 5). At LFS, they are E to ESE and SSE sector for spring, E to SSE sector
10
for summer and autumn, WNW to N sector for winter (Fig. 6). At SDZ, they are ENE to S, and WSW to W sector for spring, WNW to SSE sector for summer, SE, S, and SW to W sector for autumn, S to NW sector for winter (Fig. 7). At WLG, CO2data were split into “regional” and “local” according to the previous suggestion by Zhou et al. (2004). The locally influenced sectors there are NNE to NE sector for spring, NE to ENE, and
15
SSW to NW sector for summer, NE to ENE sector for autumn, and NE to SE sector for winter (Fig. 8).
After the three steps filter, one subset for each station is considered to be minimally influenced by local sources, measured during so-called regional events. For the 3 re-gional stations, about 16.4 %, 24.7 % and 18.5 % of hourly CO2 data are selected as
20
regionally for LAN, LFS and SDZ, representatively. On the other hand, the large ratios of local events (possibly affected by local sources) prove that local sources strongly affect the CO2 results at 10 m intakes. The regional events at WLG account for about 62.6 % of the total values, which reflects that the observations at WLG (at 80 m intake height) represent well-mixed air masses from the lower troposphere.
ACPD
13, 27287–27326, 2013In-situ measurement of atmospheric CO2
at the four WMO/GAW stations in China
S. X. Fang et al.
Title Page
Abstract Introduction
Conclusions References
Tables Figures
◭ ◮
◭ ◮
Back Close
Full Screen / Esc
Printer-friendly Version Interactive Discussion
Discussion
P
a
per
|
D
iscussion
P
a
per
|
Discussion
P
a
per
|
Discuss
ion
P
a
per
|
3.6 Long-term trends
The long-term trend of CO2 is calculated using a linear fit to the regional data of the four stations. The regionally representative mole fractions at the four stations all show a positive trend in the last three years, of 2.2±0.2, 2.3±0.2, 2.0±0.2 and 1.2±0.1
(1σ) ppm yr−1 for LAN, LFS, SDZ and WLG, respectively. The increasing rates at the
5
three regional stations (LAN, LFS and SDZ) are similar to the global values (2.3 ppm from 2009 to 2010, and 2.0 ppm from 2010 to 2011) (WMO greenhouse gas bulletin, 2011, 2012) and to the average of the past decade (∼2.0 ppm yr−1) (WMO, 2012). The increasing rate at WLG station should be underestimated because of the several data gaps during the observation period, especially the large data gap from 1 October to 30
10
December 2011, when high CO2 mole fractions would be expected. During the same period, the CO2 growth rate from the discrete flask samples analyzed by NOAA/ESRL is∼1.8 ppm yr−1, which may be viewed as the growth rate at WLG station. The growth
rates of the data influenced by local sources are 1.6±0.1, 2.9±0.1, 4.1±0.2 and
1.3±0.1 ppm yr−1 for LAN, LFS, SDZ and WLG, respectively. The increase rates of
15
local events at LFS and SDZ are obviously higher than the global average, which may reflect that the sources in these areas increased during the last three years. Oppositely, at LAN station, the growth rate at local is a little bit smaller than regional value, which indicates the sources in this area might weaken in the last several years. Nevertheless, the differences from regional growth rates may also partly be ascribed to the different
20
wind speed component at these stations.
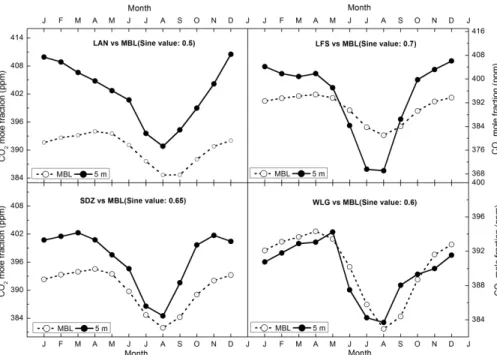
3.7 Seasonal variations of regional CO2mole fractions
To evaluate the seasonal cycle and long-term trend in the regionally representative records, we use the curve fitting method described by Thoning et al. (1989) to get the CO2seasonal variations (Figs. 2 and 9). For comparison, we also overlay the simulated
25
ACPD
13, 27287–27326, 2013In-situ measurement of atmospheric CO2
at the four WMO/GAW stations in China
S. X. Fang et al.
Title Page
Abstract Introduction
Conclusions References
Tables Figures
◭ ◮
◭ ◮
Back Close
Full Screen / Esc
Printer-friendly Version Interactive Discussion
Discussion
P
a
per
|
D
iscussion
P
a
per
|
Discussion
P
a
per
|
Discuss
ion
P
a
per
SDZ, 0.65, and LFS, 0.7) (Conway et al., 2013b). Seasonal cycle of CO2in the North-ern Hemisphere is mainly dominated by exchange with the land biosphere and thus characterized by rapid decreases from June to August and large returns from Septem-ber to DecemSeptem-ber (Nevison et al., 2008; WMO, 2012). At the four stations, CO2minimum values all occur in August, which are similar with the Northern Hemisphere (MBL), and
5
the occurring time at WLG consists with the previous study by Zhou et al. (2005). How-ever, the seasonal CO2 maximum occurring times vary a lot, ranging from January for LFS and LAN, March for SDZ to April for WLG. This difference is thought to be caused not only by regionally different terrestrial ecosystems and human activities but also by local meteorological conditions (Zhang et al., 2008). The high CO2mole fractions
ob-10
served at LFS in winter is likely due to regional coal burning (heating) and biomass burning (agricultural fires) which begins in October in the northeastern China plain. LAN is located in the Yangtze Delta area, which is the most economically developed region in China. In winter, in addition to the lower boundary layer, the increase of fos-sil fuel consumption may also partly contribute to the higher CO2 mole fractions. The
15
maximum CO2 mole fraction occurring time at WLG, a global WMO background site, agrees with the MBL and those observed at similar latitudes sites (Nakazawa et al., 1993; Riley et al., 2005; Throng et al., 1989).
At LAN, the monthly CO2 mole fractions are obviously higher than the similar MBL (sine of latitude value: 0.5) references during the whole year with an average monthly
20
difference of 11.2±4.3 (1σ) ppm, which means the LAN area (Yangtze Delta area) is a very strong source of regional CO2. Similarly, the CO2values at SDZ are also generally higher than the values at similar latitude (sine of latitude value: 0.65) with a mean of 6.2±3.1 ppm (1σ). Both stations display larger difference with the MBL in the autumn and winter period and smaller values in summer. Because WLG is located at a high
25
ACPD
13, 27287–27326, 2013In-situ measurement of atmospheric CO2
at the four WMO/GAW stations in China
S. X. Fang et al.
Title Page
Abstract Introduction
Conclusions References
Tables Figures
◭ ◮
◭ ◮
Back Close
Full Screen / Esc
Printer-friendly Version Interactive Discussion
Discussion
P
a
per
|
D
iscussion
P
a
per
|
Discussion
P
a
per
|
Discuss
ion
P
a
per
|
that the LFS area may act as a sink of background CO2 in the summer. In the other seasons, similar to LAN and SDZ, CO2values are also obviously higher than the MBL references.
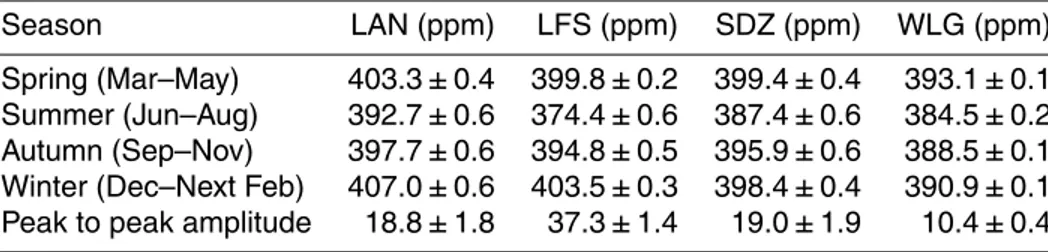
Table 2 illustrates the average regional CO2 mole fractions and peak to peak am-plitudes at the four sites. CO2 mole fractions at WLG are generally lower than those
5
observed at the three regional stations and the seasonal peak to peak amplitude is 10.4±0.4 ppm, which is close to similar MBL value (∼11.4 ppm, sine of latitude value:
0.6) and the previous study (10.5 ppm) by Zhou et al. (2005). The amplitudes from the three regional stations are obviously larger than WLG, which are mainly due to the strong sources and sinks in the regional areas. Because of the strong absorption by the
10
rice plants and forest in the northeastern China plain, CO2mole fractions at LFS are ex-tremely low in the summer and the peak to peak amplitude reaches to 37.3±1.4 ppm, which is the highest among the four stations. The amplitude at LFS in this study is also much higher than that (19.3±4.1 ppm) by Zhang et al. (2008) during 2003 to 2006.
However, they used discrete flask sampling method, which might underestimate the
15
value.
Table 3 illustrates the annual CO2values from the four stations. For comparison, we also present the values from Mauna Loa in United States (MLO) (Conway et al., 2013a), Jungfraujoch in Switzerland (JFJ), and Ryori in Japan (RYO) during the same period. MLO and JFJ are WMO/GAW global measurement stations. RYO is GAW regional
20
measurement stations. The average regional CO2 values at LAN, LFS and SDZ are obviously higher than the global mean value (∼389 ppm in 2010 and 390.9±0.1 ppm in 2011) (WMO greenhouse gas bulletin, 2011, 2012) and other WMO/GAW global stations such as MLO, JFJ. Compared with the results from other regional stations (such as RYO) close to China, CO2 mole fractions at the three regional stations are
25
ACPD
13, 27287–27326, 2013In-situ measurement of atmospheric CO2
at the four WMO/GAW stations in China
S. X. Fang et al.
Title Page
Abstract Introduction
Conclusions References
Tables Figures
◭ ◮
◭ ◮
Back Close
Full Screen / Esc
Printer-friendly Version Interactive Discussion
Discussion
P
a
per
|
D
iscussion
P
a
per
|
Discussion
P
a
per
|
Discuss
ion
P
a
per
plants (Wang et al., 2006; Zeng et al., 2008). Similar with methane (Fang et al., 2013), it also has a high level CO2 mole fractions. The strong absorption by local vegetation obviously decreases the atmospheric CO2 mole fractions at LFS. As a result, the an-nual mole fractions (Table 3) at this station are relatively lower than those at LAN and SDZ.
5
4 Conclusions
Atmospheric CO2measurements made at four WMO/GAW stations in China have been reported. The diurnal patterns, surface wind effects, atmospheric trends, and seasonal variations at each site were discussed. The results indicate that CO2 mole fractions from 10 m above the ground at the three regional stations (LAN, LFS and SDZ) are
10
more affected by local sources. Measurements from WLG are representative of the Tibetan Plateau.
The CO2 mole fractions at the three regional stations are generally higher than the values at respective similar latitude from MBL references. CO2levels at LAN are repre-sentative of the Yangtze Delta area, China and are the highest among the four stations.
15
Atmospheric CO2at LFS are strongly affected by local vegetation (paddy rice and for-est) in summer. As a result, it has the lowest CO2 levels in summer and the highest seasonal amplitude among the four stations. The SDZ station is located in an area with complex topography. The day to day variation of atmospheric CO2 is quite large. CO2 increases in case of events with local influence are highest at SDZ among the
20
four stations. The seasonal CO2 variations at WLG are small and similar with other GAW global stations (such as MLO in United States, and JFJ in Switzerland) with peak values occurring in spring.
In this study, we present continuous atmospheric CO2 measurements from 2009 to 2011. The relatively short 3 yr record may introduce bias in our analysis of the seasonal
25
ACPD
13, 27287–27326, 2013In-situ measurement of atmospheric CO2
at the four WMO/GAW stations in China
S. X. Fang et al.
Title Page
Abstract Introduction
Conclusions References
Tables Figures
◭ ◮
◭ ◮
Back Close
Full Screen / Esc
Printer-friendly Version Interactive Discussion
Discussion
P
a
per
|
D
iscussion
P
a
per
|
Discussion
P
a
per
|
Discuss
ion
P
a
per
|
better understand atmospheric CO2in China, a more extensive CO2observing network and longer period of in-situ measurements is required.
Acknowledgements. We express our great thanks to the staffat Lin’an, Longfengshan, Shang-dianzi and Waliguan station who have contributed to the system installation and maintenance at the stations. This work is supported by National Natural Science Foundation of China (No. 5
41175116), the National Key Basic Research Program (No. 2010CB950601), the International S&T Cooperation Program of the MOST (No. 2011DFA21090), and the CMA operational fund (2012Y003). The data used in this study will be available for public within the China Meteoro-logical Administration (CMA) policy.
M. Steinbacher acknowledges funding through the GAW Quality Assurance/Science Actitity 10
Centre (QA/SAC) Switzerland supported by MeteoSwiss.
We thank NOAA ESRL, Japan Meteorological Agency (JMA), and University of Bern for providing monthly CO2data from Mauna Loa (Hawaii) in the United States, Ryori in Japan, and Jungfraujoch in Switzerland from 2009 to 2011. The monthly data are downloaded from World Data Centre for Greenhouse Gases (WDCGG).
15
Finally, we also greatly appreciate NOAA ESRL for long-term cooperation on the WLG flask air sampling program and NDIR in-situ measurement program and Ken Massarie for helping us on the data comparison.
References
Artuso, F., Chamard, P., Piacentino, S., Sferlazzo, D. M., Silvestri, L. D., Sarra, A. D., Meloni, 20
D., and Monteleone, F.: Influence of transport and trends in amtospheric CO2at Lampedusa, Atmos. Environ., 43, 3044–3051, 2009.
Broquet, G., Chevallier, F., Bréon, F.-M., Kadygrov, N., Alemanno, M., Apadula, F., Hammer, S., Haszpra, L., Meinhardt, F., Morguí, J. A., Necki, J., Piacentino, S., Ramonet, M., Schmidt, M., Thompson, R. L., Vermeulen, A. T., Yver, C., and Ciais, P.: Regional inversion of CO2 25
ecosystem fluxes from atmospheric measurements: reliability of the uncertainty estimates, Atmos. Chem. Phys., 13, 9039–9056, doi:10.5194/acp-13-9039-2013, 2013.
Ballantyne, A. P., Alden, C. B., Miller, J. B., Tans, P. P., and White, J. W. C.: Increase in observed net carbon dioxide uptake by land and oceans during the past 50 years, Nature, 488, 70–73, 2012.
ACPD
13, 27287–27326, 2013In-situ measurement of atmospheric CO2
at the four WMO/GAW stations in China
S. X. Fang et al.
Title Page
Abstract Introduction
Conclusions References
Tables Figures
◭ ◮
◭ ◮
Back Close
Full Screen / Esc
Printer-friendly Version Interactive Discussion
Discussion
P
a
per
|
D
iscussion
P
a
per
|
Discussion
P
a
per
|
Discuss
ion
P
a
per
Cao, G., Zhang, X., Wang, Y., and Zheng, F.: Estimation of emissions from field burning of crop straw in China, Chinese Sci. Bull., 53, 784–790, 2008.
Chen, H., Winderlich, J., Gerbig, C., Hoefer, A., Rella, C. W., Crosson, E. R., Van Pelt, A. D., Steinbach, J., Kolle, O., Beck, V., Daube, B. C., Gottlieb, E. W., Chow, V. Y., Santoni, G. W., and Wofsy, S. C.: High-accuracy continuous airborne measurements of greenhouse gases 5
(CO2 and CH4) using the cavity ring-down spectroscopy (CRDS) technique, Atmos. Meas. Tech., 3, 375–386, doi:10.5194/amt-3-375-2010, 2010.
Chevallier, F., Deutscher, N. M., Conway, T. J., Ciais, P., Ciattaglia, L., Dohe, S., Fröhlich, M., Gomez-Pelaez, A. J., Griffith, D., Hase, F., Haszpra, L., Krummel, P., Kyrö, E., Labuschagne, C., Langenfelds, R., Machida, T., Maignan, F., Matsueda, H., Morino, I., Notholt, J., Ramonet, 10
M., Sawa, Y., Schmidt, M., Sherlock, V., Steele, P., Strong, K., Sussmann, R., Wennberg, P., Wofsy, S., Worthy, D., Wunch, D., and Zimnoch, M.: Global CO2fluxes inferred from surface air-sample measurements and from TCCON retrievals of the CO2 total column, Geophys. Res. Lett., 38, L24810, doi:10.1029/2011GL049899, 2011.
Conway, T. J., Lang, P. M., and Masarie, K. A.: Atmospheric Carbon Dioxide Dry Air Mole 15
Fractions from the NOAA ESRL Carbon Cycle Cooperative Global Air Sampling Network, 1968–2011, Version: 2012-08-15, ftp://ftp.cmdl.noaa.gov/ccg/co2/flask/event/ (last access: 28 August 2013), 2012a.
Conway, T. J., Masarie, K. A., Lang, P. M., and Tans, P. P.: NOAA greenhouse gas reference from atmospheric carbon dioxide dry air mole fractions from the NOAA ESRL Carbon Cy-20
cle Cooperative Global Air Sampling Network, (ftp://ftp.cmdl.noaa.gov/ccg/co2/flask/) (last access: 28 August 2013), 2012b.
Crosson, E. R.: A cavity ring-down analyzer for measuring atmospheric levels of methane, carbon dioxide, and water vapor, Appl. Phys. B, 92, 403–408, 2008.
Dlugokencky, E. J., Steele, L. P., Lang, P. M., and Masarie, K. A.: The growth rate and distribu-25
tion of atmospheric methane, J. Geophys. Res., 99, 17021–17043, 1994.
Dlugokencky, E. J., Steele, L. P., Lang, P. M., and Masarie, K. A.: Atmospheric CH4at Mauna Loa and Barrow Observatories: presentation and analysis of in in situ measurements, J. Geophys. Res., 100, 23103–23113, 1995.
Fang, S. X., Zhou, L. X., Masarie, K. A., Xu, L., and Rella, C. W.: Study of atmospheric CH4 30
ACPD
13, 27287–27326, 2013In-situ measurement of atmospheric CO2
at the four WMO/GAW stations in China
S. X. Fang et al.
Title Page
Abstract Introduction
Conclusions References
Tables Figures
◭ ◮
◭ ◮
Back Close
Full Screen / Esc
Printer-friendly Version Interactive Discussion
Discussion
P
a
per
|
D
iscussion
P
a
per
|
Discussion
P
a
per
|
Discuss
ion
P
a
per
|
Fu, Y., Zheng, Z., Yu, G., Hu, Z., Sun, X., Shi, P., Wang, Y., and Zhao, X.: Environmental influ-ences on carbon dioxide fluxes over three grassland ecosystems in China, Biogeosciinflu-ences, 6, 2879–2893, doi:10.5194/bg-6-2879-2009, 2009.
GLOBALVIEW-CO2, Cooperative Atmospheric Data Integration Project
– Carbon Dioxide. NOAA ESRL, Boulder, Colorado [Available at
5
http://www.esrl.noaa.gov/gmd/ccgg/globalview/] (last access: 3 January 2013), 2012. Gerbig, C., Lin, J. C., Munger, J. W., and Wofsy, S. C.: What can tracer observations in the
continental boundary layer tell us about surface-atmosphere fluxes?, Atmos. Chem. Phys., 6, 539–554, doi:10.5194/acp-6-539-2006, 2006.
Gourdji, S. M., Mueller, K. L., Yadav, V., Huntzinger, D. N., Andrews, A. E., Trudeau, M., Petron, 10
G., Nehrkorn, T., Eluszkiewicz, J., Henderson, J., Wen, D., Lin, J., Fischer, M., Sweeney, C., and Michalak, A. M.: North American CO2 exchange: inter-comparison of modeled es-timates with results from a fine-scale atmospheric inversion, Biogeosciences, 9, 457–475, doi:10.5194/bg-9-457-2012, 2012.
Houghton, R. A.: Revised estimates of the annual net flux of carbon to the atmosphere from 15
changes in land use and land management 1850–2000, Tellus, 55, 378–390, 2003.
IPCC (Intergovernmental Panel on Climate Change): Climate Change 2007: The Physical Sci-ence Basis, Contribution of Working Group I to the Fourth Assessment, Report of the In-tergovernmental Panel on Climate Change, edited by: Solomon, S., Qin, D., Manning, M., Chen, Z., Marquis, M., Averyt, K. B., Tignor, M., and Miller, H. L., Cambridge Univ. Press, 20
New York, 2007.
Keeling, C. D.: Global observations of atmospheric CO2, in: The Global Carbon Cycle, NATO ASI Series, vol. 15, edited by: Heimann, M., Springer-Verlag, New York, 1–30, 1993. Keeling, C. D., Bacastow, R. B., Bainbridge, A., Ekdahl Jr., C. A., Guenther, P. R., Waterman, L.
S., and Chin, J. F.: Atmospheric carbon dioxide variations at Mauna Loa Observatory, Hawaii, 25
Tellus, 28, 538–551, 1976.
Keeling, R. F.: Recording earth’s vital signs, Science, 319, 1771–1772, 2008.
Kerang, L., Wang, S., and Cao, M.: Vegetation and soil carbon storage in China, Sci. China, Ser. D , 47, 49–57, 2004.
Le Quéré, C., Andres, R. J., Boden, T., Conway, T., Houghton, R. A., House, J. I., Marland, G., 30
ACPD
13, 27287–27326, 2013In-situ measurement of atmospheric CO2
at the four WMO/GAW stations in China
S. X. Fang et al.
Title Page
Abstract Introduction
Conclusions References
Tables Figures
◭ ◮
◭ ◮
Back Close
Full Screen / Esc
Printer-friendly Version Interactive Discussion
Discussion
P
a
per
|
D
iscussion
P
a
per
|
Discussion
P
a
per
|
Discuss
ion
P
a
per
Raupach, M. R., Schwinger, J., Sitch, S., Stocker, B. D., Viovy, N., Zaehle, S., and Zeng, N.: The global carbon budget 1959–2011, Earth Syst. Sci. Data, 5, 165–185, doi:10.5194/essd-5-165-2013, 2013.
Lei, H. M. and Yang, D. W.: Seasonal and interannual variations in carbon dioxide exchange over a cropland in the North China Plain, Glob. Change Biol., 16, 2944–2957, 2010.
5
Liu, L., Zhou, L., Zhang, X., Wen, M., Zhang, F., Yao, B., and Fang, S., The characteristics of atmospheric CO2concentration variation of the four national background stations, China, Sci. China, Ser. D, 52, 1857–1863, 2009.
Li, L., Wang, Y., Zhang, Q., Li, J., Yang, X., and Jin, J.: Wheat straw burning and its associated impacts on Beijing air quality, Sci. China Ser. D, 51, 403–414, 2008.
10
Marland, G.: Emissions accounting: China’s uncertain CO2 emissions, Nat. Clim. Chang., 2, 645–646, 2012.
Nakazawa, T., Morimoto, S., Aoki, S., and Tanaka, M.: Time and space variations of the carbon isotopic ratio of tropospheric carbon dioxide over Japan, Tellus, 45, 258–274, 1993.
Necki, J., Schmidt, M., Rozanski, K., Zimnoch, M., Korus, A., Lasa, J., Graul, R., and Levin, I.: 15
Six-year record of atmospheric carbon dioxide and methane at a high-altitude mountain site in Poland, Tellus, 55, 94–104, 2003.
Nevison, C. D., Mahowald, N. M., Doney, S. C., Lima, I. D., van der Werf, G. R., Randerson, J. T., Baker, D. F., Kasibhatla, P., and McKinley, G. A.: Contribution of ocean, fossil fuel, land biosphere, and biomass burning carbon fluxes to seasonal and interannual variability in 20
atmospheric CO2, J. Geophys. Res., 113, G01010, doi:10.1029/2007JG000408, 2008. Peylin, P., Law, R. M., Gurney, K. R., Chevallier, F., Jacobson, A. R., Maki, T., Niwa, Y., Patra,
P. K., Peters, W., Rayner, P. J., Rödenbeck, C., and Zhang, X.: Global atmospheric carbon budget: results from an ensemble of atmospheric CO2inversions, Biogeosciences Discuss., 10, 5301–5360, doi:10.5194/bgd-10-5301-2013, 2013.
25
Peters, G. P., Minx, J. C., Weber, C. L., and Edenhofer, O.: Growth in emission transfers via international trade from 1990 to 2008, Proc. Natl. Acad. Sci. USA, 108, 8903–3908, 2011. Peters, G. P., Marland, G., Le Quéré, C., Boden, T., Canadell, J. G., and Raupach, M. R.: Rapid
growth in CO2 emissions after the 2008–2009 global financial crisis, Nat. Clim. Chang., 2, 2–4, 2012.
30
ACPD
13, 27287–27326, 2013In-situ measurement of atmospheric CO2
at the four WMO/GAW stations in China
S. X. Fang et al.
Title Page
Abstract Introduction
Conclusions References
Tables Figures
◭ ◮
◭ ◮
Back Close
Full Screen / Esc
Printer-friendly Version Interactive Discussion
Discussion
P
a
per
|
D
iscussion
P
a
per
|
Discussion
P
a
per
|
Discuss
ion
P
a
per
|
on North American carbon dioxide exchange: CarbonTracker, Proc. Natl. Acad. Sci. USA, 104, 18925–18930, doi:10.1073/pnas.0708986104, 2007.
Riley, W. J., Randerson, J. T., Foster, P. N., and Lueker, T. J.: Influence of terrestrial ecosystems and topography on coastal CO2 measurements: A case study at Trinidad Head, California, J. Geophys. Res., 110, G01005, doi:10.1029/2004JG000007, 2005.
5
Sirignano, C., Neubert, R. E. M., Rödenbeck, C., and Meijer, H. A. J.: Atmospheric oxygen and carbon dioxide observations from two European coastal stations 2000–2005: continen-tal influence, trend changes and APO climatology, Atmos. Chem. Phys., 10, 1599–1615, doi:10.5194/acp-10-1599-2010, 2010.
Tang, J., Wen, Y. P., and Zhou, L. X.: Observational study of black carbon aerosol in western 10
China, J. Appl. Meteor. Sci., 10, 160–170, 1999.
Tang, X., Liu, S., Zhou, G., Zhang, D., and Zhou, C.: Soil-atmospheric exchange of CO2, CH4 and N2O in three subtropical forest ecosystems in southern China, Glob. Change Biol., 12, 546–560, 2006.
Tans, P. P., Fung, I. Y., and Takahashi, T.: Observation constraints on the global atmospheric 15
CO2budget, Science, 247, 1431–1438, 1990.
Thompson, R. L., Manning, A. C., Gloor, E., Schultz, U., Seifert, T., Hänsel, F., Jordan, A., and Heimann, M.: In-situ measurements of oxygen, carbon monoxide and greenhouse gases from Ochsenkopf tall tower in Germany, Atmos. Meas. Tech., 2, 573–591, doi:10.5194/amt-2-573-2009, 2009
20
Thoning, K. W., Tans, P. P., and Komhyr, W. D.: Atmoshperic carbon dioxide at Mauna Loa observatory 2. Analysis of the NOAA GMCC data, 1974–1985, J. Geophys. Res., 94, 8549– 5865, 1989.
Wang, H., Zhou, L., and Tang, X.: Ozone concentrations in Rural Regions of the Yangtze Delta in China, J. Atmos. Chem., 54, 266–265, 2006.
25
World meteorological organization (WMO): WMO World Data Centre for
Green-house Gases (WDCGG) Data Summary: Volume IV – Greenhouse Gases
and Other Atmospheric Gases, No. 36, Japan Meteorological Agency, http://ds.data.jma.go.jp/gmd/wdcgg/products/summary/sum36/sum36contents.html (last access: 1 March 2012), 2012.
30
ACPD
13, 27287–27326, 2013In-situ measurement of atmospheric CO2
at the four WMO/GAW stations in China
S. X. Fang et al.
Title Page
Abstract Introduction
Conclusions References
Tables Figures
◭ ◮
◭ ◮
Back Close
Full Screen / Esc
Printer-friendly Version Interactive Discussion
Discussion
P
a
per
|
D
iscussion
P
a
per
|
Discussion
P
a
per
|
Discuss
ion
P
a
per
WMO greenhouse gas bulletin: The state of greenhouse gases in the atmosphere based on global observations through 2010. Geneva: World Meteorological Organization, 2011. WMO Greenhouse Gas Bulletin: The state of greenhouse gases in the atmosphere based on
global observations through 2011, Geneva: World Meteorological Organization, 2012. Yao, B., Vollmer, M. K., Zhou, L. X., Henne, S., Reimann, S., Li, P. C., Wenger, A., and Hill, 5
M.: In-situ measurements of atmospheric hydrofluorocarbons (HFCs) and perfluorocarbons (PFCs) at the Shangdianzi regional background station, China, Atmos. Chem. Phys., 12, 10181–10193, doi:10.5194/acp-12-10181-2012, 2012.
Yue, J., Shi, Y., Liang, W., Wu, J., Wang, C., and Huang, G.: Methane and nitrous oxide emis-sions from rice field and related microorganism in black soil, northeastern China, Nutr. Cycl. 10
Agroecosys., 73, 293–301, 2005.
Zeng, N., Ding, Y., Pan, J., Wang, H., and Gregg, J.: Climate Change – the Chinese Challenge, Science, 319, 730–731, 2008.
Zhang, D., Tang, J., Shi, G., Nakazawa, T., Aoki, S., Sugawara, S., Wen, M., Morimoto, S., Patra, P. K., and Hayasaka, T.: Temporal and spatial variations of the atmospheric CO2 con-15
centration in China, Geophys. Res. Lett., 35, L03801, doi:10.1029/2007GL032531, 2008. Zhao, C. L. and Tans, P. P.: Estimating uncertainty of the WMO mole fraction scale for carbon
dioxide in air, J. Geophys. Res., 111, D08S09, doi:10.1029/2005JD006003, 2006.
Zhao, C., Tans, P. P., and Thoning, K. W.: A high precision manometric system for absolute calibrations of CO2in dry air, J. Geophys. Res., 102, 5885–5894, 1997.
20
Zhou, L., Conway, J. T. J., White, W. C., Mukai, H., Zhang, X., Wen, Y., Li, J., and MacClune, K.: Long-term record of atmospheric CO2 and stable isotopic ratios at Waliguan Observa-tory: Background features and possible drivers, 1991–2002, Global Biogeochem. Cy., 19, GB2001, doi:10.1029/2004GB002430, 2005.
Zhou, L. X., Worthy, D. E. J., Lang, P. M., Ernst, M. K., Zhang, X. C., Wen, Y. P., and Li, J. L.: 25
Ten years of atmospheric methane observations at a high elevation site in Western China, Atmos. Environ., 38, 7041–7054, 2004.
Zhou, L. X., Tang, J., Wen, Y. P., Li, J. L., Yan, P., and Zhang, X. C.: The impact of local winds and long-range transport on the continuous carbon dioxide record at Mount Waliguan, China, Tellus, 55, 145–158, 2003.
30
ACPD
13, 27287–27326, 2013In-situ measurement of atmospheric CO2
at the four WMO/GAW stations in China
S. X. Fang et al.
Title Page
Abstract Introduction
Conclusions References
Tables Figures
◭ ◮
◭ ◮
Back Close
Full Screen / Esc
Printer-friendly Version Interactive Discussion
Discussion
P
a
per
|
D
iscussion
P
a
per
|
Discussion
P
a
per
|
Discuss
ion
P
a
per
|
Zhou, L. X., White, J. W. C., Conway, T. J., Mukai, H., MacClune, K., Zhang, X., Wen, Y., and Li, J.: Long-term record of atmospheric CO2and stable isotopic ratios at Waliguan Observa-tory: Seasonally averaged 1991–2002 source/sink signals, and a comparison of 1998–2008 record to the 11 selected sites in the Northern Hemisphere, Global Biogeochem. Cy., 20, GB2001, doi:10.1029/2004GB002431, 2006.