BGD
5, 411–433, 2008Microzoo-phytoplankton interaction in CO2 manipulated setups
K. Suffrian et al.
Title Page
Abstract Introduction
Conclusions References
Tables Figures
◭ ◮
◭ ◮
Back Close
Full Screen / Esc
Printer-friendly Version
Interactive Discussion
Biogeosciences Discuss., 5, 411–433, 2008 www.biogeosciences-discuss.net/5/411/2008/ © Author(s) 2008. This work is licensed under a Creative Commons License.
Biogeosciences Discussions
Biogeosciences Discussionsis the access reviewed discussion forum ofBiogeosciences
Microzooplankton grazing and
phytoplankton growth in marine
mesocosms with increased CO
2
levels
K. Suffrian1,6, P. Simonelli2, J. C. Nejstgaard3, S. Putzeys4, Y. Carotenuto5, and A. N. Antia1
1
Leibniz Institute for Marine Sciences (IFM-GEOMAR), D ¨usternbrooker Weg 20, 24105 Kiel, Germany
2
University of Bergen, Department of Biology, P.O. Box 7800, 5020 Bergen, Norway
3
Department of Biology, UNIFOB, P.O. Box 7800, 5020 Bergen, Norway
4
Facultad de Ciencias del Mar, Universidad de las Palmas de Gran Canaria, 35017 Tafira Baja – Las Palmas, Spain
5
Stazione Zoologica “A. Dohrn”, Villa Comunale 1, 80121 Naples, Italy
6
CAU Kiel, Institute for Physiology, Hermann-Rodewald-Straße 5, 24118 Kiel, Germany
Received: 16 November 2007 – Accepted: 14 December 2007 – Published: 31 January 2008
Correspondence to: K. Suffrian (k.suffrian@physiologie.uni-kiel.de)
BGD
5, 411–433, 2008Microzoo-phytoplankton interaction in CO2 manipulated setups
K. Suffrian et al.
Title Page
Abstract Introduction
Conclusions References
Tables Figures
◭ ◮
◭ ◮
Back Close
Full Screen / Esc
Printer-friendly Version
Interactive Discussion
Abstract
Microzooplankton grazing and algae growth responses to increasing pCO2levels (350,
700 and 1050µatm) were investigated in nitrate and phosphate fertilized mesocosms during the PeECE III experiment 2005. Grazing and growth rates were estimated by the dilution technique combined with taxon specific HPLC pigment analysis.
Phytoplank-5
ton and microzooplankton composition were determined by light microscopy. Despite a range up to 3 times the present CO2levels, there were no clear differences in any mea-sured parameter between the different CO2 treatments. Thus, during the first 9 days
of the experiment the algae community standing stock (SS), measured as chlorophyll a(Chla), showed the highest instantaneous grow rates (0.02–0.99 d−1
) and increased
10
from ca 2–3 to 6–12µg l−1
, in all mesocosms. Afterwards the phytoplankton SS de-creased in all mesocosms until the end of the experiment. The microzooplankton SS, that was mainly dinoflagellates and ciliates varied between 23 and 130µg C l−1
, peak-ing on day 13–15, apparently respondpeak-ing to the phytoplankton development. Instanta-neous Chlagrowth rates were generally higher than the grazing rates, indicating only a
15
limited overall effect of microzooplankton grazing on the most dominant phytoplankton. Diatoms and prymnesiophytes were significantly grazed (14–43% of the SS d−1) only
in the pre-bloom phase when they were in low numbers and in the post-bloom phase when they were already limited by low nutrients and/or virus lysis. The cyanobacteria populations appeared more effected by microzooplankton grazing, generally removing
20
20–65% of the SS d−1.
1 Introduction
Atmospheric CO2 levels have increased from about 280 to 380µatm since the begin-ning of the industrial revolution, and are projected to reach values as high as 700µatm by the end of the 21st century (IPCC, 2001). This increase in atmospheric CO2 (and
25
other gases) is predicted to result in e.g. increasing global temperatures, rising sea
BGD
5, 411–433, 2008Microzoo-phytoplankton interaction in CO2 manipulated setups
K. Suffrian et al.
Title Page
Abstract Introduction
Conclusions References
Tables Figures
◭ ◮
◭ ◮
Back Close
Full Screen / Esc
Printer-friendly Version
Interactive Discussion
level and accelerating extreme weather incidences (IPCC, 2007). Increased atmo-spheric CO2 levels have lead to increased ocean acidity with a pH drop of 0.1 since
the beginning of the industrial revolution and with a predicted drop of another 0.4 units already before the end of this century (Caldeira and Wicket, 2003). As a consequence, the carbonate saturation in the ocean is decreasing, likely effecting a number of
organ-5
isms, especially those with calcareous skeletons such as coccolithophorids, corals and molluscs (see discussion and references in Schulz et al., 2007). Auto- and mixotrophic protists play a key role in the global carbon cycle since they fix inorganic carbon that is either transferred to the higher trophic levels through grazing or exported to deeper ocean layers through the biological pump and sedimentation. But it is still unclear, how
10
and to what extent the alteration in the ocean chemistry affects and is affected by the phytoplankton growth and grazing interaction. As shown in previous experiments, the decreasing pH and hence decreasing carbonate saturation in the ocean may have a negative effect on the calcite (CaCO3) production by coccolithophores and foraminifera (Riebesell et al., 2000; Russell et al., 2004), while other algal species which rely on
15
dissolved CO2concentration for photosynthesis, might benefit from an increase in the
surface ocean CO2 concentration. Thus, CO2 perturbations at an ecosystem level may provoke very complex responses in phytoplankton species composition and suc-cession, and thereby affect the structure and functioning of the marine food web by cascading effects on elemental recycling by virus and bacteria as well as carbon fluxes
20
through the grazing food web and export through sedimentation. While such com-plicated effects can not be studied in laboratory, mesocosm experiments provide a powerful tool to better understand complex responses of marine systems to increasing CO2levels and its feedback effects on carbon cycle and global climate. Thus, to
investi-gate how increased CO2levels in the atmosphere could affect the phytoplankton-grazer
25
interactions, we conducted a series of dilution experiments to quantify microzooplank-ton grazing during the 2005 Pelagic Ecosystem CO2Enrichment study (Schulz et al.,
2007).
BGD
5, 411–433, 2008Microzoo-phytoplankton interaction in CO2 manipulated setups
K. Suffrian et al.
Title Page
Abstract Introduction
Conclusions References
Tables Figures
◭ ◮
◭ ◮
Back Close
Full Screen / Esc
Printer-friendly Version
Interactive Discussion
2 Material and methods
2.1 Mesocosm setup and sampling
The Pelagic Ecosystem CO2 Enrichment experiment (PeECE III) was carried out at the National Mesocosm Centre, University of Bergen, Norway, from 16 May (day 1) to 10 June 2005 (day 25). Details are given in Schulz et al. (2007), while a general
de-5
scription of the mesocosm facility is available at: http://www.ifm.uib.no/LSF/inst2.html. Briefly summarized: nine floating 27 m3polyethylene seawater enclosures were filled in situ with unfiltered nutrient poor post bloom water from the surface of the surrounding fjord (Raunefjord, 60◦16′N, 05◦14′E). To initiate phytoplankton blooms all the
meso-coms were fertilized with NO3and PO4to initial concentrations of 15 and 0.6µmol l− 1
,
10
respectively. The mesocosms were manipulated (in triplicates) to three pCO2 levels
(ca 350, 700 and 1050µatm) by aerating with normal or CO2-enriched air. These
CO2 concentrations represented one (1×), two (2×) and three (3×) times the present
atmospheric CO2conditions, respectively.
2.2 Setup and sampling of dilution experiments and nutrient analysis
15
Phytoplankton growth and microzooplankton grazing rates were assessed by a total of 12 dilution experiments (Landry, 1993; Landry and Hassett, 1982), listed in Table 1. The experiments were performed using water from one of each of the three CO2
treat-ments at 4 occasions corresponding to pre algal bloom (day 1–3), bloom (day 7–9) and post bloom conditions (day 13–15 and 20–22) (Schulz et al., 2007). Water for the
dilu-20
tion experiments was collected by submerging 25 l polycarbonate bottles with the main opening covered by a 200µm nylon mesh to exclude mesozooplankton, and with the spigot open to let air out of the bottle in order to sample with minimal turbulence and sheer-stress of the delicate protists. An aliquot was filtered trough 0.2µm cellulose ac-etate filter (Whatman, 142 mm) using tissue culture hoses and low pressure (<50 hPa).
25
Filtration was conducted in a cold room at in situ temperature immediately before the
BGD
5, 411–433, 2008Microzoo-phytoplankton interaction in CO2 manipulated setups
K. Suffrian et al.
Title Page
Abstract Introduction
Conclusions References
Tables Figures
◭ ◮
◭ ◮
Back Close
Full Screen / Esc
Printer-friendly Version
Interactive Discussion
setup of the experiments. Target concentrations for the dilution of 25, 50, 75 and 100% undiluted sea water were carefully mixed in 10 l polycarbonate bottles and distributed to triplicate 2 l polycarbonate incubation bottles by siphoning. 2 l bottles were filled al-ternating the flow into each bottle until they were all topped offat about the same time. Absolute dilutions were checked by Chl a concentrations at start in the 10 l bottles.
5
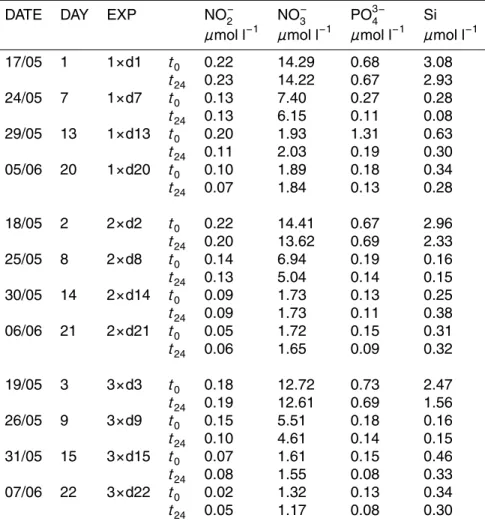
To assure that the experiments were not biased by nutrient limitation, nutrients were measured in the 100% sea water bottles at the start and the end of the incubations (Ta-ble 1). Nutrient samples were frozen and stored at−20◦C until analysis according to Grasshoffand Kremling (1999) as described in detail by Schulz et al. (2007). In order to avoid unnecessary changes in the experimental nutrient conditions (e.g. Landry, 1993),
10
nutrients were added to the experimental bottles only when nutrient levels were below 2µmol l−1
of nitrate or 0.2µmol l−1
of phosphate (i.e. from day 13 and on). Final con-centrations of nutrients added were 1µM (NO−
3, NH
+
4), 0.1µM (PO 3−
4 ) and trace metals
corresponding tof/40 medium according to Guillard and Ryther (1962). Nutrients were never depleted in the experiments (Table 1). The 2 l bottles were tightly capped and
15
incubated in situ outside the mesocosms for 24 h hanging horizontally on strings from a floating ring at 6 m depth. This setup reproduced light conditions comparable to the average conditions inside the mesocosm (measured with a horizontally mounted un-derwater LI-192 unun-derwater quantum sensor). The incubation setup also created a gentle irregular tipping movement which prevented sedimentation in the flasks.
Sam-20
ples for microzooplankton counts and HPLC analysis were taken from the 10 l bottles at start (t0) and from the 2 l incubation bottles at end (t24), by gently siphoning offwhile
slowly stirring with the hose.
2.3 Algal pigment analysis
Phytoplankton pigments were analysed with high performance liquid chromatography
25
(HPLC) to obtain growth and grazing rates for the entire community and for selected algal groups based on their marker pigments (Table 2). Aliquots for HPLC analysis (400–500 ml) were filtered under low vacuum (200–300 hPa) onto 25 mm GF/F filters
BGD
5, 411–433, 2008Microzoo-phytoplankton interaction in CO2 manipulated setups
K. Suffrian et al.
Title Page
Abstract Introduction
Conclusions References
Tables Figures
◭ ◮
◭ ◮
Back Close
Full Screen / Esc
Printer-friendly Version
Interactive Discussion
(Whatman, nominal pore size 0.4µm) att0and t24 of each experiment (n=3). Filters
were put in Eppendorf tubes, shock frozen with liquid nitrogen, and stored at−80◦C until further analysis.
Pigments were extracted in 1 ml of 100% acetone. Additionally 100µl of an internal standard (canthaxanthin) and glass beads were added before sonication (4◦C, 5 min).
5
Subsequently the samples were centrifuged (4◦C, 15 min) and the supernatant was filtered through 0.2µm PTFE-syringe filters into Eppendorf reaction tubes. The sam-ples were then stored at−20◦C until measurement in a Waters HPLC combined with a Waters 474 Scanning Fluorescence Detector and a Waters 2996 Photodiode Array Detector. Pigments were separated at a flow rate of 1 ml min−1 by a linear gradient
10
(minutes, % solvent A, % solvent B): (0, 65, 35), (1, 50, 50), (10, 15, 85), (15, 0, 100), (20, 0, 100), and (22, 65, 35), modified after Barlow et al. (1997). Pigments were de-tected by absorption at 440 nm and identified by comparison of their retention times and spectra with retention times and spectra of well-characterized pigments.
Chlawas used as a proxy for the whole phytoplankton community while taxon
spe-15
cific marker pigments were analysed to obtain specific growth and grazing coefficients for different algal groups (Table 2). 19’-hexanoyloxyfucoxanthin (19-hex) could not be used as a marker for prymnesiophytes during the bloom phase, as it could not be well separated from prasinoxanthin in the HPLC measurements of the samples. To get gen-uine values for this important group pureE. huxleyi samples from Bergen (provided by
20
M. N. M ¨uller, IFM-GEOMAR) were screened by HPLC to find an alternative marker. A 19’-hexanoyloxyfucoxanthin-like peak, which was regarded typical for prymnesiophytes or even specific for coccolithophorids (Zapata et al., 2004), was found in the samples, corresponding to 4-keto-19’-hexanoyloxyfucoxanthin (4-keto-hex) recently reported by Airs and Llewellyn (2006). Both markers, 19-hex and 4-keto-hex, were found at stable
25
ratios to each other and to Chla in the pure E. huxleyi samples from Bergen. Thus, one or both of these pigments were used to identify the prymnesiophytes in each ex-periment.
BGD
5, 411–433, 2008Microzoo-phytoplankton interaction in CO2 manipulated setups
K. Suffrian et al.
Title Page
Abstract Introduction
Conclusions References
Tables Figures
◭ ◮
◭ ◮
Back Close
Full Screen / Esc
Printer-friendly Version
Interactive Discussion
2.4 Microzooplankton abundance estimates
Subsamples (100–300 ml) for microzooplankton analyses were fixed with Lugol’s iodine (1–2% final concentration) and stored in brown glass bottles at ambient temperature (ca 15◦C). Samples were settled for 24 h in 50 ml sedimentation chambers (Uterm ¨ohl,
1958). One to two transects of each sample was counted with a Zeiss Axiovert 100
5
inverted microscope at 200x magnification. Additional transects at 400x magnification were used to determine smaller cells. A total of ca 120–1000 cells were enumerated in each sample. Cell sizes were measured with an ocular scale and used to calculate bio-volume, using formulas for spherical (1) and prolate spheroid shapes (2), with diameter (d) and height (h).
10
VolSphere=π/6·d3 (1)
Volspheroid=π/6·d2·h (2)
Plankton biovolume (except for ciliates) was converted to carbon biomass (3) according to Menden-Deuer (2000):
log pg C cell−1
=−0.665+log vol ·0.939 (3)
15
Ciliate biovolume was converted to carbon biomass using a conversion factor of 0.19 pg C/µm3(Putt and Stoecker, 1989)
The microplankton was differentiated into autotrophic plankton and microzooplank-ton (including both heterotrophic and mixotropic organisms) by comparison of morpho-logical features to literature (Kuylenstierna and Karlson, 1996–2006; Str ¨uder-Kypke et
20
al., 2000–2001; Throndsen and Eikrem, 2005; Throndsen et al., 2003). The micro-zooplankton was grouped into dinoflagellates, ciliates and “other”. All ciliates were regarded as heterotrophic by morphological features (ciliates only apical, no visible chloroplasts etc.). The group named “other” consisted mainly of microflagellates that were both scarse and of very low biomass (Fig. 1), thus for simplicity all microflagellates
25
were considered heterotrophic.
BGD
5, 411–433, 2008Microzoo-phytoplankton interaction in CO2 manipulated setups
K. Suffrian et al.
Title Page
Abstract Introduction
Conclusions References
Tables Figures
◭ ◮
◭ ◮
Back Close
Full Screen / Esc
Printer-friendly Version
Interactive Discussion
2.5 Calculation of growth and grazing rates
Changes in phytoplankton pigment concentrations over the incubation period were used to calculate the apparent phytoplankton growth rate (µ) and the mortality losses due to microzooplankton grazing (g). Assuming exponential growth:
P0and Ptare the initial and final pigment concentrations respectively; t is the
incu-5
bation time (t=t24-t0),kis the instantaneous coefficient of phytoplankton growth,gthe
coefficient of grazing mortality andcis the dilution factor expressed as percentage of ambient seawater. It can be inferred thatµis linearly related to the dilution factor c, that the negative slope is the grazing coefficientg and that the Y-intercept is the phy-toplankton growth ratek (Landry 1993). Changes in grazer density were monitored
10
in the 100% bottle at start (t0) and end (t24) of the experiment. Since such changes
accounted always for less than 10% (±) of the community (not shown), no correction for grazer density was applied to the calculations (cf. Landry, 1993). Regressions were tested with ANOVA (Sigmaplot version 9, Systat Software Inc.).
The percentage of initial pigment SS daily grazed by microzooplankton (% d−1) was
15
calculated according to:
SS=1−e−g·100 (4)
3 Results
3.1 Microzooplankton community composition and development
There was no clear difference in microzooplankton community composition between
20
the three different CO2 treatments (Fig. 1). Dinoflagellates were the most abundant
group dominated numerically byGymnodiniumspp. andMinusculasp., while the larger
Gyrodiniumsp. dominated the dinoflagellate biomass. Ciliates made up ca. one third
of the community with species of the genusStrombidiumandLohmaniellaas the main biomass contributors. The group named “other” consisted mainly of microflagellates,
25
BGD
5, 411–433, 2008Microzoo-phytoplankton interaction in CO2 manipulated setups
K. Suffrian et al.
Title Page
Abstract Introduction
Conclusions References
Tables Figures
◭ ◮
◭ ◮
Back Close
Full Screen / Esc
Printer-friendly Version
Interactive Discussion
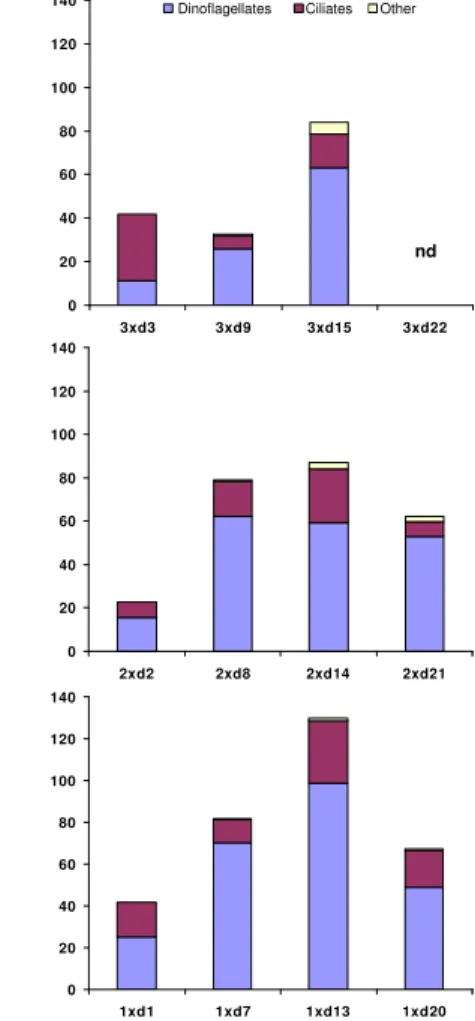
whereof all were considered heterotrophic, for simplicity. Although the biomass of the heterotrophs thus was overestimated, it has no practical quantitative effect since the total biomass of “Other” was only 0–6.5% of the total “microzooplankton” biomass (Fig. 1). The total heterotrophic biomass reached its maximum (90–130µg C l−1
) dur-ing the experiment startdur-ing days 13–15, while it decreased again at the time of the last
5
experiments (65±5µg C l−1). Although dinoflagellates increased in abundance during the first 8-15 days, ciliates did not show any clear trend of development through the experiment.
3.2 Development of the overall phytoplankton community, growth and grazing
Overall phytoplankton community biomass, growth and grazing estimates based on
10
Chlashowed similar patterns in the three CO2treatments during the incubation
exper-iment (Tables 3a–c). Two phases can be observed: the first from day one to nine was characterized by the highest algal growth rates (0.12 to 0.99 d−1). Although the mi-crozooplankton community grazing rates also were the highest (0.28–0.49 d−1) with a daily ChlaSS removal of 25–39% during this first period, the algal community reached
15
the maximum SS (1.99–12.23µg Chlal−1, Tables 3a–c). Thus, microzooplankton only appeared to have a minor effect on the overall phytoplankton development when nu-trients were abundant (Table 1) during the first 9 days, this is also apparent from the general distribution of the data points below the 1:1-lines in Fig. 2.
Between days 9 and 13 there was a significant decrease in instantaneous Chl a
20
growth rates (k) in all CO2treatments. While the 2×and 3×CO2 treatments showed
a marked decrease in ChlaSS (Tables 3b and c), the 1×CO2treatment ChlaSS was
relatively stable in that period (Table 3a). However, after day 13 the algal Chl a SS declined in all three mesocosms to 2.1–2.5µg l−1at day 20–22 (Tables 3a–c). During
this latter period phytoplankton growth rates decreased (0.02–0.37 d−1) and overall
25
microzooplankton grazing pressure stayed relatively low (5–24% SS d−1, Tables 3a– c). Thus, the microzooplankton grazing impact on the overall phytoplankton community was limited.
BGD
5, 411–433, 2008Microzoo-phytoplankton interaction in CO2 manipulated setups
K. Suffrian et al.
Title Page
Abstract Introduction
Conclusions References
Tables Figures
◭ ◮
◭ ◮
Back Close
Full Screen / Esc
Printer-friendly Version
Interactive Discussion
3.3 Development of SS, growth and grazing of specific algae groups
Of the seven analysed specific algal pigments (Table 2) only the pigments assumed to characterize some of the most dominant groups; Prymnesiophytes (4-keto-19’-hexanoyloxyfucoxanthin and 19’-(4-keto-19’-hexanoyloxyfucoxanthin), Diatoms (fucoxanthin), Di-noflagellates (peridinin) and Cyanobacteria (zeaxanthin) yielded significant growth or
5
grazing rates in most of the experiments (Tables 3a–c). Thus data on the other pig-ments are not further discussed.
It is not surprising that the general pattern observed for the total phytoplankton com-munity (Chla) was mirrored in the effect of the microzooplankton grazing on the pig-ments assumed to reflect the dominant diatoms and prymnesiophytes. Grazing on
di-10
atoms and prymnesiophytes also showed similar patterns. During the first ten days the growth rates of these algae were generally higher than the feeding rates indicating that microzooplankton feeding was not a factor significantly limiting their blooming. Grazing rates overcame the growth rates during the days 13–15 while they were comparable in the end of the experiment (20–22).
15
The grazing pressure on cyanobacteria SS was higher compared with the ones on the larger autotrophs, ranging between 19% and 65% (Tables 3a–c). This intense feeding activity was balanced by higher instantaneous growth rates (0.19–2.25 d−1) and did not seem to limit the increase of the SS during the last two experiments. The apparent patterns of growth and grazing on dinoflagellates were more inconsistent,
20
and few conclusions may be drawn from these data.
As observed for Chl a, the microzooplankton grazing on the specific pigments did not seem to be influenced by the different CO2treatments, and neither did the grazing
pressure seem to have any major effect on the development of the bloom of the diff er-ent groups, except perhaps in the very beginning of the experimer-ent when the standing
25
stocks of the phytoplankton were generally low. The highest percentages of SS re-moved by microzooplankton were 42% for diatoms, 43% for prymnesiophytes and 65% for cyanobacteria.
BGD
5, 411–433, 2008Microzoo-phytoplankton interaction in CO2 manipulated setups
K. Suffrian et al.
Title Page
Abstract Introduction
Conclusions References
Tables Figures
◭ ◮
◭ ◮
Back Close
Full Screen / Esc
Printer-friendly Version
Interactive Discussion
4 Discussion
4.1 Use of specific marker pigments as a proxy for different algae.
When using specific pigments as markers for individual taxa it is of great importance to know what species are physically present and dominant (Antajan et al., 2004; Irigoien et al., 2004). Due to the initial high silicate concentrations in all mesocoms (Table 1)
5
the phytoplankton community biomass rapidly became dominated by diatoms while the silicate became significantly reduced (Schulz et al., 2007; Egge et al., 2007). Thus, the development of the fucoxanthin showed a similar development as the draw down of the silicate and observations of phytoplankton samples from the mesocosms, and this pigment should thus be considered to closely mirror the development of the diatoms.
10
Although the calcifying prymnesiophyte Emiliania huxleyi only reached moderate numbers, other prymnesiophytes were abundant in the mesocosms corroborating our use of 4-keto-hex and 19-hex as indicators of prymnesiophytes in all the CO2
treat-ments (Engel et al., 2007; Paulino et al., 2007; Schulz et al., 2007, J. K. Egge and A. Larsen, personal communication). Also the development of the dominating
15
cyanobacteriaSynechococcussp. (Paulino et al., 2007) appeared to follow the same pattern as the development of the zeaxanthin measured here. Although we observed autotrophic dinoflagellates (not shown) while analysing the heterotrophic dinoflagel-lates the development of the peridinin concentration and rates (Tables 3a–c) is less clear, and may be obscured by the problem of defining mixotrophy in this group. The
20
dinoflagellates will therefore not be further discussed here.
In conclusion, as the presence of the major phytoplanktonic groups – diatoms, prym-nesiophytes and cyanobacteria (Synechococcus sp.) – was verified against flow cy-tometry and microscopy we consider the HPLC data as trustworthy for these three groups.
25
BGD
5, 411–433, 2008Microzoo-phytoplankton interaction in CO2 manipulated setups
K. Suffrian et al.
Title Page
Abstract Introduction
Conclusions References
Tables Figures
◭ ◮
◭ ◮
Back Close
Full Screen / Esc
Printer-friendly Version
Interactive Discussion
4.2 Effects of the CO2treatments on phytoplankton growth and grazing
The major aim with this investigation was to compare microzooplankton grazing and al-gae growth interactions in different CO2environments. However, we found no clear ef-fects on microzooplankton grazing or phytoplankton growth when comparing the three CO2-treatments over a three week period. Despite that previous laboratory studies
5
have shown a number of acute effects on single planktonic organisms (even if some-times conflicting and contradictory, as discussed in Schulz et al., 2007), we suggest from our results that either; 1) Complex, close to natural systems such as investigated here may show such a complex response patterns that it needs more detailed studies (including e.g. biogeochemical studies of the material transport between the trophic
10
compartments) to be disclosed, or 2) Such complex systems may simply have large “buffering capacities” making them able to absorb increased CO2, at least under cer-tain conditions, such as described in Riebesell et al. (2007). However, as described in Riebesell et al. (2007) such CO2 over-consumption would lead to offset Red field
ratios, and possibly significant deterioration of the content of essential constituents in
15
the prey of the microzooplankton. This has not been investigated here. If the observed CO2 over-consumption observed by Riebesell et al. (2007) in this system leads to a
deterioration of the food quality this may not be readily visible on the first trophic level, because at least some microzooplankton may have the capacity to upgrade low quality prey (Veloza et al., 2006) such as the carbon rich algae in the 3×CO2-treatment, and
20
if this is true, the trophic cascade response may thus not be visible until higher levels in the marine food web, such as e.g. for copepods. But effects on higher trophic levels may need longer experimental duration than a few weeks to be clearly manifested. It is also interesting to notice that while the ciliates did not change substantially in biomass, the heterotrophic dinoflagellates did so (Fig. 1). This may be explained by that many
25
dinoflagellates feed on diatoms (compare e.g. feeding guilds discussed in Nejstgaard et al., 1997 and 2001), the phytoplankton group showing the highest growth and graz-ing rates here. It has also been hypothesized that at least some dinoflagellates may
BGD
5, 411–433, 2008Microzoo-phytoplankton interaction in CO2 manipulated setups
K. Suffrian et al.
Title Page
Abstract Introduction
Conclusions References
Tables Figures
◭ ◮
◭ ◮
Back Close
Full Screen / Esc
Printer-friendly Version
Interactive Discussion
trophically upgrade the food for higher trophic levels such as copepods (see discussion and references in Veloza et al., 2006). These are potentially interesting aspects that need to be investigated in future studies. However, to our knowledge, this is the first study in such marine systems and more data is needed before such conclusions can be drawn. It should especially be focused on the possible effects on food quality vs.
5
quantity for higher trophic levels, such as copepods, and perhaps fish.
The general temporal dynamic of the phytoplankton community, observed in our bot-tle incubation experiments, mirrored the dynamic observed inside the mesocosms by other studies (Egge et al., 2007; Paulino et al., 2007; Schulz et al., 2007). They grew during the first ten days of the experiment as a consequence of the nutrients
addi-10
tion (Schulz et al., 2007). During this period microzooplankton was grazing actively (0.28–0.49 d−1) on the autotrophic compartment but without limiting the development of the bloom. The effect of this trophic activity was evident from the microzooplankton biomass increase during the same period. The decline of the bloom after day 10, is therefore due to the nutrient depletion as reported by Schulz et al. (2007), or perhaps
15
viral activity (Larsen et al., 2007) more than a result of grazing. It was only during the initial phase of the experiments when phytoplankton biomass was low, and possi-bly during the post bloom phase, when the instantaneous growth rates were close to zero or negative, that the grazing became more significant and the microzooplankton biomass reached its maximum. Neither did the cyanobacteria appear to be significantly
20
limited by the microzooplankton. Despite of a high daily removal (19%–65% of the SS), the microzooplankton did not control the biomass increase registered during the last two incubation experiments. The lack of microzooplankton grazing may also explain the increase in the cyanobacteria community observed in the mesocosms by Paulino et al. (2007). The general relatively low levels of microzooplankton grazing activity may
25
explain the observed lack of a net heterotrophic phase in this PeECE III mesocosm ex-periment (Egge et al., 2007), and support the hypothesis by Riebesell et al. (2007) that such a system may favour a high export of organic material through the pycnocline.
BGD
5, 411–433, 2008Microzoo-phytoplankton interaction in CO2 manipulated setups
K. Suffrian et al.
Title Page
Abstract Introduction
Conclusions References
Tables Figures
◭ ◮
◭ ◮
Back Close
Full Screen / Esc
Printer-friendly Version
Interactive Discussion
the experiment; especially project leader U. Riebesell for coordinating the project. The staff at the Marine Biological Station, University of Bergen, in particular T. Sørlie and A. Aadnesen, and the Bergen Marine Research Infrastructure (RI) are gratefully acknowledged for support in mesocosm logistics. We further thank K. Nachtigall for technical assistance with pigment measurements, and P. Fritsche for assistance with nutrient and pigment data. IFM-GEOMAR
5
library west bank is acknowledged for help with literature acquisition. Special thanks for the support with microplankton identification go to J. Egge, A. Sazhin. P. Simonelli was funded by the University of Bergen. J. C. Nejstgaard was supported by the Norwegian Research Council (NRC) project 152714/120 30. Y. Carotenuto was funded by the European Marine Research Station Network (MARS) Travel Award for Young Scientist 2004.
10
References
Airs, R. L. and Llewellyn, C. A.: Improved detection and characterization of fucoxanthin-type carotenoids: Novel pigments in Emiliania huxleyi (Prymnesiophyceae), J. Phycol., 42, 391– 399, 2006.
Antajan, E., Chretiennot-Dinet, M.-J., Leblanc, C., Daro, M.-H., and Lancelot, C.:
19’-15
hexanoyloxyfucoxanthin may not be the appropriate pigment to trace occurrence and fate ofPhaeocystis: the case ofP. globosain Belgian coastal waters, J. Sea Res., 52, 165–177, 2004.
Barlow, R. G., Cummings, D. G., and Gibb, S. W.: Improved resolution of mono- and divinyl chlorophylls a and b and zeaxanthin and lutein in phytoplankton extracts using reverse phase
20
C-8 HPLC, Mar. Ecol.-Prog. Ser., 161, 303–307, 1997.
Egge, J. K., Thingstad, T. F., Engel, A., Bellerby, R. G. J., and Riebesell, U.: Primary production during nutrient-induced blooms at elevated CO2 concentrations, Biogeosciences Discuss., 4, 4385–4410, 2007,
http://www.biogeosciences-discuss.net/4/4385/2007/.
25
Engel, A., Schulz, K., Riebesell, U., Bellerby, R., Delille, B., and Schartau, M.: Effects of CO2 on particle size distribution and phytoplankton abundance during a mesocosm bloom experiment (PeECE II), Biogeosciences Discuss., 4, 4101–4133, 2007,
http://www.biogeosciences-discuss.net/4/4101/2007/.
Grasshoff, K. and Kremling, K.: Methods of Seawater Analysis, Wiley-VCH, Weinheim, 1999.
30
BGD
5, 411–433, 2008Microzoo-phytoplankton interaction in CO2 manipulated setups
K. Suffrian et al.
Title Page
Abstract Introduction
Conclusions References
Tables Figures
◭ ◮
◭ ◮
Back Close
Full Screen / Esc
Printer-friendly Version
Interactive Discussion
Guillard, R. R. L. and Ryther, J. H.: Studies of marine planktonic diatoms. I. Cyclotella nana Hustedt and Detonula confervacea Cleve, Can. J. Microbiol., 8, 229–239, 1962.
Irigoien, X., Meyer, B., Harris, R., and Harbour, D.: Using HPLC pigment analysis to investi-gate phytoplankton taxonomy: the importance of knowing your species, Helgoland Marine Reserach, 58, 77–82, 2004.
5
Kuylenstierna, M. and Karlsonm B.: Checklist of phytoplankton in the Skagerrak-Kattegat, 1996–2006.
Landry, M. R.: Estimating rates of growth and grazing mortality of phytoplankton by the dilution method, in: Handbook of methods in aquatic microbial ecology, edited by: Kemp, P. F., Sherr, B. F., Sherr, E. B., and Cole, J. J., Lewis Publishers, Boca Raton, 715–722, 1993.
10
Landry, M. R. and Hassett, R. P.: Estimating the Grazing Impact of Marine Micro-Zooplankton, Mar. Biol., 67, 283–288, 1982.
Larsen, J. B., Larsen, A., Thyrhaug, R., Bratbak, G., and Sandaa, R.-A.: Marine viral pop-ulations detected during a nutrient induced phytoplankton bloom at elevated pCO2 levels, Biogeosciences Discuss., 4, 3961–3985, 2007,
15
http://www.biogeosciences-discuss.net/4/3961/2007/.
Nejstgaard, J. C., Gismervik, I., and Solberg, P. T.: Feeding and reproduction by Calanus finmarchicus, and microzooplankton grazing during mesocosm blooms of diatoms and the coccolithophoreEmiliania huxleyi, Mar. Ecol.-Prog. Ser., 147, 197–217, 1997.
Nejstgaard, J. C., Naustvoll, L. J., and Sazhin, A.: Correcting for underestimation of
microzoo-20
plankton grazing in bottle incubation experiments with mesozooplankton, Mar. Ecol.-Prog. Ser., 221, 59–75, 2001.
Paulino, A. I., Egge, J. K., and Larsen, A.: Effects of increased atmospheric CO2 on small and intermediate sized osmotrophs during a nutrient induced phytoplankton bloom, Biogeo-sciences Discuss., 4, 4173–4195, 2007,
25
http://www.biogeosciences-discuss.net/4/4173/2007/.
Putt, M. and Stoecker, D. K.: An experimentally determined carbon: Volume ratio for marine “oligotrichous” ciliates from estuarine and coastal waters, Limnol. Oceanogr., 34, 1097–1103, 1989.
Riebesell, U., Schulz, K. G., Bellerby, R. G. J., Botros, M., Fritsche, P., Meyerh ¨ofer, M., Neill,
30
C., Nondal, G., Oschlies, A., Wohlers, J., and Z ¨ollner, E.: Enhanced biological carbon con-sumption in a high CO2ocean, Nature, 450, 545–548, 2007.
Riebesell, U., Zondervan, I., Rost, B., Tortell, P. D., Zeebe, R. E., and Morel, F. M. M.: Reduced
BGD
5, 411–433, 2008Microzoo-phytoplankton interaction in CO2 manipulated setups
K. Suffrian et al.
Title Page
Abstract Introduction
Conclusions References
Tables Figures
◭ ◮
◭ ◮
Back Close
Full Screen / Esc
Printer-friendly Version
Interactive Discussion
calcification of marine plankton in response to increased atmospheric CO2, Nature, 407, 364–367, 2000.
Russell, A. D., H ¨onisch, B., Spero, H. J., and Lea, D. W.: Effects of seawater carbonate ion concentration and temperature on shell U, Mg, and Sr in cultured planktonic foraminifera, Geochim. Cosmochim. Ac., 68, 4347–4361, 2004.
5
Schulz, K. G., Riebesell, U., Bellerby, R., Biswas, H., Meyerh ¨ofer, M., M ¨uller, M. N., Egge, J. K., Nejstgaard, J. C., Neill, C., Wohlers, J., and Z ¨ollner, E.: Build-up and decline of organic matter during PeECE III, Biogeosciences Discuss., 4, 4539–4570, 2007,
http://www.biogeosciences-discuss.net/4/4539/2007/.
Str ¨uder-Kypke, M. C., Kypke, E. R., Agatha, S., Warwick, J., and Montagnes, D. J. S.: The
10
user-friendly guide to coastal planktonic ciliates,http://www.liv.ac.uk/ciliate, 2000-2001. Throndsen, J. and Eikrem, W.: Marine Mikroalger i farger, Almater Forlag, Oslo, 2005.
Throndsen, J., Hasle, G. R., and Thangen, K.: Norsk kystplanktonflora, Almater Forlag Oslo, 2003.
Uterm ¨ohl, H.: Zur Vervollkommnung der quantitativen Phytoplankton-Methodik. Mitteilungen
15
der internationalen Vereinigung f ¨ur theoretische und angewandte Limnologie, 9, 1–38, 1958. Veloza, A. J., Chu, F.-L. E., and Tang, K. W.: Trophic modification of essential fatty acids by
heterotrophic protists and its effects on the fatty acid composition of the copepod Acartia tonsa, Mar. Biol., 148, 779–788, 2006.
Zapata, M., Jeffrey, S. W., Wright, S. W., Rodriguez, F., Garrido, J. L., and Clementson, L.:
Pho-20
tosynthetic pigments in 37 species (65 strains) of Haptophyta: implications for oceanography and chemotaxonomy, Mar. Ecol.-Prog. Ser., 270, 83–102, 2004.
BGD
5, 411–433, 2008Microzoo-phytoplankton interaction in CO2 manipulated setups
K. Suffrian et al.
Title Page
Abstract Introduction
Conclusions References
Tables Figures
◭ ◮
◭ ◮
Back Close
Full Screen / Esc
Printer-friendly Version
Interactive Discussion Table 1. Nutrient data measured at beginning and end of the dilution experiments. Data are
shown for 1×, 2×and 3×CO2treatments att0andt24.
DATE DAY EXP NO−
2 NO
−
3 PO 3−
4 Si
µmol l−1
µmol l−1
µmol l−1
µmol l−1
17/05 1 1×d1 t0 0.22 14.29 0.68 3.08
t24 0.23 14.22 0.67 2.93
24/05 7 1×d7 t0 0.13 7.40 0.27 0.28
t24 0.13 6.15 0.11 0.08
29/05 13 1×d13 t0 0.20 1.93 1.31 0.63
t24 0.11 2.03 0.19 0.30
05/06 20 1×d20 t0 0.10 1.89 0.18 0.34
t24 0.07 1.84 0.13 0.28
18/05 2 2×d2 t0 0.22 14.41 0.67 2.96
t24 0.20 13.62 0.69 2.33
25/05 8 2×d8 t0 0.14 6.94 0.19 0.16
t24 0.13 5.04 0.14 0.15
30/05 14 2×d14 t0 0.09 1.73 0.13 0.25
t24 0.09 1.73 0.11 0.38
06/06 21 2×d21 t0 0.05 1.72 0.15 0.31
t24 0.06 1.65 0.09 0.32
19/05 3 3×d3 t0 0.18 12.72 0.73 2.47
t24 0.19 12.61 0.69 1.56
26/05 9 3×d9 t0 0.15 5.51 0.18 0.16
t24 0.10 4.61 0.14 0.15
31/05 15 3×d15 t0 0.07 1.61 0.15 0.46
t24 0.08 1.55 0.08 0.33
07/06 22 3×d22 t0 0.02 1.32 0.13 0.34
t24 0.05 1.17 0.08 0.30
BGD
5, 411–433, 2008Microzoo-phytoplankton interaction in CO2 manipulated setups
K. Suffrian et al.
Title Page
Abstract Introduction
Conclusions References
Tables Figures
◭ ◮
◭ ◮
Back Close
Full Screen / Esc
Printer-friendly Version
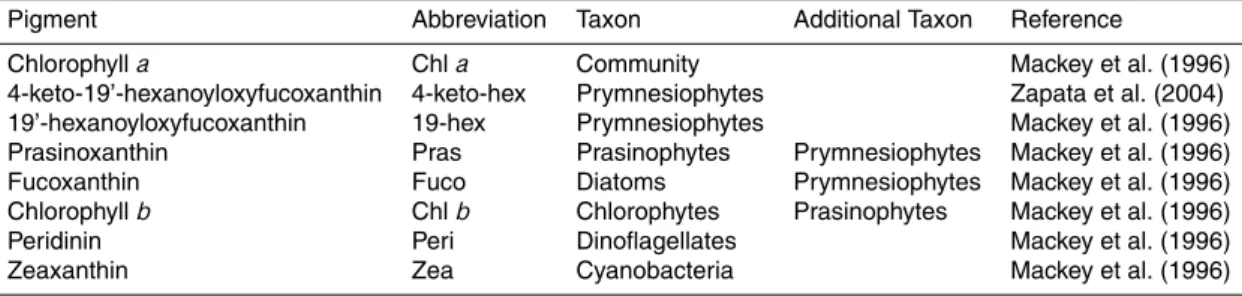
Interactive Discussion Table 2.Name and abbreviation of the pigments used as algae taxon-specific markers. “Taxon“
denotes the major taxon the pigment was considered to reflect here, while the “Additional taxon” denotes other groups that potentially could contribute to the pool of the specific pigment (based on the reference given); the pigment was not used to characterize the additional taxon in this study.
Pigment Abbreviation Taxon Additional Taxon Reference
Chlorophylla Chla Community Mackey et al. (1996) 4-keto-19’-hexanoyloxyfucoxanthin 4-keto-hex Prymnesiophytes Zapata et al. (2004) 19’-hexanoyloxyfucoxanthin 19-hex Prymnesiophytes Mackey et al. (1996) Prasinoxanthin Pras Prasinophytes Prymnesiophytes Mackey et al. (1996) Fucoxanthin Fuco Diatoms Prymnesiophytes Mackey et al. (1996) Chlorophyllb Chlb Chlorophytes Prasinophytes Mackey et al. (1996) Peridinin Peri Dinoflagellates Mackey et al. (1996) Zeaxanthin Zea Cyanobacteria Mackey et al. (1996)
BGD
5, 411–433, 2008Microzoo-phytoplankton interaction in CO2 manipulated setups
K. Suffrian et al.
Title Page
Abstract Introduction
Conclusions References
Tables Figures
◭ ◮
◭ ◮
Back Close
Full Screen / Esc
Printer-friendly Version
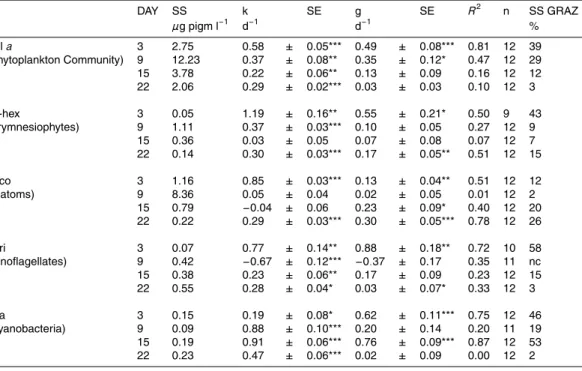
Interactive Discussion Table 3a. Compilation of pigment key data for dilution experiment based run with water from
mesocosm 1×CO2 (a), 2×CO2 (b) and 3×CO2 (c). Day of experiment (DAY), standing stock at time 0 (SS), instantaneous coefficient of phytoplankton growth (k), instantaneous coefficient of grazing mortality (g), standard error of the regression coefficients (SE), significance level (*p<0.05, **p<0.01, ***p<0.001), correlation coefficient (R2), number of means used for the calculation ofk andg(n), dynamic standing stock grazed daily (SS GRAZ %), not detectable (nd), not calculated (nc).
a DAY SS k SE g SE R2 n SS GRAZ
µg pigm l−1 d−1 d−1 %
Chla 1 1.99 0.56 ± 0.05*** 0.28 ± 0.08** 0.67 9 25 (Phytoplankton Community) 7 5.80 0.99 ± 0.11*** 0.49 ± 0.15** 0.51 12 39 13 6.54 0.08 ± 0.04 0.19 ± 0.06* 0.58 9 17 20 2.54 0.16 ± 0.02*** 0.06 ± 0.03* 0.31 12 5 19-hex 1 0.01 1.53 ± 0.12*** 0.44 ± 0.17* 0.42 11 36 (Prymnesiophytes) 7 0.51 1.23 ± 0.05*** 0.29 ± 0.08** 0.55 12 25 13 0.77 −0.39 ± 0.03*** 0.07 ± 0.04 0.20 12 7 20 0.08 0.20 ± 0.07* 0.16 ± 0.11 0.17 12 14 Fuco 1 0.42 1.15 ± 0.06*** 0.41 ± 0.10** 0.73 9 34 (Diatoms) 7 4.47 1.12 ± 0.06*** 0.35 ± 0.08** 0.73 9 29 13 2.12 −0.31 ± 0.03*** 0.25 ± 0.05*** 0.71 12 22 20 0.24 0.29 ± 0.071** 0.55 ± 0.10*** 0.73 12 42
Peri 1 0.00 nd ± nd nd ± nd nd nd nc
(Dinoflagellates) 7 0.11 −0.08 ± 0.27*** −1.01 ± 0.35* 0.55 9 nc 13 0.34 0.78 ± 0.14*** 0.64 ± 0.21* 0.49 12 47 20 1.13 0.49 ± 0.08*** 0.32 ± 0.14* 0.35 12 28 Zea 1 0.14 0.71 ± 0.14*** 0.55 ± 0.20* 0.42 12 42 (Cyanobacteria) 7 0.03 2.25 ± 0.12*** 1.04 ± 0.17*** 0.85 9 65 13 0.19 0.74 ± 0.12*** 0.65 ± 0.17** 0.62 12 48 20 0.30 0.86 ± 0.05*** 0.32 ± 0.07*** 0.68 12 28
BGD
5, 411–433, 2008Microzoo-phytoplankton interaction in CO2 manipulated setups
K. Suffrian et al.
Title Page
Abstract Introduction
Conclusions References
Tables Figures
◭ ◮
◭ ◮
Back Close
Full Screen / Esc
Printer-friendly Version
Interactive Discussion Table 3b. Compilation of pigment key data for dilution experiment based run with water from
mesocosm 2×CO2otherwise as Table 3a.
b DAY SS k SE g SE R2 n SS GRAZ
µg pigm l−1 d−1 d−1 %
Chla 2 3.12 0.12 ± 0.04* 0.29 ± 0.06** 0.68 12 25 (Phytoplankton Community) 8 10.02 0.55 ± 0.03*** 0.43 ± 0.04*** 0.92 12 35 14 4.64 0.02 ± 0.04 0.06 ± 0.06 0.09 12 6 21 2.52 0.37 ± 0.03*** 0.28 ± 0.05** 0.75 12 24 19-hex 2 0.02 1.10 ± 0.10*** 0.45 ± 0.14* 0.49 12 36 (Prymnesiophytes) 8 0.89 0.63 ± 0.05*** 0.10 ± 0.07 0.18 12 9
14 0.41 −0.07 ± 0.01*** 0.11 ± 0.01** 0.86 12 10 21 0.08 0.38 ± 0.04*** 0.42 ± 0.06*** 0.82 12 34 Fuco 2 0.64 1.15 ± 0.04*** 0.56 ± 0.06*** 0.89 12 43 (Diatoms) 8 8.02 0.31 ± 0.02*** 0.07 ± 0.03* 0.35 12 7
14 0.88 −0.22 ± 0.03*** 0.07 ± 0.05 0.19 12 7 21 0.31 −0.09 ± 0.06 0.44 ± 0.09*** 0.10 12 36 Peri 2 0.05 1.05 ± 0.17*** 1.09 ± 0.25** 0.65 12 66 (Dinoflagellates) 8 0.30 0.10 ± 0.05 0.21 ± 0.08* 0.43 11 19 14 0.32 0.81 ± 0.04*** 0.14 ± 0.06* 0.37 12 13 21 0.86 0.39 ± 0.03*** 0.30 ± 0.04*** 0.83 12 26 Zea 2 0.13 0.79 ± 0.07*** 0.77 ± 0.10*** 0.86 12 54 (Cyanobacteria) 8 0.06 1.02 ± 0.04*** 0.43 ± 0.06*** 0.84 12 35 14 0.22 0.70 ± 0.07*** 0.66 ± 0.11*** 0.79 12 49 21 0.27 0.71 ± 0.05*** 0.23 ± 0.08* 0.45 12 20
BGD
5, 411–433, 2008Microzoo-phytoplankton interaction in CO2 manipulated setups
K. Suffrian et al.
Title Page
Abstract Introduction
Conclusions References
Tables Figures
◭ ◮
◭ ◮
Back Close
Full Screen / Esc
Printer-friendly Version
Interactive Discussion Table 3c. Compilation of pigment key data for dilution experiment based run with water from
mesocosm 3×CO2otherwise as Table 3a.
c DAY SS k SE g SE R2 n SS GRAZ
µg pigm l−1 d−1 d−1 %
Chla 3 2.75 0.58 ± 0.05*** 0.49 ± 0.08*** 0.81 12 39 (Phytoplankton Community) 9 12.23 0.37 ± 0.08** 0.35 ± 0.12* 0.47 12 29 15 3.78 0.22 ± 0.06** 0.13 ± 0.09 0.16 12 12 22 2.06 0.29 ± 0.02*** 0.03 ± 0.03 0.10 12 3 19-hex 3 0.05 1.19 ± 0.16** 0.55 ± 0.21* 0.50 9 43 (Prymnesiophytes) 9 1.11 0.37 ± 0.03*** 0.10 ± 0.05 0.27 12 9
15 0.36 0.03 ± 0.05 0.07 ± 0.08 0.07 12 7 22 0.14 0.30 ± 0.03*** 0.17 ± 0.05** 0.51 12 15 Fuco 3 1.16 0.85 ± 0.03*** 0.13 ± 0.04** 0.51 12 12 (Diatoms) 9 8.36 0.05 ± 0.04 0.02 ± 0.05 0.01 12 2
15 0.79 −0.04 ± 0.06 0.23 ± 0.09* 0.40 12 20 22 0.22 0.29 ± 0.03*** 0.30 ± 0.05*** 0.78 12 26 Peri 3 0.07 0.77 ± 0.14** 0.88 ± 0.18** 0.72 10 58 (Dinoflagellates) 9 0.42 −0.67 ± 0.12*** −0.37 ± 0.17 0.35 11 nc 15 0.38 0.23 ± 0.06** 0.17 ± 0.09 0.23 12 15 22 0.55 0.28 ± 0.04* 0.03 ± 0.07* 0.33 12 3 Zea 3 0.15 0.19 ± 0.08* 0.62 ± 0.11*** 0.75 12 46 (Cyanobacteria) 9 0.09 0.88 ± 0.10*** 0.20 ± 0.14 0.20 11 19 15 0.19 0.91 ± 0.06*** 0.76 ± 0.09*** 0.87 12 53 22 0.23 0.47 ± 0.06*** 0.02 ± 0.09 0.00 12 2
BGD
5, 411–433, 2008Microzoo-phytoplankton interaction in CO2 manipulated setups
K. Suffrian et al.
Title Page Abstract Introduction Conclusions References Tables Figures ◭ ◮ ◭ ◮ Back Close
Full Screen / Esc
Printer-friendly Version Interactive Discussion 0 20 40 60 80 100 120 140
3xd3 3xd9 3xd15 3xd22
0 20 40 60 80 100 120 140
2xd2 2xd8 2xd14 2xd21
0 20 40 60 80 100 120 140
1xd1 1xd7 1xd13 1xd20
Bi o m a s s (µ g C l -1) nd
dinoflagellates ciliates other
Dinoflagellates Ciliates Other
0 20 40 60 80 100 120 140
3xd3 3xd9 3xd15 3xd22
0 20 40 60 80 100 120 140
2xd2 2xd8 2xd14 2xd21
0 20 40 60 80 100 120 140
1xd1 1xd7 1xd13 1xd20
Bi o m a s s (µ g C l -1) nd
dinoflagellates ciliates other
Dinoflagellates Ciliates Other
Fig. 1.Relative biomasses (µg C l−1) of major groups of heterotrophic protists at start (t
0) of the
respective experiments. Data from the 3×d22 experiment is missing (=not determined, nd).
BGD
5, 411–433, 2008Microzoo-phytoplankton interaction in CO2 manipulated setups
K. Suffrian et al.
Title Page Abstract Introduction Conclusions References Tables Figures ◭ ◮ ◭ ◮ Back Close
Full Screen / Esc
Printer-friendly Version
Interactive Discussion -0.4 0.0 0.4 0.8 1.2 1.6
d3
d22 d15
d9
-0.4 0.0 0.4 0.8 1.2 1.6
d21
d14 d8
d2
-0.40.00.0 0.4 0.8 1.2 1.6 0.4 0.8 1.2 1.6 2.2 2.4 0.8 1.0 1.2 d7 d20 d13 d1 Zea (Cyanobacteria) d9 d15 d22 d3 d8 d14 d21 d2 0.0 0.4 0.8 1.2 1.6
d13 d20 d7
d1
19-hex (Prymnesiophytes)
d22
d15 d9 d3
d21 d8 d14 d2 0.0 0.4 0.8 1.2 1.6 d1 d7 d20 d13 Fuco (Diatoms) d3 d9 d15 d22 d8 d21 d14 d2 0.0 0.4 0.8 1.2 1.6 d7 d1 d20 d13 Chl a (Phytoplankton community)
Specific growth k d-1
S p e c if ic g ra z in g g d -1
Fig. 2. Instantaneous grazing mortality coefficient (g) against instantaneous phytoplankton growth coefficient (k) based on chlorophyll (Chl) a (panel a), fucoxanthin (Fuco, diatoms) (panelb), 19’-hexanoyloxyfucoxanthin (19-hex, prymnesiophytes) (panel c), and zeaxanthin (Zea, cyanobacteria) (panel d). The dotted lines indicate steady state, arrows indicate the temporal order of the experiments, and data points are labelled with the respective day of ex-periment.