Does Money in Schools Matter? Evaluating the Effects
of FUNDEF on Wages and Test Scores in Brazil
*Naércio Menezes-Filho
Elaine Pazello
University of São Paulo
Abstract
In this paper we investigate the effects of the 1998 reform in the funding of
fundamental education in Brazil (FUNDEF) on the relative wages of public
school teachers and on the relative proficiency of public school pupils. The
evidence suggests that, on average, FUNDEF raised the public school teachers’
relative wages and improved the relative proficiency of the public school
students. Some indirect evidence was presented that showed that the effect of
FUNDEF on proficiency seems to be related to its effect on wages and on
school characteristics. The effect on proficiency seems to be concentrated in the
municipal schools in the Northeast of the country.
*
1) Introduction
In terms of income distribution, Brazil is one the most unequal countries in the world.1
Education plays an import role in explaining this fact, as about 50% of the income
distribution in Brazil can be associated with education. This happens because returns to
education are very high in Brazil and only a small proportion of the population has access
to higher levels of education.2 Despite the fact that access to the first schooling year is almost universal in Brazil, children from a poor background tend to drop out of the school
system quite early on.3 One the reasons behind this high drop-out rate may be the quality of the education they receive in the public system.
In 1998, a reform in the funding of the public fundamental education system was
introduced in Brazil, with the creation of FUNDEF (Fundo para Manutenção e
Desenvolvimento do Ensino Fundamental e Valorização do Magistério – Fund for
Maintenance and Development of the Fundamental Education and Valorization of
Teaching). FUNDEF main aim is redistribute resources from the richer to the poorer
regions and to increase public teachers´ wages. The aim of this paper is to examine whether
the introduction of FUNDEF has in fact increased the earnings of the public school
teachers, relative to their private schools counterparts, and the relative performance of
public school pupils in test scores.
The Brazilian education system is divided in cycles. The first cycle (primary
education) consists of four years, the second (secondary) also has four years, the third (high
1
The 10% in the top of the income distribution appropriate 50% of all income in Brazil. 2
See Menezes-Filho et al (2002). A college graduate earns about three times more than a high school graduate and only about 10% of the population has a college degree.
3
school) lasts three years and the fourth (college) usually lasts between four and five years.
The primary and secondary cycles together form what is called the fundamental education,
which was affected by the introduction of FUNDEF.
The system has both private (paid) and public (free) schools. Figure 1 presents the
share of pupils studying in private schools and the share of schools that are privately owned
in selected grades. One can notice that the share of students in private schools rises with the
level of education, which can be explained by the high drop-out rate among kids from a
poor background, which tend to study in public schools. Moreover, the share of private
schools is higher than the share of students in private schools, especially from the 8th grade onwards, which means that private schools tend to have fewer students than the public ones
after that grade.
In terms of college education, the situation is radically different, since students from
public colleges perform much better on average in evaluation tests than do the students
from private institutions. As such, there is a very competitive exam to gain admission into
each of the public colleges, and students from private high schools generally do much
better in these admissions exams than do pupils from the public school system that
managed to conclude high school. Therefore, most of the students from a poor background,
which went through the public high school system, have to go to private colleges or try
their luck in the labor market and inequality tends to self-perpetuate.
For all these reasons, it is important to evaluate an education reform that aimed at
changing the funding structure of the public school system, in order to redistribute
resources to the poorest regions, such as FUNDEF. Barros et al (2001), using household
level data, found that the wages of public school teachers rose by about 8% with respect to
that the relative wages of public school teachers increased between 1997 and 1999,
particularly in the municipal system in the Northeast of Brazil, which they attribute to
FUNDEF. However, there is no study evaluating the impact of FUNDEF using school level
data and examining its effects on the relative proficiency of public school pupils. We think
that this paper also relates to a broader literature the tries to evaluate the impact of
resources spent on education and on teacher labor market (see Hanushek, 2003, for
example).
The structure of the paper is as follows. In section 2 we describe the FUNDEF
program and section 3 describes the data. Section 4 presents the econometric methodology,
while the results are presented in section 5 and the conclusions in section 6.
2) The FUNDEF Program
In each Brazilian municipality, the public schools may belong to the State system or to the
municipality system. The new Brazilian constitution, which took effect in 1988, stated that
all States, Municipalities and the Federal Government had to spend a fixed share of their
tax and transfer revenues in their public education system. This share was equal to 25% in
the cases of states and municipalities and 18% in the case of the federal government. With
this new legislation, the amount of resources allocated to education increased, but the so did
heterogeneity of the public schools, since richer states with a small share of students in their
system were spending much more per pupil than were poor municipalities with a large
resources were effectively being spent on the educational system itself and not on other
activities that could be remotely linked to education. 4
The introduction of FUNDEF aimed at changing the structure of funding in
fundamental education. Since its implementation (January 1st 1998) and for a period of 10 years, all municipalities and states had to spend 60% of their education resources (that is,
15% of their revenues) exclusively with the maintenance and development of its
fundamental education. However, instead of being directly applied by the government unit,
all resources were firstly directed to a common fund. In a second moment, the resources
were redistributed to the states and municipalities, in direct proportion to the number of
students enrolled in each state and municipality fundamental school system. Moreover,
60% of the resources received through this fund had to be spent with teachers´ wages.
Finally, a minimum amount of spending per pupil was established, and in the cases where
this amount could not be achieved with the fund resources alone, the federal government
would complement it.
Hence, FUNDEF affected the education system in several ways. Suppose that a
municipality had revenues (from tax and transfers) that amounted to R$100. With the 1988
constitution, it had to destine R$25 to education in any way it preferred. After FUNDEF, it
had to donate R$15 to the fund, whereas the amount if received back depended on the
number of pupils enrolled in the fundamental education. If its share of pupils was equal to
its share of resources to the fund, it would receive the same R$15 back. Moreover, at least
R$9 had to be spent in teachers´ wages.
4
Rich municipalities with a small number of public schools, for example, spent the resources in
Therefore, the impact of FUNDEF on the schools and on teachers’ wages in a
municipality or state depended on the amount of resources initially allocated to the
fundamental education system out of its education budget; on the initial share of wages out
of this amount and on its share of enrollments as compared to its share of revenues within
the State.
Table 1 reports the financial redistribution that took place between the each state
and its municipalities in 1998 for the different regions. The transfers within a State would
sum zero, were it not for the federal government transfers that complement the budget if the
expenditures per student do not reach the minimum amount. It is clear that in all regions,
with the exception of the south-east (SE), the transfer favored the municipalities. This
happened because their proportion of enrolments was high relative to the proportion of their
revenues.
Figure 2 shows the behavior the expenditures on education in each state as a
proportion of the GDP over time. Since the proportion of the revenues spent on education
in each unit should be constant over time (determined by the Constitution), the changes in
the share of education expenditures should correspond to changes in the revenues/GDP
ration. It is clear that there was a rise in the share of education expenditures in the country
as a whole between 1997 and 1998, with the main responsible being the states and
municipalities of the Northeast, where the rise actually starting in 1997. Therefore, a higher
share of resources was being spent on education over the period under analysis.
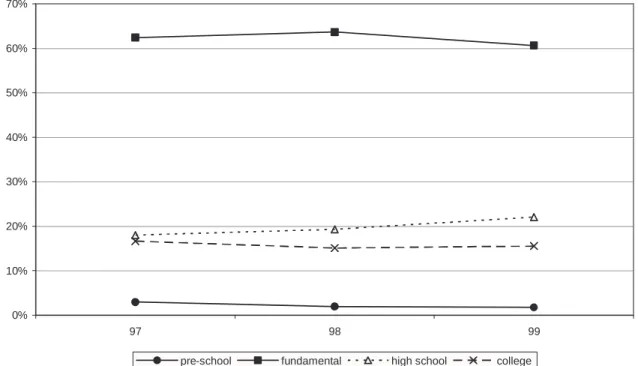
FUNDEF established that 60% of all education resources should be spent on
fundamental education. Figure 3 shows that the states were, on average, already spending
more than 60% of its education resources on fundamental education in 1997. This is also
Paulo, Rio de Janeiro and Paraná (figure not shown). Between 1998 and 1999, one can
notice a decline in share of resources accruing to fundamental education and a rise in the
high school share of education expenditures.
Figure 4 shows that the Municipal system as a whole was already spending about
70% of its education resources on the fundamental cycle. The São Paulo municipalities
were the only ones spending less than the minimum required, on average (figure not
shown). However, the share of resources spent on the fundamental education rose by about
8% between 1997 and 1998, with a similar decline in the amount destined to the pre-school
system. This could be the result of the effort made by municipalities that were not
previously spending the minimum required and had to substitute resources away from the
pre-school to the fundamental education.
Figure 5 presents the evolution of the total number of students in the fundamental
education in each system (state, municipality and private schools) between 1997 and 1999.
It is clear that the total number of students rose over time, with a rise in the number of
students in the municipal system more than compensating for the decline in the number of
students in the state system. It seems therefore that students are being transferred fron the
state to the municipal system, which could perhaps be associated with the shifts in the
allocation of the education resources from the states to the municipalities. It is interesting to
note however, that these movements to the municipal system and away from the State
system occurred even in the states which experienced a shift in resources in the opposite
direction, like São Paulo and Minas Gerais, which means that it could actually reflect a
trend that pre-dates the introduction of Fundef.
In Figure 6 we present the evolution of the real expenditures per pupil in the
clear that there was a rise in real expenditures between 1997 and 1998, in both the state and
the municipal systems, despite the rise in the number of students, followed by a decline in
the level of expenditures in the state system between 1998 and 1999.
Figures 7 and 8 present the equivalent numbers for the Northeast and Southeast
regions separately. One can notice from figure 7 that in the northeast the pattern is very
similar to the one observed for the country as a whole. The stabilization of real
expenditures between 1998 and 1999 despite falling expenditures in both the municipal and
state systems can be explained by the rise in the federal transfer to the units that did not
reach the stipulated minimum amount of expenditures per pupil. Figure 8 shows that in the
Southeast region, where the state system was a net beneficiary of the FUNDEF program,
real expenditures in the municipal system fell continuously between 1997 and 1999.
Figure 9 shows that the number of schools offering fundamental education fell
between 1997 and 1999 especially due to the fall in the number of State schools, although
there was a slight fall in the number of municipal schools as well. This happened both in
the Northeast ad in the Southeast (figures not shown), with the exception of the number of
municipal schools in the southeast, which rose between 1997 and 1998, despite the fall in
real expenditures documented in the previous figure.
Despite the fall in the number of schools, Figure 10 shows that the total number of
teachers actually rose between 1997 and 1999, mainly due to the rise in the municipal
system, which out-weighted the fall in the state system. It seems therefore that teachers also
moved from the municipal to the state system, following their students. This was true both
in the Northeast and in the Southeast regions as well (figures not shown). It is important to
note that the number of private schools and of their teachers has remained constant over
Finally, Figure 11 shows that average class sizes remained basically constant
between 1997 and 1999 in the system as a whole, but there was a rise in the average class
size in the municipal system, which was compensated by a fall in the private schools. This
was especially true in the Northeast (figures not shown).
3) Econometric Methodology
The empirical strategy we will follow to evaluate the impact of the FUNDEF program is
based on the differences-in-differences methodology, used in Card (1990) and described in
details by Angrist and Krueger (1999). In the first step of his methodology we evaluate
whether the FUNDEF impacted the public schools teachers’ wages relative to their private
schools counterparts. In the second step we investigate whether FUNDEF has improved the
proficiency of the public schools pupils with respect to their private schools counterparts.
FUNDEF was introduced in 1998. Therefore, if FUNFED was effective in raising
public schools teachers’ wages, one should observe an increase in their relative wages in
1999 with respect to their relative wages in 1997. More formally, suppose that the
conditional mean wages are defined by:
s t oi
w
E[ ]= β +γ (1)
In the absence of FUNDEF, the teachers’ wages would be equal to the sum of a year effect
that is common to all schools and a school effect (public or private) that is fixed over time.5
Suppose also that the effect of FUNDEF was to raise wages by a constant, that is:
δ +
= [ ]
]
[wfi E woi
E (2)
5
This means that the teachers’ wages in both private and public schools in 1997 and 1999
can be written as:
it i s t
it F
w =β +γ +δ +ε (3)
where Fi is a dummy variable equal to 1 if school i was directly affected by FUNDEF, that
is, it was a public school observed in 1999. Differentiating the wages across schools and
years, we have:
δ = = = − = = − = = − = = ]} 97 , / [ ] 97 / / [ { ]} 99 , / [ ] 99 , / [ { t priv s w E t pub s w E t priv s w E t pub s w E i i i i (4)
As many school and students’ characteristics may have changed between 1997 and
1999, and in public schools differently from in the private ones, we will stack the micro
data for all schools and years and estimate an equation like:
it it it i s t
it F X S
w =β +γ +δ +θ +λ +ε (5)
where X is a vector of school characteristics and S is a vector of the teachers
characteristics.
The main identification assumption we need is that:
0 ]} 97 , , , / [ ] 97 / , , / [ { ]} 99 , , , / [ ] 99 , , , / [ { = = = − = = − = = − = = t priv s S X E t pub s S X E t priv s S X E t pub s S X E i i i i ε ε ε ε (6)
that is, there could be no changes in the unobserved characteristics of the public schools or
of their teachers, relative to the private ones, between 1997 and 1999. Since we have no
idea about the plausibility of this assumption, we will include as many observable
characteristics as possible given our data set, and compare their means between 1997 and
In the second step we will use the same methodology, but using the students
performance in test scores instead of the teachers’ wages as the dependent variable. Firstly,
we will estimate an equation of proficiency at the pupil level, as a function of the dummy
variables described above and of the students’ characteristics, in order to investigate
whether FUNDEF has raised average test scores of the public school students, as compared
to private schools ones, unconditionally:
it it i s t
i F Z
y =β +γ +δ +α +ε (6)
where Z is a vector of the students characteristics. We then introduce the school
characteristics to examine its effect onδ :
i it it i s t
i F Z X
y =β +γ +δ +α +θ +ε (7)
and finally, we introduce the teachers’ characteristics and their wages:
i it it
it it i s t
i F Z X S W
y =β +γ +δ +α +θ +λ +κ +ε (8)
If the effect of FUNDEF on the students’ test scores was the result of improvements
of the school characteristics, we should observe a decline in δ once we introduce them in
the regression, and the same is valid for the teachers’ wages. This is the methodology we
use to verify how (if at all) has FUNDEF raised the proficiency of the students in public
schools.
3) Data
The data we use in this part of the project come from SAEB (Sistema de Avaliação
do Ensino Básico) a survey carried out by the Ministry of Education. This data set has
1995, 1997, 1999 and 2001. As FUNDEF was introduced in 1999 (see above) we will only
use the 1997 and 1999 waves. Each student in each school was tested for his/her
proficiency in one out of three possible subjects: Portuguese, Mathematics or Sciences. The
information on the teacher responsible for this subject and the school characteristics were
matched to each student to form the final data set. In this version of the paper, we will use
only the test scores of the students that were in the 8th grade, the last grade of the
fundamental education.
The data set contains a very detailed set of characteristics of each student, school,
teacher and director for all schools in the sample. Table 2 presents the summary statistics of
the students’ characteristics. The percentage of boys is slightly higher in the private
schools, although girls form the majority of students in both systems. It is interesting to
note that the mean age in the private schools is much lower than in the public ones, with
may reflect late start or higher grade repetition. The differences in the family background
are quite striking, as about 48% of the mothers of private school students have a college
degree as compared to 9% in the public schools! This difference remained basically the
same in 1999. The percentage of pupils that have failed the grade exams in the past is very
high, reaching 27% in the private and 59% in the public system in 1997, declining in both
systems by about 5 percentage points between 1997 and 1999.
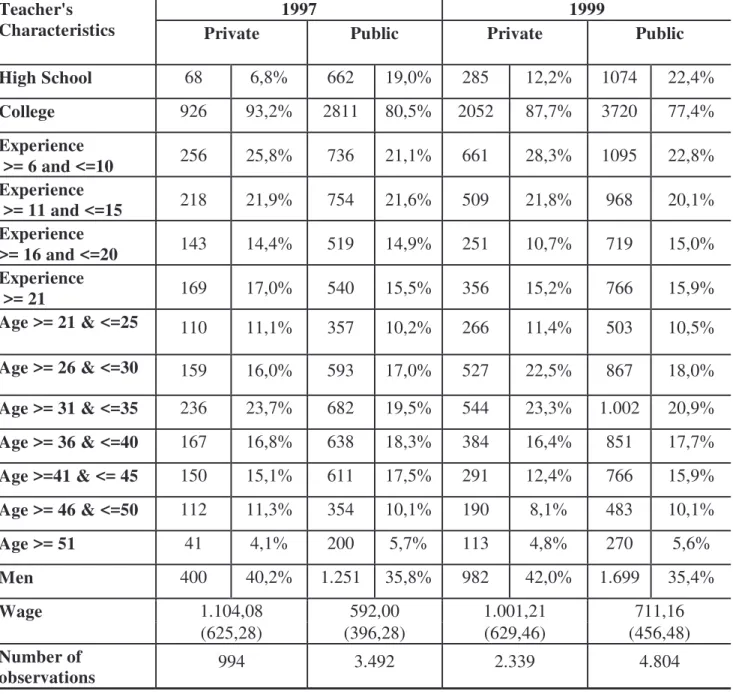
Table 3 presents a summary of the teachers’ characteristics. The first thing to notice
is that sample sizes increased between the 97 and 99 sample. This may bias our estimation
results if it affected the composition of the public and private school teachers differently in
terms of unobservable characteristics.6 One can notice that about 93% of private school
6
teachers were college educated in 1997, as compared to 80% in the public schools, a
difference of about 13 percentage points. In 1999 the difference in terms of college
education was in the range of 10 percentage points. In terms of experience and age, there
were no marked differences between the 1999 and the 1997 sample means. In terms of
average wages however, we can see that the difference between the private and public
schools that was R$512 in 1997, declined to about R$290 in 1999, a reduction of about
43%!7
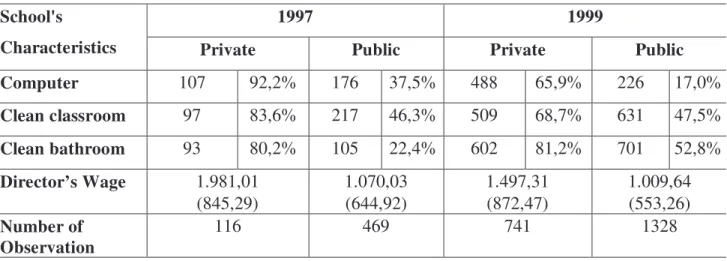
Table 4 presents the description of some school characteristics. This is the most
problematic part of the data, since there are not many school characteristics in the 1999
survey, and there are differences in the way that the questions were formulated between the
1997 and the 1999 surveys. Therefore, a comparison between the 1997 and 1999 data is
problematic, and we should concentrate on the comparison between public and private
schools in each year.8 One can notice that in 1997 about 97% of the private school had
computers, whereas only 37% of the public schools had at least one. In 1999 the question
asked about the number of computers used by students, and so the proportion decreased to
66% in the private schools and 17% in the public system. It is interesting to note that the
difference in terms of the director’s wage between the private and public schools has also
declined between 1997 and 1999, from approximately R$900 to about R$490, a change of
about 45%, in line with the teachers’ wages.
4) Results
7
The original information on teachers’ wages was in the form of intervals, so we used the midpoints of each interval to construct the means, and converted into real wages, using the average inflation rate in the period. 8
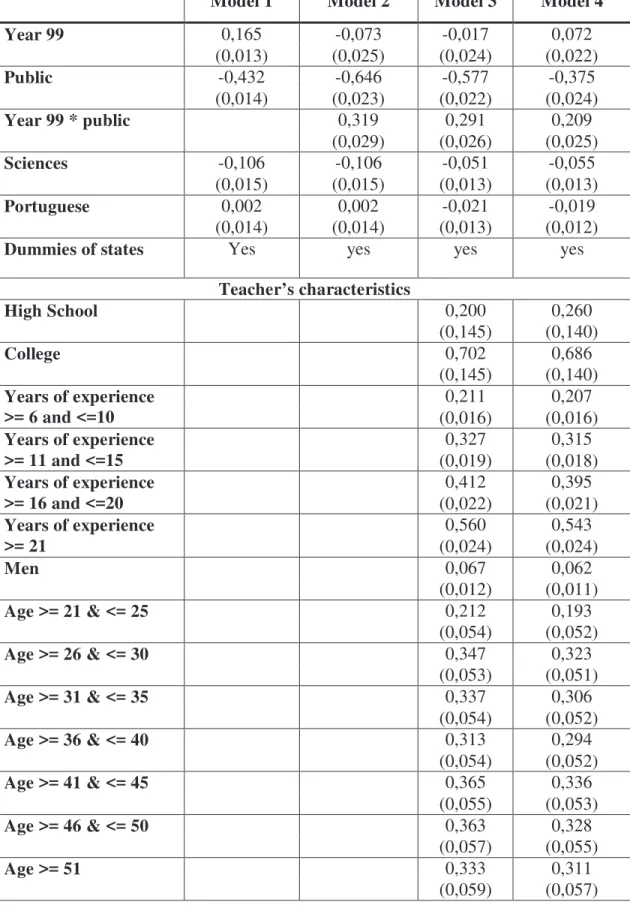
Table 5 below presents the results of regression that looks at the determinants of
teachers’ wages for the pooled 1997 and 1999 sample. The first column shows that real
wages increased in 1999, that was in public schools are lower on average then in the private
ones and that wages in science teachers are lower than those of the Mathematics teachers.
The second column however shows that there was an increase of about 32% in the average
wages of public school teachers in 1999, as compared to their private schools counterparts.
Column 3 then includes the teachers’ characteristics and we can see that FUNDEF
coefficient declines a little, but remains statistically significant. In column (4) we control
for the school characteristics, including the director’s wage and the coefficient remains
statistically significant, meaning that Fundef raised the public school teachers’ wages by
about 20%. Interestingly enough there is a positive correlation between the director’s and
the teachers’ wages, which may reflect ‘matching’ or school unobserved characteristics.
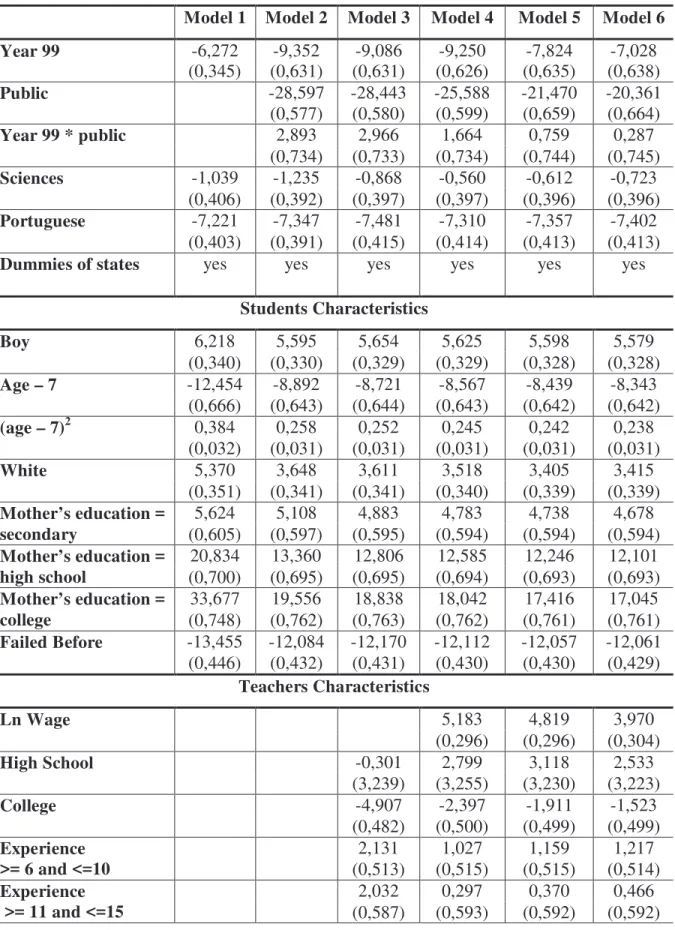
In Table 6 we present the results of the second–state regression, about the
determinants of the students’ performance in test scores. In the first column, one can note
that there was a decline in students’ proficiency in 1999 and that students fare worse in
Portuguese and Sciences than in Mathematics (the omitted category). Moreover, boys tend
to perform better than girls, young pupils than older one, and white then non-whites.
Family background, as measured by mother’s schooling does has a strong impact on test
scores. Moreover, pupils that failed in the past (a measure of unobserved ability) tend to do
worse. The results as a whole are in line with other studies in the school proficiency
literature.
In column (2) we include the public school indicator and the FUNDEF dummy, that
to do worse than private school ones, but that this difference has declined between 1997
and 1999, after the introduction of FUNDEF. Column (3) includes the teachers’
characteristics (other than their wages) and there is hardly any change in the FUNDEF
dummy, implying that the change in teacher characteristics is not responsible for the
improvement in public school students’ test scores. In column (4) we include the teachers’
wages as an additional regressor. It attracts a positive and statistically significant coefficient
and it reduces the FUNDEF dummy by almost a half. This in indirect evidence that the
improvements in the performance of the public school pupils may be partly explained by
the higher wages of the public school teachers. Column (5) then includes the school
characteristics and the magnitude of the FUDNEF coefficient declines further. Finally,
column (6) includes the director’s wages and this leads to a further decline in the FUNDEF
coefficient, which is now not statistically different from zero. This evidence suggests that
the improvements in the public school performance may be explained by the improvements
in teachers’ and directors’ wages and other school characteristics.
Given the changes in the process of funding education introduced by FUNDEF,
whereby most of the municipalities were net beneficiaries, with the exception of the
southeast, we expect the effects of FUNDEF to differ substantially between states and
municipalities and across different regions. We therefore repeated the exercises above
separately for the state and municipal systems in two regions, Southeast and Northeast. The
results are presented in tables 7 to 14
In terms of teachers’ wages, tables 7 to 10 show that they increased for public
school teachers in both the state and municipal system, in the Northeast as well as in the
Southeast, as indicated by column (2) in each table. It is interesting to note however, that
differences in wages between the public and private schools were higher to start with.
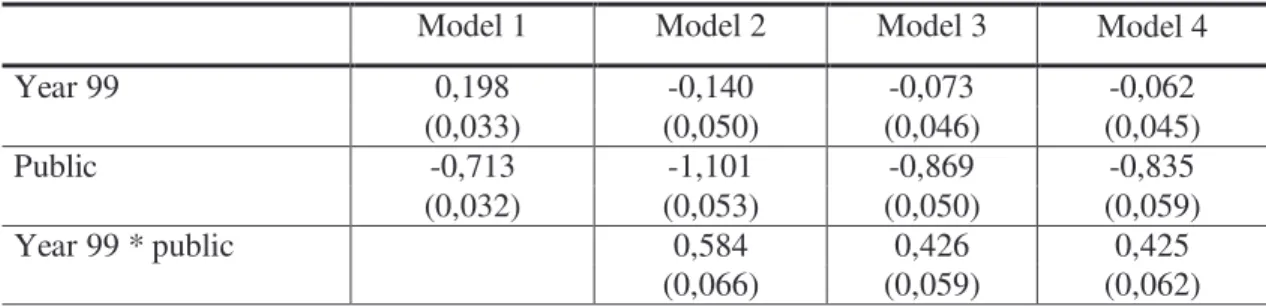
Moreover, it seems that the increases in the southeast are robust to the inclusion of other
teacher and school characteristics, as shown by columns (3) and (4), while in the state
system in the Northeast, the inclusion of school characteristics and directors’ wages wipes
out the FUNDEF effect. In the municipal level however, the FUNDEF effect is robust to
the inclusion on other characteristics.
Tables 11 to 14 repeat the exercises of table 6 for both systems in the Northeast and
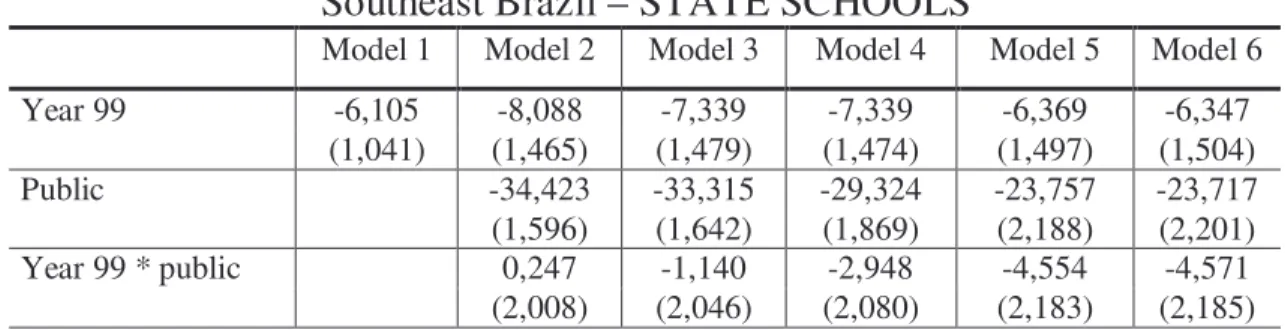
Southeast regions and the results look quite interesting. While the differences between the
private and public schools in terms of proficiency were broadly similar in all systems and
regions (about 30 points), one can only observe a rise in the proficiency of public schools in
the municipal system in the Northeast. In the other system/regions, the FUNDEF dummy
attracted a coefficient that is not significantly different from zero. Moreover, in the
Northeast municipal level, the magnitude of the coefficient also declines when other
possible FUNDEF outcomes are included in the regression, like teachers’ wages (column
5), and the directors’ wage and other school characteristics (column 6).
5) Conclusions
In this paper we investigate the effects of a 1998 reform in the funding scheme of
fundamental education in Brazil (FUNDEF) on the public teachers’ wages and on the
proficiency of public school pupils. The evidence suggests that, on average, FUNDEF
raised the teachers’ relative wages and improved the relative proficiency of the public
school students. Some indirect evidence was presented that showed that the effect of
characteristics. The effect on proficiency however, seems to be concentrated in the
municipal schools in the Northeast of the country.
Tabela 1: FUNDEF Financial Impact by Brazilian Regions-(1998)
State Government Municipal Government
Revenues from FUNDEF Revenues from FUNDEF
Region
Contribution to FUNDEF
(A)
Principal Federal Compl.
Total (B)
B – A
Contribution to FUNDEF
(A)
Principal Federal Compl.
Total
(B) B - A
N 731,7 655,6 66 721,6 (10) 262,5 338,5 46,6 385,1 122,6
NE 1810,6 1203,2 157,9 1361,3 (449,5) 966,1 1573,8 216,1 1789,9 823,8
SE 4327,7 4500,2 - 4500,2 173,2 1973,3 1799,9 - 1799,9 (173,4)
S 1283,4 1152,5 - 1152,5 (130,9) 717,2 848,1 848,1 130,9
CO 452,0 446,3 - 446,3 (5,7) 247,0 252,5 - 252,5 5,5
Brazil 8604,7 7957,8 223,9 8181,7 (423,0) 4166,1 4818,8 262,7 5075,5 909,4
Table 2: Descriptive Analyze - Student's Characteristics
1997 1999
Private Public Private Public
Boy 4.613 46,0% 10.921 42,3% 5.018 48,7% 8.882 44,8%
White 6.790 67,8% 13.187 51,0% 6.879 66,8% 9.933 50,1%
7,4 9,0 7,3 8,6
(Age – 7)
(1,2) (2,2) (1,1) (1,8)
Mother’s education = Secondary
2.076 20,7% 16.470 63,7% 1.988 19,3% 12.954 65,3%
Mother’s education = high school
2.972 29,7% 4.831 18,7% 3.518 34,2% 3.201 16,1%
Mother’s education = college
4.831 48,2% 2.330 9,0% 4.581 44,5% 1.192 6,0%
Failed Before 2742 27,4% 15083 58,4% 2446 23,8% 10581 53,4%
Sciences 3304 33,0% 8.484 32,8% 3.394 33,0% 6.386 32,2%
Score 285 239 282 238
50 43 48 43
Portuguese 3.447 34,4% 8.785 34,0% 3426 33,3% 6740 34,0%
Score 281 240 267 227
47 45 46 41
Mathematics 3.267 32,6% 8.573 33,2% 3.475 33,8% 6706 33,8%
Score 292 237 288 239
50 42 50 42
Number of
Table 3: Descriptive Analyze - Teacher's Characteristics
1997 1999
Teacher's
Characteristics Private Public Private Public
High School 68 6,8% 662 19,0% 285 12,2% 1074 22,4%
College 926 93,2% 2811 80,5% 2052 87,7% 3720 77,4%
Experience
>= 6 and <=10 256 25,8% 736 21,1% 661 28,3% 1095 22,8%
Experience
>= 11 and <=15 218 21,9% 754 21,6% 509 21,8% 968 20,1%
Experience
>= 16 and <=20 143 14,4% 519 14,9% 251 10,7% 719 15,0%
Experience
>= 21 169 17,0% 540 15,5% 356 15,2% 766 15,9%
Age >= 21 & <=25 110 11,1% 357 10,2% 266 11,4% 503 10,5%
Age >= 26 & <=30 159 16,0% 593 17,0% 527 22,5% 867 18,0%
Age >= 31 & <=35 236 23,7% 682 19,5% 544 23,3% 1.002 20,9%
Age >= 36 & <=40 167 16,8% 638 18,3% 384 16,4% 851 17,7%
Age >=41 & <= 45 150 15,1% 611 17,5% 291 12,4% 766 15,9%
Age >= 46 & <=50 112 11,3% 354 10,1% 190 8,1% 483 10,1%
Age >= 51 41 4,1% 200 5,7% 113 4,8% 270 5,6%
Men 400 40,2% 1.251 35,8% 982 42,0% 1.699 35,4%
1.104,08 592,00 1.001,21 711,16
Wage
(625,28) (396,28) (629,46) (456,48)
Number of
Table 4: Descriptive Analyze - School's Characteristics
1997 1999
School's
Characteristics Private Public Private Public
Computer 107 92,2% 176 37,5% 488 65,9% 226 17,0%
Clean classroom 97 83,6% 217 46,3% 509 68,7% 631 47,5%
Clean bathroom 93 80,2% 105 22,4% 602 81,2% 701 52,8%
1.981,01 1.070,03 1.497,31 1.009,64
Director’s Wage
(845,29) (644,92) (872,47) (553,26)
Number of Observation
Table 5: First Stage – Dependent variable Ln Wage
Model 1 Model 2 Model 3 Model 4
0,165 -0,073 -0,017 0,072
Year 99
(0,013) (0,025) (0,024) (0,022)
-0,432 -0,646 -0,577 -0,375
Public
(0,014) (0,023) (0,022) (0,024)
0,319 0,291 0,209
Year 99 * public
(0,029) (0,026) (0,025)
-0,106 -0,106 -0,051 -0,055
Sciences
(0,015) (0,015) (0,013) (0,013)
0,002 0,002 -0,021 -0,019
Portuguese
(0,014) (0,014) (0,013) (0,012)
Dummies of states Yes yes yes yes
Teacher’s characteristics
0,200 0,260
High School
(0,145) (0,140)
0,702 0,686
College
(0,145) (0,140)
0,211 0,207
Years of experience
>= 6 and <=10 (0,016) (0,016)
0,327 0,315
Years of experience
>= 11 and <=15 (0,019) (0,018)
0,412 0,395
Years of experience
>= 16 and <=20 (0,022) (0,021)
0,560 0,543
Years of experience
>= 21 (0,024) (0,024)
0,067 0,062
Men
(0,012) (0,011)
0,212 0,193
Age >= 21 & <= 25
(0,054) (0,052)
0,347 0,323
Age >= 26 & <= 30
(0,053) (0,051)
0,337 0,306
Age >= 31 & <= 35
(0,054) (0,052)
0,313 0,294
Age >= 36 & <= 40
(0,054) (0,052)
0,365 0,336
Age >= 41 & <= 45
(0,055) (0,053)
0,363 0,328
Age >= 46 & <= 50
(0,057) (0,055)
0,333 0,311
Age >= 51
(School’s characteristics)
0,061 Clean classroom
(0,013) -0,017 Clea bathroom
(0,011) 0,060 Computer
(0,012) 0,229 Director’s Ln wage
(0,010)
6,886 7,044 5,753 4,047
Constant
(0,037) (0,041) (0,157) (0,169)
Nº of Observation 11.629 11.629 11.629 11.629
F(k, n-k ) 139,88 142,13 210,34 214,60
Prob > F 0,000 0,000 0,000 0,000
R-squared 0,245 0,254 0,436 0,477
Table 6: Second Stage – Dependent Variable – Student’s proficiency
Model 1 Model 2 Model 3 Model 4 Model 5 Model 6
Year 99 -6,272
(0,345) -9,352 (0,631) -9,086 (0,631) -9,250 (0,626) -7,824 (0,635) -7,028 (0,638)
Public -28,597
(0,577) -28,443 (0,580) -25,588 (0,599) -21,470 (0,659) -20,361 (0,664)
2,893 2,966 1,664 0,759 0,287
Year 99 * public
(0,734) (0,733) (0,734) (0,744) (0,745)
-1,039 -1,235 -0,868 -0,560 -0,612 -0,723
Sciences
(0,406) (0,392) (0,397) (0,397) (0,396) (0,396)
-7,221 -7,347 -7,481 -7,310 -7,357 -7,402
Portuguese
(0,403) (0,391) (0,415) (0,414) (0,413) (0,413)
yes yes yes yes yes yes
Dummies of states
Students Characteristics
6,218 5,595 5,654 5,625 5,598 5,579
Boy
(0,340) (0,330) (0,329) (0,329) (0,328) (0,328)
-12,454 -8,892 -8,721 -8,567 -8,439 -8,343
Age – 7
(0,666) (0,643) (0,644) (0,643) (0,642) (0,642)
0,384 0,258 0,252 0,245 0,242 0,238
(age – 7)2
(0,032) (0,031) (0,031) (0,031) (0,031) (0,031)
5,370 3,648 3,611 3,518 3,405 3,415
White
(0,351) (0,341) (0,341) (0,340) (0,339) (0,339)
5,624 5,108 4,883 4,783 4,738 4,678
Mother’s education =
secondary (0,605) (0,597) (0,595) (0,594) (0,594) (0,594)
20,834 13,360 12,806 12,585 12,246 12,101
Mother’s education =
high school (0,700) (0,695) (0,695) (0,694) (0,693) (0,693)
33,677 19,556 18,838 18,042 17,416 17,045
Mother’s education =
college (0,748) (0,762) (0,763) (0,762) (0,761) (0,761)
-13,455 -12,084 -12,170 -12,112 -12,057 -12,061 Failed Before
(0,446) (0,432) (0,431) (0,430) (0,430) (0,429) Teachers Characteristics
5,183 4,819 3,970
Ln Wage
(0,296) (0,296) (0,304)
-0,301 2,799 3,118 2,533
High School
(3,239) (3,255) (3,230) (3,223)
-4,907 -2,397 -1,911 -1,523
College
(0,482) (0,500) (0,499) (0,499)
2,131 1,027 1,159 1,217
Experience
>= 6 and <=10 (0,513) (0,515) (0,515) (0,514)
2,032 0,297 0,370 0,466
Experience
2,914 0,951 0,960 1,120 Experience
>= 16 and <=20 (0,697) (0,705) (0,704) (0,704)
3,876 1,280 1,486 1,807
Experience >= 21
(0,774) (0,787) (0,786) (0,785)
0,374 0,105 -0,032 -0,109
Men
(0,365) (0,364) (0,364) (0,363)
3,714 2,796 2,042 2,035
Age >= 21 & <= 25
(1,450) (1,462) (1,457) (1,454)
2,941 1,474 0,945 1,025
Age >= 26 & <= 30
(1,431) (1,444) (1,439) (1,437)
1,470 -0,008 -0,561 -0,688
Age >= 31 & <= 35
(1,452) (1,465) (1,460) (1,457)
3,005 1,682 1,257 1,322
Age >= 36 & <= 40
(1,483) (1,496) (1,490) (1,488)
4,890 3,149 2,651 2,611
Age >= 41 & <= 45
(1,509) (1,522) (1,517) (1,514)
2,786 1,121 0,625 0,463
Age >= 46 & <= 50
(1,569) (1,581) (1,576) (1,574)
1,304 -0,308 -0,984 -0,867
Age >= 51
(1,662) (1,674) (1,669) (1,667) School Characteristics
3,202 Director’s Ln wage
(0,278)
1,098 1,139
Clean classroom
(0,361) (0,360)
2,990 2,858
Clean bathroom
(0,396) (0,396)
5,110 4,638
Computer
(0,404) (0,405) 314,221 320,796 315,765 281,400 276,117 259,038 Constant
(3,424) (3,297) (3,572) (4,075) (4,081) (4,334)
Nº of Observation 65.987 65.987 65.987 65.987 65.987 65.987
F(k, n-k ) 655,63 758,33 566,380 564,510 539,530 532,78
Prob > F 0,000 0,000 0,000 0,000 0,000 0,000
R-squared 0,267 0,308 0,311 0,315 0,317 0,318
Table 7: First Stage – Dependent variable Ln Wage – Northeast Brazil –
STATE SCHOOLS
Model 1 Model 2 Model 3 Model 4
0,064 -0,095 -0,031 0,215
Year 99
(0,031) (0,052) (0,049) (0,042)
-0,343 -0,532 -0,511 -0,032
Public
(0,030) (0,053) (0,050) (0,053)
0,282 0,228 -0,001
Year 99 * public
(0,063) (0,058) (0,052)
*Robust standard-error between parentheses.
Table 8: First Stage – Dependent variable Ln Wage – Northeast Brazil –
MUNICIPAL SCHOOLS
Model 1 Model 2 Model 3 Model 4
0,065 -0,112 -0,037 0,197
Year 99
(0,034) (0,051) (0,049) (0,042)
-0,413 -0,636 -0,593 -0,092
Public
(0,030) (0,057) (0,052) (0,053)
0,317 0,365 0,131
Year 99 * public
(0,068) (0,060) (0,053)
*Robust standard-error between parentheses.
Table 9: First Stage – Dependent variable Ln Wage – Southeast Brazil –
STATE SCHOOLS
Model 1 Model 2 Model 3 Model 4
0,198 -0,140 -0,073 -0,062
Year 99
(0,033) (0,050) (0,046) (0,045)
-0,713 -1,101 -0,869 -0,835
Public
(0,032) (0,053) (0,050) (0,059)
0,584 0,426 0,425
Year 99 * public
(0,066) (0,059) (0,062)
*Robust standard-error between parentheses.
Table 10: First Stage – Dependent variable Ln Wage – Southeast Brazil –
MUNICIPAL SCHOOLS
Model 1 Model 2 Model 3 Model 4
0,175 -0,116 -0,062 -0,017
Year 99
(0,036) (0,049) (0,045) (0,043)
-0,391 -0,737 -0,623 -0,575
Public
(0,033) (0,055) (0,052) (0,061)
0,512 0,419 0,392
Year 99 * public
(0,068) (0,063) (0,064)
Table 11: Second Stage – Dependent Variable – Student’s proficiency -
Northeast Brazil – STATE SCHOOLS
Model 1 Model 2 Model 3 Model 4 Model 5 Model 6
-7,017 -9,260 -9,038 -9,628 -6,487 -4,163
Year 99
(0,749) (1,070) (1,080) (1,059) (1,087) (1,110)
-26,202 -25,826 -22,119 -13,813 -11,695
Public
(1,154) (1,179) (1,189) (1,320) (1,329)
1,624 1,729 0,312 -2,252 -3,856
Year 99 * public
(1,450) (1,458) (1,446) (1,457) (1,467)
*Robust standard-error between parentheses.
Table 12: Second Stage – Dependent Variable – Student’s proficiency -
Northeast Brazil – MUNICIPAL SCHOOLS
Model 1 Model 2 Model 3 Model 4 Model 5 Model 6
-7,014 -9,470 -9,261 -9,751 -6,669 -4,718
Year 99
(0,762) (1,070) (1,079) (1,059) (1,086) (1,109)
-30,118 -30,118 -25,710 -18,767 -16,466
Public
(1,245) (1,258) (1,267) (1,377) (1,400)
6,040 7,081 4,436 1,703 0,811
Year 99 * public
(1,459) (1,467) (1,463) (1,475) (1,478)
*Robust standard-error between parentheses.
Table 13: Second Stage – Dependent Variable – Student’s proficiency -
Southeast Brazil – STATE SCHOOLS
Model 1 Model 2 Model 3 Model 4 Model 5 Model 6
-6,105 -8,088 -7,339 -7,339 -6,369 -6,347
Year 99
(1,041) (1,465) (1,479) (1,474) (1,497) (1,504)
-34,423 -33,315 -29,324 -23,757 -23,717
Public
(1,596) (1,642) (1,869) (2,188) (2,201)
0,247 -1,140 -2,948 -4,554 -4,571
Year 99 * public
(2,008) (2,046) (2,080) (2,183) (2,185)
*Robust standard-error between parentheses.
Table 14: Second Stage – Dependent Variable – Student’s proficiency -
Southeast Brazil – MUNICIPAL SCHOOLS
Model 1 Model 2 Model 3 Model 4 Model 5 Model 6
-7,131 -8,175 -7,484 -7,447 -5,760 -5,678
Year 99
(1,045) (1,467) (1,476) (1,471) (1,510) (1,515)
-27,484 -26,625 -23,736 -16,953 -16,926
Public
(1,628) (1,641) (1,720) (2,052) (2,052)
0,797 -0,342 -2,526 -6,632 -6,659
Year 99 * public
(2,005) (2,029) (2,063) (2,179) (2,179)
Figure 1 - Share of Private Schools - 2002
0 10 20 30 40 50 60 70 80
1st grade 4th grade 8th grade 11th grade college
%
students schools
Figure 2 - Expenditures on Education per GDP by Region
0,00 1,00 2,00 3,00 4,00 5,00 6,00 7,00 8,00
1994 1995 1996 1997 1998 1999
%
Figure 3 - Expenditure Share in Each Cycle - State System
0% 10% 20% 30% 40% 50% 60% 70%
97 98 99
Figure 4- Expenditure Share in Each Cycle - Municipal System
0% 10% 20% 30% 40% 50% 60% 70% 80%
97 98 99
Figure 5- Number of Students in Fundamental Education - Brasil
0 5000000 10000000 15000000 20000000 25000000 30000000 35000000 40000000
97 98 99
total state municipio private
Figure 6- Real Expenditures per Pupil - Fundamental Education - BRAZIL
400 500 600 700 800 900
97 98 99
Figure 7- Real Expenditures per Pupil in Fundamental Education - NE
200 300 400 500 600 700
97 98 99
total state municipio
Figure 8 - Real Expenditures per Pupil - Fundamental Education -SE
400 500 600 700 800 900 1000 1100 1200 1300
97 98 99
Figure 9 - Number of Schools - BR
0 50000 100000 150000 200000 250000
97 98 99
Total State Municipio Private
Figure 10 - Number of Teachers - BR
0 200000 400000 600000 800000 1000000 1200000 1400000 1600000
97 98 99
Figure 10 - Class Sizes - BR
10 12 14 16 18 20 22 24 26 28 30
97 98 99
Total State Municipio Private
7 -References
Anuatti Neto, F., Fernandes, R. and Pazello, E. (2003) “Avaliação dos Salários dos
Professores da Rede Pública de Ensino Fundamental em Tempos de FUNDEF”,
Universidade de São Paulo- mimeo.
Barros, R., Mendonça, R. and Blanco, F. (2001). “ O Mercado de Trabalho para
Professores no Brasil”, Anais do XXIX Encontro Nacional de Economia – ANPEC,
Salvador-BA.
Hanushek, E.(2003) “The Failure of Input-Based Schooling Policies”, The Economic
Menezes-Filho, N., Fernandes, R. and Picchetti, P (2002). “Rising Human Capital but
Constant Inequality: The Education Composition Effect in Brazil”, University of Sao