© School of Engineering, Taylor’s University
EMBEDDED CAPACITOR SENSOR FOR MONITORING
CORROSION OF REINFORCEMENT IN CONCRETE
SITI FATIMAH ABDUL RAHMAN1,MOHAMMAD ISMAIL1, NORHAZILAN MD. NOOR*,1,HAZRI BAKHTIAR2
1
Faculty of Civil Engineering, Universiti Teknologi Malaysia, 81310 UTM Johor Bahru, Johor, Malaysia
2
Faculty of Science, Universiti Teknologi Malaysia, 81310 UTM Johor Bahru, Johor, Malaysia *Corresponding Author: norhazilan@utm.my
Abstract
Corrosion of reinforcement can affect durability and integrity of reinforced concrete structures. Repair cost for a badly corroded structure can be very costly and time consuming. In this paper, several capacitor sensors were developed to monitor corrosion potential of reinforcement in concrete. The impedance capacitive of sensors was tested in various acid and alkali solutions using Agilent 4284A Precision LCR meter. The other sensors were tied to reinforcements and embedded in concrete specimen contaminated with 5% chloride to measure corrosion potential. The specimens were exposed to the corrosion chamber and indoor environments. From the research, it was found that the sensor can measure the impedance capacitive at different frequencies in the aggressive solutions. Besides, it was observed that the patterns of corrosion potential shown by the embedded sensors were similar to the SRI sensor. The output values from embedded sensor are in a range of recommendation by the ASTM-C876. Eventually, the bars were found corroded from the broken specimens that confirmed the detection of corrosion activities as recorded by the sensors.
Keywords: Corrosion of reinforcement, Corrosion testing, Embedded sensor, Chloride.
1. Introduction
Nomenclatures
C Capacitance, F
Ecorr Corrosion potential f Frequency, Hz
Xc Impedance capacitive, ohm
Nevertheless, the steel can corrode overtime and corrosion of reinforcement is a major problem to the construction industry worldwide. Initially, embedded steel bar in concrete develops a passive iron oxide film that makes it highly resistant to corrosion. However, the aggressiveness of an environment tends to corrode the steel either due to carbonation or chloride attack. Carbonation is a process of reaction between carbon dioxide (in environment) and calcium hydroxide (in concrete) to forms calcium carbonate that reduces concrete pH and weakens the passive layer of rebars. Meanwhile, with sufficient high concentration of chloride attacks and destroys the passive layer of rebars [1-5]. Due to these problems, it is necessary to conduct a study on the corrosion of reinforcement in order to maintain the durability and reliability of reinforced concrete structures.
There are a few options has been tried to address corrosion problems. Corrosion can be delayed by using new material which is designed to resist corrosion. Ismail et al. [6] used dual-phase steel as rebar to replace ordinary mild steel. Dual-phase steel has high corrosion resistance compared to conventional steel bar due to the low measurement of corrosion rate in ordinary and aggressive environment. Hossain et al. [7] replace cement with volcanic ash as a corrosion resistance in mortars. Volcanic ash reduces the quantity of calcium hydroxide hence delaying the onset of reinforcement corrosion. Nevertheless, it also important to study the assessment method in testing and monitoring corrosion processes in concrete. Thus, corrosion monitoring is the best way to provide quantitative assessment of corrosion. Song et al. [8] and Bjegovic et al. [9] gave an overview of the existing sensor technology and its efficiency.
2. Embedded Capacitor Sensor (ECS)
2.1. Capacitor sensor design
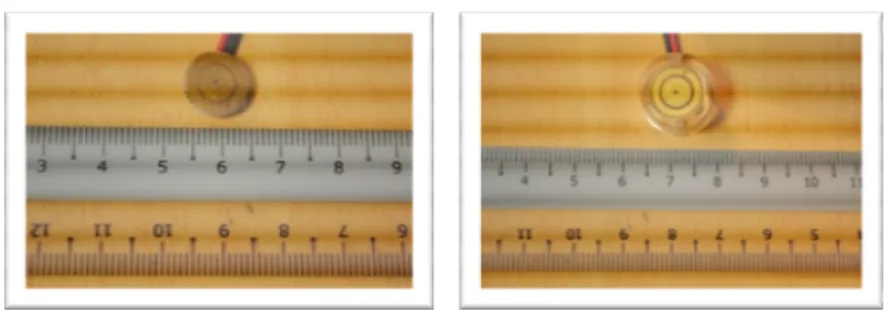
ECS is an electrical capacitor sensor. It was developed using existing Printed Circuit Board (PCB) fabrication technology and was platted using Electroless Nickel/Immersion Gold (ENIG) process. ECS was designed with a circular shape with the dimension of 11mm in diameter and 1.6 mm in height. ECS is placed at a depth of 1 mm inside an acrylic casing as presented in Fig. 1(a). This is to prevent sensor surface from scratch. ECS has two plates which are separated by a medium known as the FR-4 as shown in Fig. 1(b). The back surface of ECS connected to the front by the through-holes. To connect the ECS to corrosion meter, the wires were soldered at the back of the surface. Figure 2(a) and (b) shows the photos of ECS.
Fig. 1. (a) Side View of ECS. (b) Plan View of ECS.
Fig. 2. Photos of the ECS. (a) Front View of the ECS, (b) Front View of the Soldered ECS with Casing.
2.2. Working principle of ECS in reinforced concrete
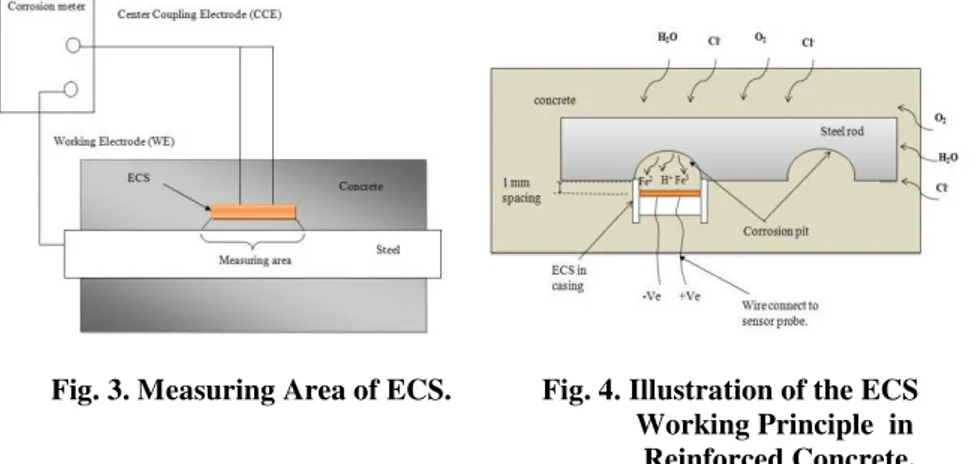
charge to counterbalance the circuit. As a result, the resistances between the plates will increases. The increase in resistance denotes the commencing of the corrosion activity. Thus, by monitoring the voltage and current values from the systems, corrosion activity can be predicted with constant condition of voltages and frequencies applied.
Fig. 3. Measuring Area of ECS. Fig. 4. Illustration of the ECS Working Principle in Reinforced Concrete.
3. Methods
3.1. Impedance capacitive testing
To test the feasibility and stability of ECS, the sensors were immersed in corrosive solutions. The sensor’s impedance capacitive was measured from 20 Hz to 1 kHz in parallel mode using Agilent 4284A Precision LCR meter at 10 mV DC volt. The impedance capacitive testing of ECS used was of bare sensors (without mortar on surface) and sensors with 1mm layer mortar-filled. The impedance capacitive test begins with a bare sensor immersed in a test tube containing solutions. Five tests were carried out using different chemicals; each contained 10 ml and 1 M of sulfuric acid (H2SO4), acetic acid (CH3COOH), sodium hydroxide (NaOH), ferric chloride (FeCl3) and sodium chloride (NaCl). The tests then were repeated using sensors with mortar-filled. Figure 5 shows the experimental set up of the impedance capacitive test. Impedance capacitive in relationship with frequencies and capacitance is given by the Eq. (1), whereXcis
impedance capacitive,fis frequency andCis capacitance [14]
fC Xc
π 2
1
= (1)
3.2. Impedance capacitive testing
To test the effectiveness of ECS in signalling corrosion, ECS was attached to the rebars embedded in the concrete as shown in Fig. 6. Ordinary Portland Cement (OPC) was used in this work in compliance with BS 12: 1989 [15]. Concrete prism sizes (250×200×100) mm were cast with an embedded steel bar size 12 mm in diameters and 150mm of exposure length. The concrete prisms were designed with 20 Mpa strengths (at 28 days) using the aggregate size of 10 mm. The steel rods were cleaned using sand paper (800 grades) and coated by epoxy except for the portion of measurement area to avoid the corrosion at air-concrete interface. To accelerate the corrosion activity of the reinforcement in the concrete, 5% of NaCl by weight of cement was diluted in water and mixed with the concrete.
Figure 7 shows the physical condition in corrosion chamber and indoor environments. The relative humidity (RH) in corrosion chamber was 95% RH with temperature 35±2 C while the indoor was 50% RH with 25±2 C. The specimens were exposed to both conditions for 98 days. Ecorr were measured in
the wetting phases every two weeks after being exposed to the cycles of wetting and drying in indoor environment and in corrosion chamber environment. The hypothesis for this observation is; the specimen exposed to the corrosion chamber shall give higherEcorrbecause in the chamber, the humidity and temperature level
are higher. Moreover, the specimens were sprayed with salt water according to ASTM B117 AS1580 [16] simulating aggressive corrosion environment. In this test, the results of ECS were compared to SRI sensor.
Fig. 6. Concrete Prism with ECS Attachments.
4. Results and Discussion
4.1. Impedance capacitive test in solutions
Figures 8 and 9 exhibit the impedance capacitive measurements of a bare and a mortar-filled sensor respectively immersed in chemical solutions. The presence of mortar as a resistance to the sensor indicates higher impedance capacitive value compared to the sensor without mortar. These chemical solutions are electrolytes and contain free ions. Acids were chosen to simulate an acidic environment which reduces cement alkalinity. In addition, sodium hydroxide simulates an alkaline environment to prevent rebar from corroding. Ferric chloride and sodium chloride were selected since it contains chloride ions contributing to steel bar corrosion [17]. From the figures it was explicitly found that the impedance capacitive in different medium (acids, alkaline and neutral) decreases steadily and almost close to zero towards higher frequency. Therefore, it can be concluded that the ECS is principally working and coherent with the theory, refer to Eq. (1), when tested in different solutions.
Fig. 8. The Impedance Capacitive of a Bare Sensor Immersed in Different Solutions.
4.2. Corrosion potential (
E
corr) of reinforcement
Figures 10 and 11 graphically explain the time-related changes in the potential reading of ECS and SRI sensor within 98 days. It is obvious that theEcorrpatterns
for both types of sensors are similar. The measurement recorded by SRI sensor yields are at a much lower value of -500mV to -550 mV for the whole test duration. Ecorr measured by ECS which ranging from -300mV to -200mV for
indoor environment and -400mV to -200mV for corrosion chamber environment. ECS reading indicates high corrosion level while SRI sensors yield a more extreme result with severe corrosion level according to Table 1 [18]. Silver/Silver Chloride reference electrode was used in the SRI sensor.
Table 1. Interpretation of Potential Measurements according to the ASTM C876 [18].
Silver/Silver Chloride (mV) Corrosion condition
> -106 Low (10% risk of corrosion) -106 to -256 Medium
< -256 High (90% risk of corrosion) < -406 Severe corrosion
However, the main purpose of this test is to find out whether or not the potential measurement of ECS is in the acceptable range. According to Broomfield [5], the corrosion potential gives negative reading because in half-cell system, the positive terminal is connected to the steel and the negative terminal is connected to the hall-cell sensor. A very negative potential can be measured with half-cell. However, the very negative potential reading can be found in saturated conditions with little oxygen. Thus it is supposed that there is no corrosion without any supply of oxygen. Therefore, in regards to the findings, the measurement of ECS is satisfactory since the measurement by ECS did not give a positive reading (half-cell terminal connection) and also did not measure a very negative reading. Perhaps the accuracy of ECS is greater and more sensitive than SRI because of its closer distant to the reinforcement.
Fig. 10.EcorrPattern between ECS to SRI Sensors
Fig. 11.EcorrPattern between ECS to SRI Sensor
for the Specimen in Ordinary Environment.
Corrosion chamber provides the corrosive environment to accelerate the corrosion process compared to indoor environment. The aggressive conditions are due to the higher relative humidity as well as the temperature. This finding is compatible to the predicted hypothesis, whereby the specimen has a higher risk of corrosion level tested in aggressive condition compare to indoor condition. Eventually, the bars were found corroded from the broken specimens to confirm the detection of corrosion activities as recorded by the sensors as shown in Fig. 12. Balafas et al. [19] reported that at high temperature, ions become mobile and salts become soluble due to the lack of water content in the environment. Thus mechanism of corrosion keeps on going because the ions are mobile to complete the oxidation and reduction process [5].
(a) (b)
Fig. 12. Visual Inspection of Corroded Rebar: (a) Specimen Exposed to Indoor Environment. (b) Specimen Exposed to Corrosion Chamber.
5. Conclusions
Some concluding observations from the investigation are given below.
• ECS can also provide a good and robust performance in measuring corrosion potential (Ecorr) of reinforced concrete structures. The measurement result was
confirmed by half-cell potential techniques comply with the ASTM C876 standard. • In corrosion chamber, corrosive environment is made up so that the specimen
here will corrode faster as compared to in a room condition. The evidence is exhibited by higher measurement of corrosion potential by ECS for specimen exposed inside corrosion chamber (corrode faster) as compared to specimen in indoor environment.
• ECS can be practically used to measure corrosion potential at a specific point only where the sensor is placed. Outlying zone may not be covered by the sensor, hence limiting the comprehensive assessment on the wider surface of reinforcement bar.
Acknowledgement
The authors gratefully acknowledged the supports for this research from MOSTI grant no 79152, Ministry of Science and Technology, Research Management Centre, Faculty of Civil Engineering and Universiti Teknologi Malaysia.
References
1. Page, C.L. (1975). Mechanism of corrosion protection in reinforced concrete marine structures.Nature, 258(5535), 514-515.
2. Andrade, C.; and Martinez, I. (2006). Corrosion rate monitoring of deteriorated and repaired structures through on-site linear polarization measurements using surface or embedded sensors. In the 2nd International RILEM Symposium on Advances in Concrete through Science and Engineering, Quebec City, Canada.
3. Ann, K.Y.; Ahn, J.H.; and Ryou, J.S. (2009). The importance of chloride content at the concrete surface in assessing the time to corrosion of steel in concrete structures.Construction and Building Materials, 23(1), 239-245. 4. Sohanghpurwala, A.A. (2006).NCHRP Report 558: Manual on service life of
corrosion-damaged reinforced concrete bridge superstructure elements.
National Cooperative Highway Research Program: Washington, D.C., USA, 13-15.
5. Broomfield, J.P. (1997). Corrosion of steel in concrete: Understanding, investigation and repair. E & FN Spon: London, UK.
6. Ismail, M.; Hamzah, E.; Guan, G.C.; and Rahman, I.A. (2010). Corrosion performance of dual-phase steel embedded in concrete.The Arabian journal for science and engineering, 35(2B), 81-90.
7. Hossain, K.M.A; and Lachemi, M. (2004). Corrosion resistance and chloride diffusivity of volcanic ash blended cement mortar. Cement and Concrete Research, 34(4), 695-702.
9. Bjegovic, D.; Meyer, J.J.; Mikulic, D.; and Sekulic, D. (2003). Corrosion measurement in concrete utilizing different sensor technologies. NACE International, Paper No. 03435.
10. Lee, H.S.; Shin, S.W.; Ahn, J.M.; Kim, Y.C.; and Kho, Y.T. (2003). Development of corrosion sensor for monitoring steel-corroding agents in reinforced concrete structures.Materials and Corrosion, 54(4), 229-234. 11. Leung, C.K.; Wan, K.T.; and Chen, L. (2008). A novel optical fiber sensor
for steel corrosion in concrete structures.Sensors, 8(3), 1960-1976.
12. Ismail, M.; Dina, E.; Rosly, A.; and Ikhsan, S. (2005). Observation of corrosion process of reinforcing steel. Jurnal Kejuru-teraan Awam, 17(1), 13-22.
13. Bartels, K.A., Kwun, H.; and Hanley J.J. (1996). Magnetostrictive sensors for the characterization of corrosion in rebar and prestressing strands. In SPIE Proceedings on non-destructive Evaluation of Bridges and Highways, 2946, 40-50.
14. Stanley W. (1973). Guide to electronic measurements and laboratory practice. Prentice-Hall, Englewood Cliffs, New Jersey.
15. British Standards Institute, 1996. BS 12: 1989, Specification for Portland cement. 16. ASTM B117 AS1580 (2007). Standard Salt Spray (Fog) Apparatus.
American Society for Testing and Materials.
17. Kyung, J.W.; Yokota, M.; Leelalerkiet, V.; and Ohtsu, M. (2004). Practical use of half-cell potential method for NDE of corrosion of reinforced concrete structure.Key Engineering Materials, 270/273, Part 2, 1638-1644.
18. ASTM C876 (1991). Standard test method for half-cell potential of reinforcing steel in concrete. American Society for Testing and Materials. 19. Balafas, I.; and Burgoyne, C.J. (2010). Environmental effects on cover