Drought Monitoring in Chaharmahl-Bakhtiyari Province in Iran
Hamid Mohammadi
1, Mojgan Abasi
2, Javad Bazrafshan
3 1Departamento de Florestas, Universidade de Shahrekord, Shahrekord, Irã.
2
Faculdade de Recursos Naturais, Universidade de Shahrekord, Shahrekord, Irã.
3
Faculdade de Agricultura, Universidade de Teerã, Teerã, Irã.
Received: September 7, 2016 – Accepted: May 12, 2017
Abstract
The monitoring of drought is the most important factor in water resources management. This study focuses on evaluation of the drought characteristics such as intensity, frequency and duration drought using Standardized Precipitation Index (SPI) in different time scales such as: SPI1, SPI3 months, during 1980-2012. The results show that selection of different time scales can be based on management goals and kind of drought. The results of the drought occurrence frequency showed that, with increase of length of time scales, drought duration will increase and maximum frequency was at the normal level and there is no particular procedure in different time scales. Furthermore, Drought patterns maps showed that the northern and central parts of study area had experienced these recent droughts more than other places, and these place have potential to destroy the lands. So, by identification of sensitivity regions can be take appropriate management to prevent damage resulting of drought.
Keywords:drought monitoring, different time scales, drought pattern, drought duration, Standardized Precipitation
Index (SPI).
Monitoramento da Seca na Província de Chaharmahl-Bakhtiyari no Irã
Resumo
O monitoramento da seca é o fator mais importante na gestão de recursos hídricos. Este estudo centra-se na avaliação das características da seca, como intensidade, frequência e duração da seca, utilizando o Índice Padronizado de Precipitação (SPI) em diferentes escalas de tempo, tais como: SPI1, SPI3 (mensal), durante 1980-2012. Os resultados mostram que a seleção de diferentes escalas de tempo pode ser baseada em gerenciamento de metas e tipos de seca. Os resultados com base na frequência de ocorrência de seca mostraram que, com o aumento do período de tempo analisado, aumentou a duração da seca e a frequência máxima além do nível normal e não há nenhum procedimento específico em diferentes escalas de tempo. Além disso, os mapas de padrões de seca mostraram que as partes do norte e central da área de estudo experimentaram secas recentes mais do que outras regiões, tento esses locais grande potencial para catástrofes resultantes da seca. Assim, através da identificação de regiões mais sensíveis a esta ação climática, pode-se definir uma gestão apropriada para evitar grandes danos.
Palavras-chave: monitoramento da seca, diferentes escalas de tempo, padrão de seca, duração da seca, Índice de
Precipitação Padronizado (SPI).
1. Introduction
Drought is a natural phenomenon which is caused to the lack of precipitation over a time period. Also, it affect both surface water and groundwater resources, so that, it lead to reduced water supply, declined water quality, crop failure and disturbed habitats (Riebsameet al., 1991).
Drought by itself is not a disaster. Whether it becomes a disaster depends on its impact on local people, economies and the environment (WMO, 2006).
Totally, Drought is defined as a temporary meteoro-logical event whereas the lack of precipitation over an extended period of time compared with some long term average condition. Considering, slowly development of Article
drought, the detection of drought is difficult in any single region.
In addition, regular drought monitoring system pro-vide early warning of drought’s onset, persistence, severity and spatial extent in establishing a national drought policy or strategy (Hayeset al., 2011). So, a number of indices
have been proposed for drought analysis (e.g. Palmer
Drought Severity Index, PDSI; Palmer, 1965), Standard-ized Precipitation Index (SPI; Mckeeet al., 1993),
Effec-tive Drought Index (EDI; Byun and Wilhite, 1999), Recon-naissance Drought Index (RDI; Tsakiriset al., 2007), the
China-Z index (CZI), is used by the National Metrological Center of China (Wuet al., 2001)
The SPI is obtained by transforming the cumulative probability of precipitation using the inverse of standard normal distribution (Hao and Aghakhochak, 2013) various indices have different operation in terms of drought onset, persistence and termination.
Totally, Drought can be classified into meteorologi-cal, agricultural and hydrological and socio-economical drought (Wilhite and Glantz, 1985). Meteorological drought when appears that deficit in precipitation be oc-curred, with keeping to drought deficit in soil moisture be occurred (agricultural drought). Mo (2011) mentioned that the onset of meteorological drought occurred earlier than agricultural drought. So, precipitation deficit is a suitable variable to detection the drought onset. Drought monitoring based on one single index to indicate the complexity of drought conditions and impact is one of the important limi-tations to drought monitoring (Wilhite, 2005). While, The SPI can be used to assign the intensity of drought or wet year phenomenon in any time scale for anywhere having rain gauging stations.
Many studies on different aspect of drought espe-cially drought monitoring were carried out in different parts of the world and Iran. Moridet al.(2006), comprised the
seven meteorological indices for drought monitoring in Iran, the results showed that The SPI and EDI were able to detect the onset of drought, so it was recommended for operational drought monitoring. Also, Jainet al. (2015),
evaluated the drought indices for appraisal of drought char-acteristic. Hao and Aghakochak (2013), studied a Nonpara-metric Multivariate Multi-Index Drought Monitoring Framework, namely, the multivariate standardized drought index (MSDI), for describing droughts based on the states of precipitation and soil moisture.
Iran, with an area of 164 milion hectares is located in arid and semi arid sphere in the world. In drought incident in 1999, Management and Planning Organization estimated the costs of such impacts to be ($1.25 Billion) of which more than 80 percent constituted damages of crop, ranges and livestock. According to the latest estimate, total dam-ages to national economy resulting from drought during 1998-2001 were over ($7.5 billion) (Garshasbi, 2016). So, attention to drought monitoring is importanat for risk man-agement.
This study focuses on drought monitoring by SPI1, API3, SPI6, SPI9, SPI12, SPI18, SPI24, and SPI48 months in the Chaharmahal-bakhtiyari province of Iran.
2. Data and Method
2.1. Study area
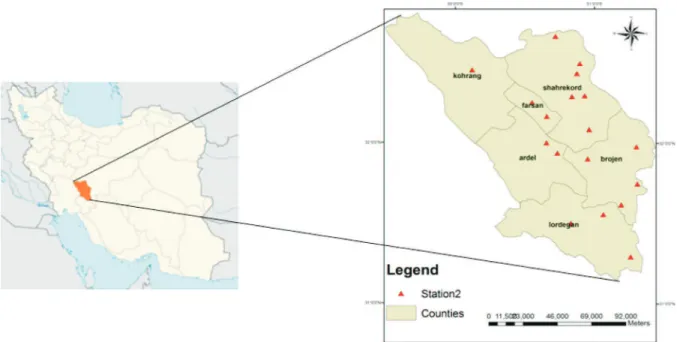
Chahrmahal-Bakhtiyri province is located in the southwest part of Iran, Fig. 1. The province has a total area of 16421 km2. Precipitation varied in different part of study
area, but mean annual precipitation is 560 mm (Fig. 2). The average elevation of the province is about 2066 m above mean sea level (msl).
In this paper, SPI indices in different scales were compared and evaluated using the average monthly and an-nual precipitation data of 15 stations. The record length is from 1980 to 2012. Missing data gaps were patched using regression equation by nearest suitable station data. The lo-cations of the selected stations and their detailed are shown in Fig. 1 and Table 1, respectively.
2.2. Standardized precipitation index
The SPI was calculated by McKeeet al. (1993), to
quantify the precipitation deficit for multiple time scales. The time scale of the SPI index is flexible, so that SPI can be computed with different time steps (1, 3, 6, 12, 24, 48 months). The SPI can be used for monitoring both dry and wet years. But, the data record length of precipitation should be set at least 30 years (Wuet al., 2001). Totally, the
objective choice on the best time step is depend on the kind of drought analysis. In this paper, the SPI over time periods of 1, 3, 6, 12, 18, 24 and 48 month time scales were applied the based on the long-term precipitation record for selected stations.
Short-term duration (1-month) might be important to meteorological drought, medium-term duration (3 month) is important to agricultural interests, while the long term
duration (6-12 month) covers water supply management in-terests. Table 2 shows the classes SPI index.
Figure 2- Mean of precipitation during 1980-2012.
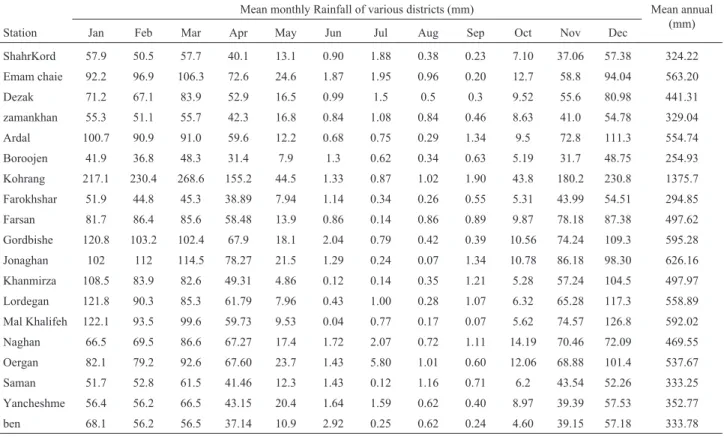
Table 1- Mean monthly, annual rainfall (mm) of stations in study area.
Mean monthly Rainfall of various districts (mm) Mean annual (mm)
Station Jan Feb Mar Apr May Jun Jul Aug Sep Oct Nov Dec
ShahrKord 57.9 50.5 57.7 40.1 13.1 0.90 1.88 0.38 0.23 7.10 37.06 57.38 324.22 Emam chaie 92.2 96.9 106.3 72.6 24.6 1.87 1.95 0.96 0.20 12.7 58.8 94.04 563.20
Dezak 71.2 67.1 83.9 52.9 16.5 0.99 1.5 0.5 0.3 9.52 55.6 80.98 441.31
When the SPI value is continuously negative and reaching a value of -1.0 or less, drought has occurred (McKeeet al., 1993; Paulo and Pereira, 2006). This index is
the transformation of the precipitation time series into a standardized normal distribution. It was calculated by McKeeet al.(1993), Wuet al.(2007). SPI index, as one of
the most important meteorological drought index, has been used in the world (Guttman, 1999; Pandey et al., 2008;
Roudier and Mahe, 2010; etc.). SPI is an index based on the probability of rainfall for various timescale. It can be evalu-ated the severity of drought, so that, time scales reflect the impact of the drought on the water resources availability (WMO, 2006).
3. Results and Discussion
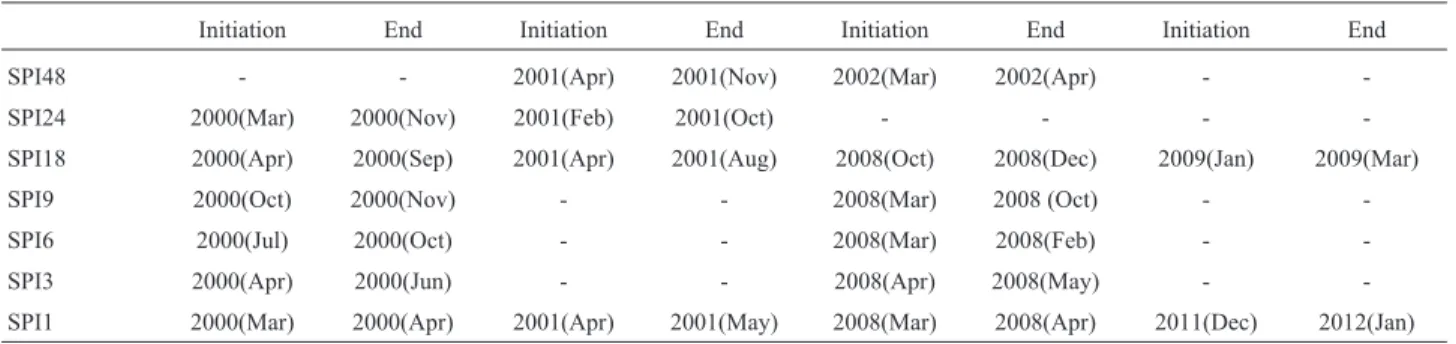
The initiation and end of drought in different time scales were compared for Shahrekord station in period 1980-2012 (Shown in Table 3). The results showed that, from The 2000 to 2012 extremely drought have recorded for SPI1, on April 2000 and 2001, March 2008 December 2011 and January 2012. Also, dry condition was re-corded on October, 2000 and March 2008 for six, nine month time scales. All time scales showed the onset of the drought during the same year, While the month of drought onset were different for various time scales, So that, SPI1 (Mar) indicated the onset of drought earlier than SPI3 (Apr), SPI6 (Jul) and SPI9 (Oct). It is worth mentioning that the SPI at one time scale reflects short-term precipitation patterns. While the SP18, SPI12,
SPI24 and SPI48 responds more slowly to changes in precipitation and gives longer duration of drought com-pared to SPI1, SPI3. So with consider to kind of drought, appropriate time scale should be selected for evaluation and monitoring of drought.
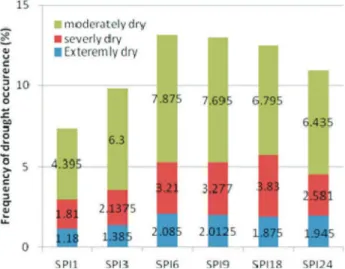
Also, percentage of drought frequency in different time scales SPI are shown in Fig. 3. It obvious, the fre-quency of occurrence of the moderately drought is more than extremely and severity dry condition (Tab 4 and Fig. 3). Also, by analyzing the results of drought, it is clear that with increase of length of time scales, drought duration will increase. So that the high value of extremely and mod-erately dry were observed for SPI with 6 and 9 month time scales.
Table 4, Summarizes the percentage of the relative frequencies, by comparing the frequency of SPI in different time scales, during 32 years in Shahrekord, Dezak, Emam chaie and Pole zamankhan satations, it become clear that maximum frequency is at the normal level and there is no particular procedure in different time scales (Table 4).
The maximum frequency is observed at Pole zamankhan station with 85.3% at in 24 months time scale, in a normal class. The most frequency of extremely drought was observed in Dezak station (4.5%) where is located in the eastern parts of study area.
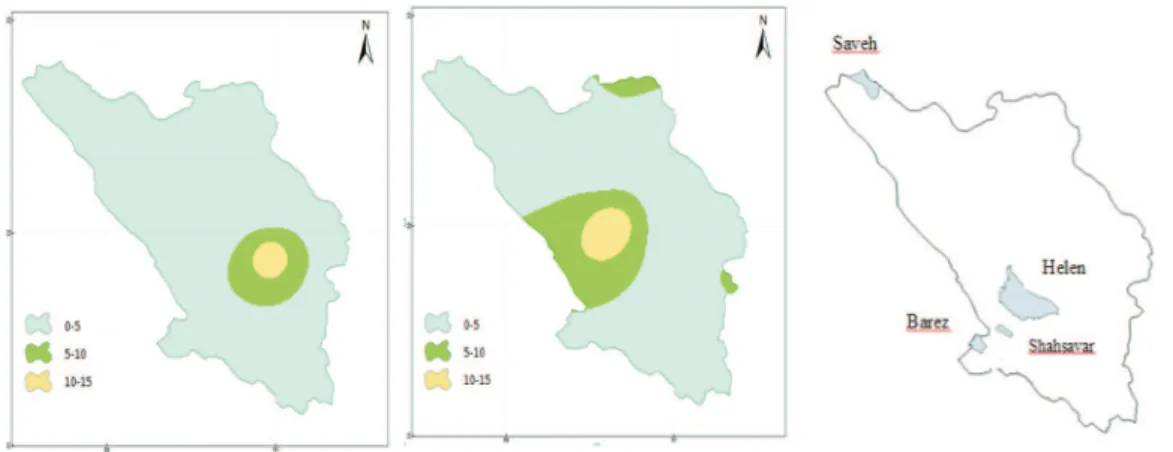
The oak decline is one of the most serious problem in the Zagros forest that is leads to destruction, the southwest parts of study areas suffer from this problem, including: Helen, Saveh, Barez and Shahsavar.
Figures 4 and 5 shows relative frequency of SPI in time scale one month, during the 30 years period in two parts. (1983-1998) and (1998-2013). As shown in Fig. 4, the frequency of extremely and severity drought occur-rences on April are more than January duration 1998-2013. It is also observed that drought frequency on January in-creased in the second half of the period compared to the first period.
Figure 5 shows the frequency of drought occurrence in study area and forest under oak decline in Chaharmal-Bakhtiyari province. As shown in Fig. 5, the central and southwest parts are more sensitivity in terms of vulnerabil-ity, which is according with forest under oak decline. Be-cause the droughts happened approximately 5-15 times in
Table 2- Dry and wet categories of various drought indices based on in-dex value.
Values SPI Class Symbol
3 ³2 Extremely wet EW
2 1.5 to 1.99 Severely wet SW
1 1 to 1.49 Moderately wet MW
0 -0.99 to 0.99 Normal N
-1 -1 to -1.49 Moderately dry MD
-2 -1.5 to -1.99 Very dry VD
-3 £-2 Extremely dry ED
Table 3- Comparison of initiation and end of drought events with the SPI obtained in different time scales.
Initiation End Initiation End Initiation End Initiation End
SPI48 - - 2001(Apr) 2001(Nov) 2002(Mar) 2002(Apr) -
-SPI24 2000(Mar) 2000(Nov) 2001(Feb) 2001(Oct) - - -
-SPI18 2000(Apr) 2000(Sep) 2001(Apr) 2001(Aug) 2008(Oct) 2008(Dec) 2009(Jan) 2009(Mar)
SPI9 2000(Oct) 2000(Nov) - - 2008(Mar) 2008 (Oct) -
-SPI6 2000(Jul) 2000(Oct) - - 2008(Mar) 2008(Feb) -
-SPI3 2000(Apr) 2000(Jun) - - 2008(Apr) 2008(May) -
central parts, while occurrence of drought frequency were 0-5 times in the other parts of province during 30 years. So, it is clear that the probability of desertification and destruc-tion in the central parts of province are more than other parts.
For better understanding of the changes in the situa-tion of drought was used the spatial and the maps of drought for the period 1980-2012 were drawn (Fig. 6). It is clear that, the 1989 was started drought condition from the north-west and eastern parts of province until 1990 dry condition covered the whole of the study area, then the normal condi-tion return in next year until 1994. Dry condicondi-tion covered again the whole of province in 1995, 2000, 2008 and 2010, while the wet conditions were observed from 1991 to 1994 and 2001-2005 years.
A general result of drought patterns maps show that the northern and central parts of this province had
experi-Figure 3- Comparison of percentage of drought severity categories
iden-tified using SPI.
Table 4- Relative frequencies (%) of different categories detected by six time-scale of SPI during 1980-2012.
Station Shahrekord Pole zamankhan
SPI1 SPI3 SPI6 SPI9 SPI18 SPI24 SPI1 SPI3 SPI6 SPI9 SPI18 SPI24
Extremely dry 2.23 1.26 2 2 3 4.5 0.25 1.26 1.76 1.05 0 0
Very dry 0.5 4.3 4.5 5.3 5.5 2.5 2.27 0.75 2.27 2.27 1.76 0.25
Moderately dry 5.3 4.8 9.34 9.09 6.06 4.8 3 6.3 5 6.8 8.3 6.65
Extremely wet 15.2 8.8 11.9 10.8 10.35 6.8 23.7 10.1 6.06 2.78 4.04 12.6
Very wet 3.79 6.06 5.8 5 6.3 7.82 2.5 2.27 1.5 1.5 1.05 6.3
Moderately wet 205 2.02 2 2.27 1.05 2 2.5 1.05 1.26 0.75 0 0
Normal 70.4 72.7 64.4 65.4 67.67 71.5 65.6 78.3 82.07 84.8 84.8 74.2
Station Emam chaie Dezak
SPI1 SPI3 SPI6 SPI9 SPI18 SPI24 SPI1 SPI3 SPI6 SPI9 SPI18 SPI24
Extremely dry 0.75 0.75 1.05 0.5 0 0 1.5 2.27 3.53 4.5 4.5 3.28
Very dry 1.5 1.5 2.78 1.76 1.76 0.25 3 2 3.28 3.78 6.3 7.32
Moderately dry 5.5 7.8 7.32 7.32 7.32 6.65 3.78 6.3 9.84 7.57 5.5 5.8
Extremely wet 24.2 11.1 11.6 12.9 13.1 12.6 17.4 13.1 12.9 12.6 13.1 9.09
Very wet 4.5 5.3 5 5 4.5 6.3 4.79 2.78 4.3 4.3 5.5 8.3
Moderately wet 2 2 1.26 1.26 0.75 0 1.05 1.5 1.26 1.5 0 0.25
Normal 61.4 71.5 70.9 71.2 72.50 74.2 68.4 71.96 64.9 65.65 64.9 65.9
Figure 5- The frequency of drought occurrence from 1983-1998 (the west), 1998-2013 (the east) and forest under oak decline in Chaharmal-Bakhtiyari province.
enced droughts more than other places, and these place have potential to destroy the lands.
4. Conclusion
In this paper, the main aim was the evaluation and monitoring of drought by SPI in different time scales for in the Chahrmal-Bakhtiyari Province in Iran. Duration, fre-quency and magnitude of drought have been studied. Totally, the results which are based on precipitation are im-portant for decision makers and water management.
The study used 32 years (from 1980 to 2012) of monthly precipitation data. The SPI in different time scales were used to determine the onset and end of drought history in the study area. The results show that selection of differ-ent time scales can be based on managemdiffer-ent goals. The SPI at one time scale reflects short-term precipitation patterns, While the SP18, SPI12, SPI24 and SPI48 responds more slowly to changes in precipitation and gives longer duration of drought compared to SPI1, SPI3. Hayeset al.(1999),
mentioned that SPI1 and SPI3 indicated a severe drought although only a low amount of precipitation was short in dry seasons, since SPI1 and SPI3 are nearly the same con-cepts as percentage anomaly.
The SPI 12 considers rainfall shortage for only 1 year, so, the large observed difference in index values oc-curred. Also, by identification of sensitivity region can be take appropriate management to prevent damage resulting of drought. A general result of drought patterns maps show that the northern and central parts of this province had experienced droughts more than other places, and these place have potential to destroy the lands. With con-sider that the forests have a vital role on decreasing of greenhouse gas in the world, so protections of them are important. While, oak forest where are located in Zagros areas suffer from oak decline without any known reason, which leads to destruction on recent decade. Studying the frequency of drought and distribution of forest under oak decline showed that the southwest parts of province are vulnerability to both of oak decline and drought fre-quency. So it maybe, drought be one of the main reasons of oak decline.
References
BYUN, H.R.; WILHITE, D.A. Daily quantification of drought se-verity and duration.Journal of Climate, v. 5, p. 1181-1201, 1996.
GUTTMANN, N.B. Comparing the palmer drought index and the standardized precipitation index. Journal of Water Resour., v. 34, p 113-121, 1998.
HAO, Z.; AGHAKOUCHAK, A. Multivariate standardized drou-ght index: A multi-index parametric approach for droudrou-ght analysis.Journal of Water Resour., v. 57, p. 12-18, 2013. HAYES, M.J.; SVOBODA, M.D.; WILHITE, D.A.; VANYAR-KHO, O.V. Monitoring the 1996 drought using the Stan-dardized Precipitation Index (SPI).Bulletin of the Ameri-can Meteorological Society, v. 80, p. 429-438, 1999.
HAYES, M.; SVOBODA, M.; WALL, N.; WIDHALM, M. The Lincoln declaration on drought indices, Universal meteoro-logical drought index recommended. Journal of Meteor Socity, v. 92, p. 485-488, 2011.
JAIN, K.; PANDEY. R.; JAIN, M.; BYUN, HR. Comparison of drought indices for appraisal of drought characteristics in the Ken river basin.Journal of Weather and Climate Ex-tremes, v. 8, p. 1-11, 2015.
MCKEE, T.B.; DOESKEN, N.J.; KLEIST, J. The Relationship of drought frequency and duration to time scales.Conference on Applied Climatology, p. 17-22, 1993.
MO, K.C. Drought onset and recovery over the United States.
Journal of Geophysic Resource, v.116, p. 201-216, 2011.
MORID, S.; SMAKHTIN, V.; MOGHADDASI, M. Comparison of seven meteorological indices for drought monitoring in Iran. Journal of Climatology, v. 26, p. 971-985, 2006. PALMER, W.C. Meteorological drought,Research IN
Depart-ment of Commerce Weather Bureau, n. 45, 1965.
PANDEY, R.P.; DASH, B.B.; MISHRA, S.K.; SINGH, R. Study of indices for drought characterization in KBK districts in Orissa.Journal of Hydrology, v. 22, p. 1895-1907, 2008.
PAULO, A.; PEREIRA, L. S. Drought concepts and characteriza-tion,Water International, v. 31, p. 37-49, 2006.
RIEBSAME, W.E.; CHANGNON, S.A.; KARL, T.R. Drought and natural resource management in the United States: im-pacts and implications of the 1987-1989 drought.Westview Press, p. 174, 1991.
ROUDIER, P.; MAHE, G. Study of water stress and droughts with indicators using daily data on the Bani River (Niger Ba-sin, Mali). Journal of Climatology, v. 30, p. 1689-1705,
2010.
WILHITE, D.A. Drought and water crises.Science, Technology, and Management Issues.Taylor and Francis, p 406, 2005.
WILHITE, D.A.; GLANTZ, M.H. Understanding the drought phenomenon: The role of definitions.Water Intternational Journal, v. 10, p. 111-120, 1985.
WORLD METEOROLOGICAL ORGANIZATION (WMO). Drought Monitoring and Early Warning: Concepts, progress and future challenges. World Meteorological Organiza-tion, n. 1006, 2006.
WU, H.; HAYES, M.J.; WELSS, A.; HU, Q. An Evaluation the standardized precipitation index, the China-z index and the statistical Z-Score.International Journal of Climatology,
v. 21, p. 745-758, 2001.