Crack Detection in Fibre Reinforced Plastic
Structures Using Embedded Fibre Bragg
Grating Sensors: Theory, Model Development
and Experimental Validation
G. F. Pereira*, L. P. Mikkelsen, M. McGugan
Technical University of Denmark, Department of Wind Energy, Roskilde, Denmark
Abstract
In a fibre-reinforced polymer (FRP) structure designed using the emergingdamage toler-anceandstructural health monitoringphilosophy, sensors and models that describe crack propagation will enable a structure to operate despite the presence of damage by fully exploiting the material’s mechanical properties. When applying this concept to different structures, sensor systems and damage types, a combination of damage mechanics, moni-toring technology, and modelling is required. The primary objective of this article is to dem-onstrate such a combination. This article is divided in three main topics: the damage mechanism (delamination of FRP), the structural health monitoring technology (fibre Bragg gratings to detect delamination), and the finite element method model of the structure that incorporates these concepts into a final and integrated damage-monitoring concept. A novel method for assessing a crack growth/damage event in fibre-reinforced polymer or structural adhesive-bonded structures using embedded fibre Bragg grating (FBG) sensors is presented by combining conventional measured parameters, such as wavelength shift, with parameters associated with measurement errors, typically ignored by the end-user. Conjointly, a novel model for sensor output prediction (virtual sensor) was developed using this FBG sensor crack monitoring concept and implemented in a finite element method code. The monitoring method was demonstrated and validated using glass fibre double cantilever beam specimens instrumented with an array of FBG sensors embedded in the material and tested using an experimental fracture procedure. The digital image correlation technique was used to validate the model prediction by correlating the specific sensor response caused by the crack with the developed model.
a11111
OPEN ACCESS
Citation:Pereira GF, Mikkelsen LP, McGugan M (2015) Crack Detection in Fibre Reinforced Plastic Structures Using Embedded Fibre Bragg Grating Sensors: Theory, Model Development and Experimental Validation. PLoS ONE 10(10): e0141495. doi:10.1371/journal.pone.0141495
Editor:Mark G. Kuzyk, Washington State University, UNITED STATES
Received:June 22, 2015
Accepted:October 7, 2015
Published:October 29, 2015
Copyright:© 2015 Pereira et al. This is an open access article distributed under the terms of the
Creative Commons Attribution License, which permits unrestricted use, distribution, and reproduction in any medium, provided the original author and source are credited.
Data Availability Statement:All relevant data are within the paper and its Supporting Information files.
Funding:The authors acknowledge support from Seventh Framework Programme, Project reference 309395 as a Marie-Curie Initial Training Network; Fibersensing for providing the FBG sensors and hardware; and SSP-Technology for providing the material tested.
Introduction
Damage Tolerant Design and Structural Health Monitoring in
Fibre-Reinforced Polymer Material Structures
Fibre-reinforced polymer materials (FRP, often referred to as composite materials) have been extensively used in aerospace, automotive, naval, wind energy and civil engineering applica-tions, mostly due to their high stiffness/weight ratio. A fibre-reinforced polymer composite material consists of two distinct macroscopic phases: a stiff phase (generally glass or carbon) and a polymer matrix. One of the advantages of FRP material is their ability to be tailored for a specific application; this enables an enhancement and a high level of customisation of their mechanical properties. Thus, in a FRP structure, it is possible to align the reinforcement in the directions where higher stiffness is required, which makes the structure lighter compared with the structure of a conventional material [1].
Currently, the higher demand for more cost-effective, light-weight FRP structures is push-ing advances in material technology and design philosophy. In this way, the design philosophy of FRP structures that is based on conservative analysis methods, with large safety factors, underestimation of the material properties, and considering only the linear behaviour of the materials, is becoming obsolete. A shift in the design philosophy has been discussed by several authors [2,3], where the concept of damage tolerance is suggested as an energy concept based on a particular combination of structural design, loading environment, and material character-istics, which will enable the structure to operate despite the presence of damage. However, a standalone damage tolerance approach will not be achieved until all physical phenomena pres-ent in the FRP field are fully understood. The solution starts by accepting the presence of dam-age and its unpredictability, tracking this damdam-age using a structural health monitoring approach, where sensors integrated during manufacturing will provide information about the presence of damage in an accurate way, its location, the type of damage and the remaining operating life of the structure.
Article Objectives
The main objective of this article is to provide a better understanding of the different fields that need to be addressed to design a structure using adamage toleranceandstructural health moni-toringphilosophy, as well as a methodology that can follow this concept to different structures, sensor systems and damage types.
To achieve this goal, it is necessary to explore three different fields in more detail; thus, the following key concepts are linked and fully described.
• Damage mechanism: delamination in FRP as a damage tolerance property of the structure. Fracture mechanism and stress distributions along the crack/damage area.
• Structural health monitoring technology: embedded fibre Bragg gratings to detect and track cracks/delamination in FRP structures. FBG working principle.
• Finite element method (FEM) model of the structure: incorporation of the damage mecha-nism with the structural health monitoring technology to a final and integrated damage-monitoring concept. Virtual FBG: FEM sensor output model for FRP delamination.
Delamination as a Damage Tolerant Mechanism
Interface fracture resulting from crack growth along interfaces in laminated structures is called delamination, and it can be considered as the most widespread cause of life reduction and one
of the most important failure mechanisms in FRP structures. Delamination can be analysed through fracture mechanics; thus, damage tolerance implies that the crack growth is stable and that the energy required for unstable crack growth (catastrophic event) is higher than the energy level required to initiate the crack. This damage tolerant mechanism can be defined as a crack bridging phenomenon, i.e., the delamination is accompanied by the formation of a frac-ture process zone, in which intact fibres connect the crack faces behind the crack tip, as shown inFig 1, which increases the energy required for a crack to grow.
This large-scale crack bridging zone cannot be addressed by linear elastic fracture mechan-ics (LEFM). Rather, a cohesive model can be used to describe the fracture process zone [4]. The cohesive lawσn(δn) can be briefly described as a normal traction,σn, as function of the normal
opening,δn, in the active cohesive zone [5].
Stress Distribution in the Crack/Damage Area
To successfully detect the growth of a crack in an FRP material, the measurement technique should track specific fracture features that only occur in the vicinity of a crack. Thus, the stress distribution around the crack tip in an FRP specimen was analysed. This allowed the different measured parameters to be linked with all the different fracture features.
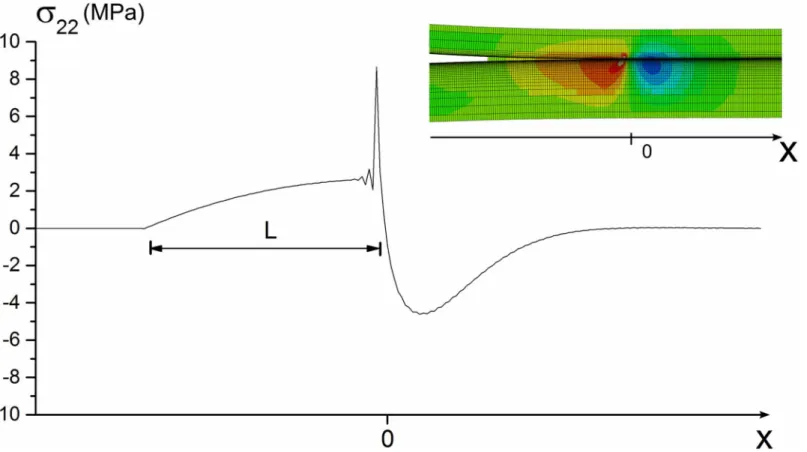
The fracture process zone (FPZ) is a region near the crack tip where the material strength is locally reduced. The stress distribution in the FPZ can be divided into two distinct contribu-tions: the crack tip singularity at the front of the FPZ and the crack bridging at the FPZ wake. Near the crack tip, the singularity dominated the zone (K-dominant). The stress field closely approached the singular stress field of LEFM, indicating that the stress tends to infinity, creat-ing a high stress gradient area, as shown in Figs2and3a).
Considering the crack tip where the material is developing damage atx= 0, in the fracture process zone given by−L<x<0, the material is damaged, and its ability to transfer stress is
decreased, as described by the cohesive law. This FPZ is characterised by a positive stress zone, as shown in Figs2and3b), which is balanced by a compression zone ahead of the crack tip (x>0). The size of the compression zone will depend on the cohesive law and the material parameters [4].
Fig 1. Fibre bridging phenomenon during delamination in a glass fibre specimen.
Structural Health Monitoring
Accepting damage and incorporating it as part of the design process will require full control over the structural integrity. A structural health monitoring system’s main purpose is to pro-vide information about the presence of damage in an accurate way, its location with good reso-lution, and the prognosis for the remaining life of the structure. Some techniques have already been implemented to detect cracks and monitor their growth, such as acoustic emission [6], where ultrasonic stress waves generated by crack growth are detected; vibration [7], by measur-ing the change in the specific dampmeasur-ing capacity; modal analysis [8], by monitormeasur-ing the natural frequencies and mode shapes; piezoelectric actuators/sensors; and wavelet analysis [9] based on the energy variation in the structural dynamics. However, applying these techniques in operational structures presents some difficulties due to technical limitations, the need for man-ual inspections performed by qman-ualified operators, expensive hardware, and so forth.
Fibre Optic Sensors as Structural Health Monitoring Technology
Fibre optic sensors, such fibre Bragg gratings (FBG), have the ability to perform damage/failure monitoring during the operation of a structure without compromising its performance and structural resistance. The small size of an FBG, a diameter of 125μm, makes it virtually non-intrusive when embedded in the material. Additionally, FBG sensors have high resolution, multiple measurement points per fibre capability (multiplexing), immunity to electromagnetic Fig 2. Finite element method simulation: stressσ22distribution at the fracture process zone (FPZ) for Mode I fracture.
fields, chemical inertness, immunity to optical power fluctuations, and long-term stability. These characteristics make embedded FBGs a very promising technology for tracking cracks in composite materials.
Knowing that an embedded FBG sensor will be under the influence of different fracture phenomena during a crack growth event, such as a crack bridging zone, where intact fibres connect the crack faces and a stress concentration zone near the crack tip that influences the stress distribution (stress gradient), being able to identify and measure these specific phenom-ena is the key factor for determining the presence of damage and its growth in a structure. In the next section, FBG sensor responses for three different stress/strain states that occur during crack growth are presented.
Fibre Bragg Grating Sensor
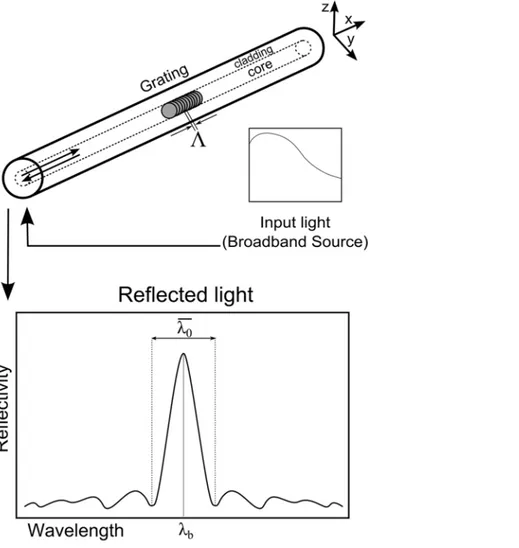
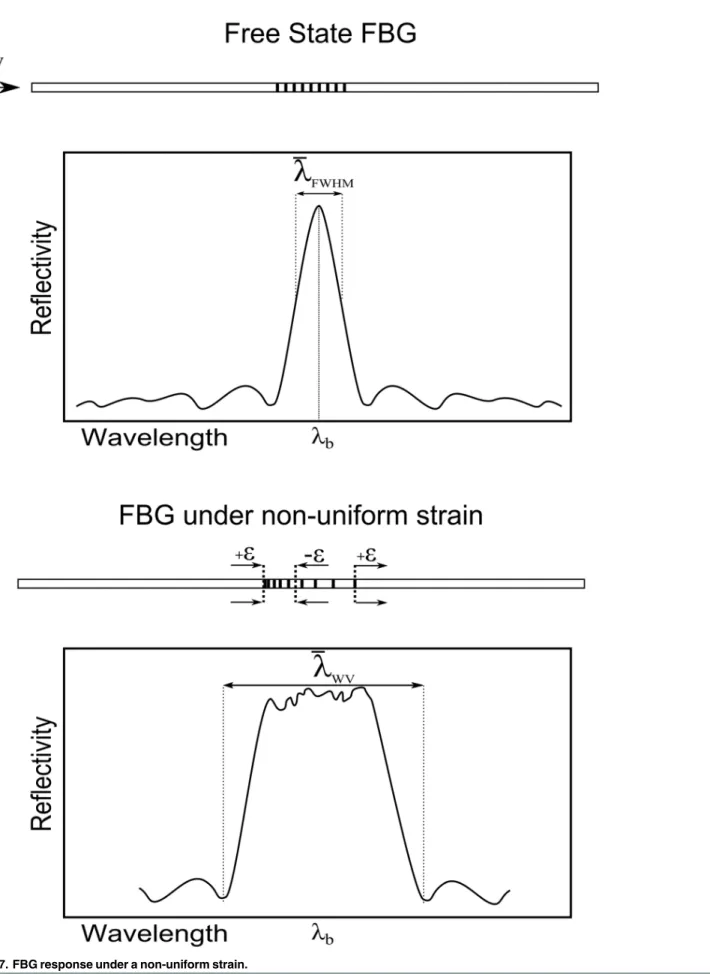
A fibre Bragg grating is formed by a permanent periodic modulation of the refractive index along a section of an optical fibre grating by exposing the optical fibre to an interference pat-tern of intense ultra-violet light [10]. The photosensitivity of the silica exposed to the ultra-vio-let light is increased; thus, when the optical fibre is illuminated by a broadband light source, the grating diffraction properties are such that only a very narrow wavelength band is reflected back, as shown inFig 4.
Fig 3. Illustration of bridging zone stress distribution.(a) Crack tip singular stress field and (b) schematic of a bridging law: relationship between the normal stress,σn, and separation,δn, across the FPZ.
In a free state, without strain and at a constant temperature, the spectral response of a homogeneous FBG is a single peak centred at wavelengthλ
b, with a certain bandwidthl0
(dis-tance between the twofirst minima), as shown inFig 4. The wavelengthλbis described by the
Bragg condition,
lb ¼2neff;0L0 ð1Þ
whereneff,0is the mean effective refractive index at the location of the grating, the index 0
denotes unstrained conditions (initial state), andΛ0is the constant nominal period of the
refractive index modulation [11]. The bandwidth is given by
l0
lb¼
1 neff;0
ffiffiffiffiffiffiffiffiffiffiffiffiffiffiffiffiffiffiffiffiffiffiffiffiffiffiffiffiffiffiffiffiffiffiffiffiffiffiffi
ðxdneff;0Þ 2
þ ðlb=LÞ2
q
ð2Þ
whereLis the gauge length,dneff;0is the mean induced change inneff,0, andξis the amplitude
of the induced index change [12]. An external load or temperature variation will change the Fig 4. Fibre Bragg grating response in a free state.
effective index of refraction and/or the period of modulation; this will create a shift of the wave-length reflected peak from its original value.
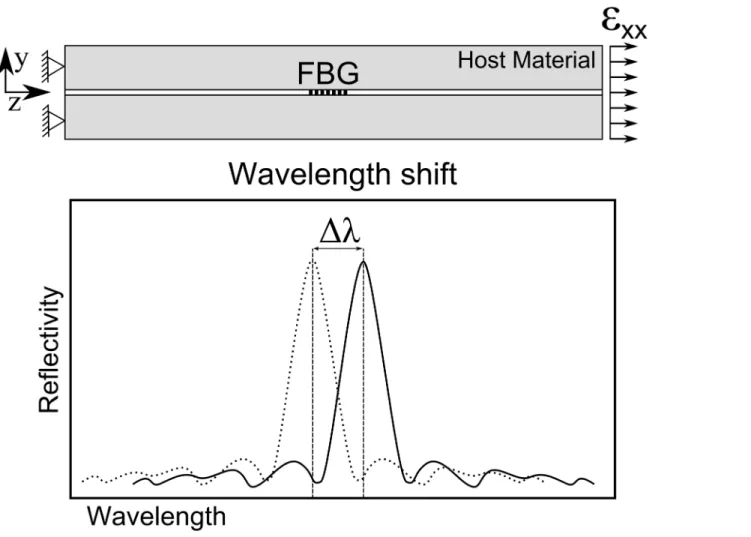
Response to Uniform Axial Strain. In the following sections, the temperature is assumed to be constant and to have no effect on the sensor response.
The sensor response to a uniform axial strain is schematically shown inFig 5. Assuming a uniform strainε
xxalong the grating length, the wavelength shiftΔλbin the sensor response is
described byEq (3)[13].
Dlb
lb ¼ ð1 peÞεxx ð3Þ
The parameterpeis a photo-elastic coefficients.
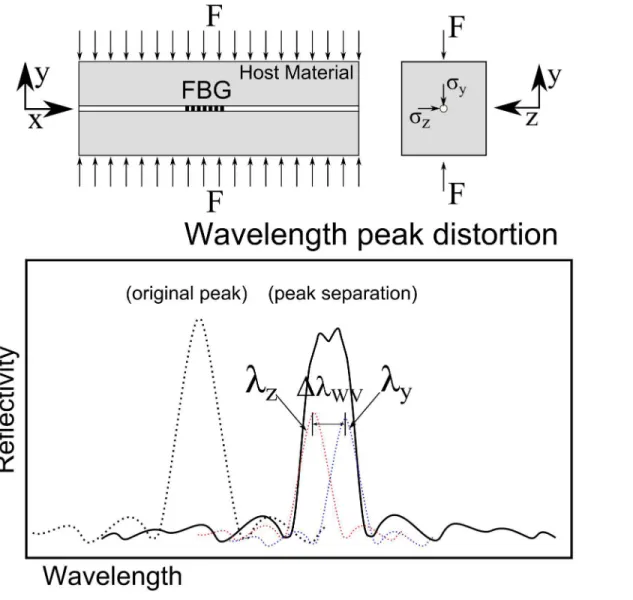
Response to Transverse Deformation: Birefringence Effect. An optical fibre can exhibit birefringent behaviour, which is defined by the change in the refractive indexneffof the two
directionsneffyandneffzwhen the grating is subjected to a transverse force [14–17]. The change
Fig 5. Embedded FBG response to a uniform variation of strain and/or temperature.
in the refractive index of the two directionsneffyandneffzis given by Eqs (4) and (5).
Dneffz¼ n3
0
2Ef
ðp11 2nfp12Þszþ ½ð1 nfÞp12 nfp11ðsyþsxÞ
n o
ð4Þ
Dneffy¼ n3
0
2Ef
ðp11 2nfp12Þsyþ ½ð1 nfÞp12 nfp11ðszþsxÞ
n o
ð5Þ
The parameterEfis the elastic modulus of the opticalfibre,νfis Poisson’s ratio,n0is the initial
refractive index, andp11andp12are the photo-elastic coefficients of the opticalfibre.
With this, when a transverse stress is applied to the grating, a separation of the reflected Bragg peak occurs (peak splitting), as presented inFig 6. The width variation of the reflected peak due to transverse deformation [15]Dl0WV¼ jlz lyjcan be calculated using Eqs (1), (4) Fig 6. FBG response under a transverse force: Birefringent effect.
and (5).
Dl0
WV ¼2LjDneffz Dneffyj ð6Þ
¼Ln
3
o Ef
ð1þnfÞðp12 p11Þ
h i
jsz syj ð7Þ
Response to Non-uniform Strain. A crack or defect in the material can create a stress concentration/gradient, which leads to an abrupt variation in strain. If the FBG sensor is inside this strain gradient zone, the grating will experience a non-uniform deformation, causing a sen-sor response that is significantly more complicated compared to a uniform case [14,18]. The non-uniform strain along the sensor length will change the periodicity of the grating pattern. In this way, the grating pattern is modified from auniformto achirpedconfiguration [19,20], as shown in theFig 7.
As demonstrated by Peters [12], in a non-uniform grating, the applied strain will induce a change in both the grating period and the mean index. These two effects can be superimposed by applying an effective strain of“(1−pe)εxx(x)”, whereεxx(x) is the strain variation along the
xdirection. Thus, it is possible to rewrite the grating period fromEq (1)as [12].
LðxÞ ¼L0½1þ ð1 peÞεxxðxÞ ð8Þ
The effective mode index along thexdirectionδn
eff(x) can be calculated by [12].
dneffðxÞ ¼ 1þxcos
2p
Lo½1þ ð1 peÞεxxðxÞ z
ð9Þ
In a real crack growth situation, the strain variation along the gratingε
xx(x) (non-uniform
strain) can be difficult to predict/simulate due to its strong non-linearity. The authors propose a simple method for evaluating the contribution of the non-uniform strain to the width varia-tion of the reflected peak by subtracting the bandwidth of the grating in a free statel0from the
bandwidthlWVof the grating under a linear variation of strain calculated using the maximum
εmax
xx ðxÞand minimumε min
xx ðxÞstrains along the grating length.
The bandwidth of an FBG in a free state can be calculated using an approximate expression that provides the full-width at half-maximum (FWHM) bandwidth [21],
l0lFWHM¼lbs dneff
2ncore
2
þ LL
2
" #1=2
ð10Þ
wheres1 for strong gratings with high reflectivity, ands0.5 for weak gratings,ncoreis the
unexposed core refractive index.
The width variation of the reflected peak resulting from the non-uniform strain effect can be approximated using the maximum and minimum strain values along the grating,εmax
xx ðxÞ andεmin
xx ðxÞ, respectively. The maximum grating periodΛmaxand minimum grating period
Λmincan be calculated usingEq (8), and the width variation of the reflected peak resulting
from non-uniform strainDl00WVis obtained by combining Eqs (8) and (1).
Dl00
Fig 7. FBG response under a non-uniform strain.
FBG Response During Crack Growth
The FBG responses under different stages of crack growth are shown inFig 8. 8(a) - No crack is present and a uniform strain,ε
xx, builds up around the grating area as the
structure is loaded. The FBG response is a uniform wavelength shift in the reflected peak,Δλ.
8(b) - A crack has initiated and is approaching the grating area. A compressive strain trans-verse to the FBG,ε
yy, forms ahead of the crack tip. Compressive strain changes the FBG
response creating a splitting (and hence a widening) of the reflected peak,Dl0WV.
8(c) - Progression of the crack causes a non-uniform strain field around the crack tip to reach the grating area. This modifies the FBG response by significantly increasing the width of the reflected peak,Dl00WV.
8(d) - The crack has passed the FBG sensor, and the FBG response has returned to its origi-nal shape. Only uniform strain acts on the grating, resulting in a uniform shift of the FBG reflected peak,Δλ.
Finite Element Method Model
Delamination Model
To analyse the delamination problem and to link it with the structural health monitoring tech-nique, a finite element method (FEM) model of a double cantilever beam (DCB) specimen was developed using the commercial software ABAQUS. This specimen geometry, DCB, was cho-sen because it is commonly used in fracture testing of composite materials, and later in this article, it will be used for experimental validation. The model was developed assuming plane Fig 8. Different stages of the FBG response under a crack growth event.
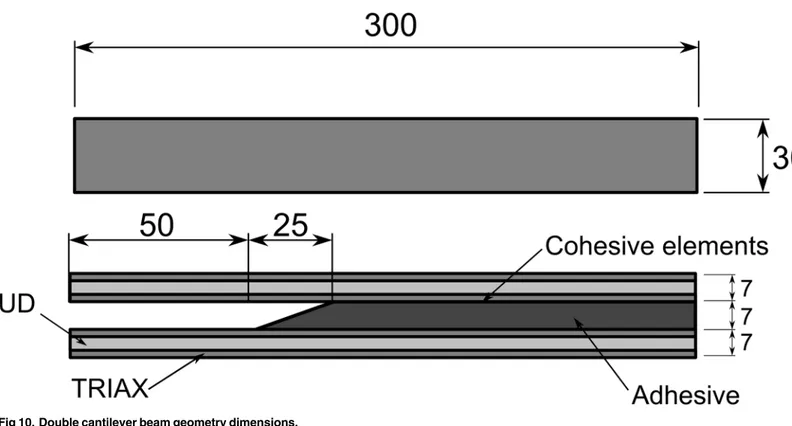
stress conditions (plane stress elements), and the delamination/fibre bridging was modelled using 4-node cohesive elements along the delamination plane [22,23].
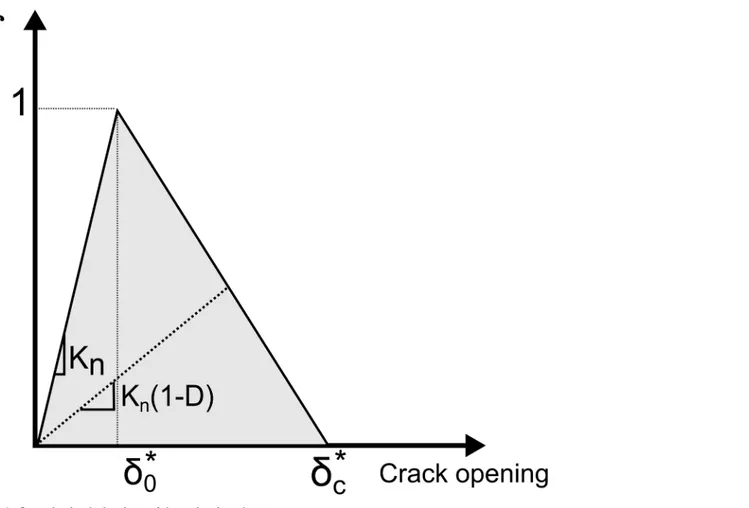
This method assumes that one or more interface elements (cohesive elements) can be prede-fined to hold the delamination phenomenon, allowing the introduction of a discontinuity in the displacement field. The cohesive elements are modelled to express the cohesive law (trac-tion-separation), meaning a progressive loss of the cohesion between the two crack faces with the local crack openingδ. The crack was modelled to occur between the interface of the
sive and the glass fibre arm beam. A cohesive element with a small thickness (0.5% of the adhe-sive layer thickness) was used to model only the interface between the two materials and to avoid neglecting the elastic contribution of the adhesive to the DCB global behaviour. In an undamaged state, the cohesive element follows a linear-elastic behaviour, defined as the penalty stiffnessKn, which relates the nominal stress (traction vector-σn,σs,σt) to the nominal strains
(δ
n,δs,δt), as presented inFig 9.
The damage initiation was calculated using a quadratic stress criterion presented inEq (12). [24]
f ¼ sn Nmax
2
þ ss
Smax
2
þ st
Tmax
2
¼1 ð12Þ
Fig 9. Constitutive behaviour of the cohesive element.
The parameterfis the damage criterion, and it is fulfilled when it reaches the valuef= 1. The parametersσn,s,tare the nominal stress in the normal, first shear and second shear
direc-tions, respectively, andNmax,Smax, andTmaxare cohesive law parameters; these parameters are
determined experimentally. The parametersd0anddc are the crack opening displacement to the local crack plane for damage initiation and critical damage. For mixed mode loading,d0 anddc were calculated using the law of Pythagoras.
d0 ¼qffiffiffiffiffiffiffiffiffiffiffiffiffiffiffiffiffiffiffid20;nþd20;s; dc ¼qffiffiffiffiffiffiffiffiffiffiffiffiffiffiffiffiffiffid2c;nþdc2;s ð13Þ
When the initiation criterion is reached, a damage evolution law will describe the material stiffness degradation. A scalar damage variable, D, ranging from 0 (no damage) to 1 (fully dam-aged), represents the damage in the cohesive element. A linear softening displacement criterion was used, given byδ0, which is the opening at damage initiation, andδc, which is the opening
at failure. In terms of mixed mode behaviour, a linear relation between Modes I and II was implemented.
Description of the Delamination FEM Model. The dimensions of the DCB specimen are shown inFig 10, and the material properties implemented in the FEM model are presented in Table 1.
The beams were modelled using a combination of two different laminates: unidirectional glass fibre (UD) and triaxial glass fibre (Triax). Moments were applied to the extremities of the beams, as shown inFig 11. Three different loading combinations were used: pure mode I-open-ing fracture, by applyI-open-ing identical moments to the DCB arms; pure mode II-shear fracture, by Fig 10. Double cantilever beam geometry dimensions.
applying symmetric moments to the DCB arms; and mixed mode-opening and shear fracture, by applying a moment to one arm and leaving the other arm free.
A minimum of 10 cohesive elements inside the active fracture process zone is suggested by some authors [25,26]. Using too few elements will introduce error in the crack growth resis-tance (fracture energy) calculation; however, finer meshes require more computational resources. Moreover, the mesh should be sufficiently fine to accurately represent the cohesive zone and the stress/strain variation along the grating length. An example of a coarse mesh is shown inFig 12. The stress and strain are not correctly represented along the grating length, leading to an inaccurate prediction of the sensor output.
A mesh resolution and result convergence study was conducted, as presented inTable 2. The maximum stressσythat is possible to measure along the sensor length (10 mm) and the
maximum strain variationΔε
xxat the crack tip were analysed. Based on this analysis, a
cohe-sive element size of 0.5mmwas selected, which meets the minimum element number require-ment and provides a good stress and strain resolution along the sensor length.
FBG Response Model: Crack Detection/Prediction
One of the goals of this article is to develop a numerical model for predicting the FBG output in a general crack growth situation, thus making it possible to use thismaterial-structure-sensor model as a design tool, and to study the application of this monitoring technology in different composite material structures/locations.
To accomplish this goal, an algorithm was developed usingPythonand incorporated into the FEM model, as shown inFig 13. The algorithm was developed as a post-processing tool that uses the stressσand strainεstate at the grating positions as input. In the first step, the
algorithm synchronises the stress, the strain, and the crack tip position with the virtual grating positions. Then, the algorithm computes the wavelength shiftΔλand width variation of the
reflected peakΔλ
WVversus the crack position for each virtual grating using the equations
developed in this article.
Some assumptions were made to compute the contribution of each fracture phenomenon to the sensor response. In a real application, the grating has a finite length, generally 8–10 mm; however, the FEM technique discretised the grating into finite parts or elements. Thus, to com-pute the wavelength shiftΔλb, which only depends on the global state of strainεxxaround the
grating, the average strainε
xin the elements at the position of the virtual grating was used.
Similarly, to compute the width variation of the reflected peak due to the compressive strain
Dl0WV, the average stress in the transverse directionσyandσzat the virtual grating position was
Table 1. Double cantilever beam material properties.
Composite Material Adhesive
Triaxial Fabric (Composite) Uniaxial Fabric (Composite) Elastic
E1= 44.3 GPa E1= 23.8 GPa E= 4.56 GPa
E2=E3= 12.9 GPa E2=E3= 15.05 GPa ν= 0.35
ν12=ν13=ν23= 0.23 ν12=ν13=ν23= 0.513 G12=G13=G23= 4393 GPa G12=G13=G23= 4.393 GPa
Interface (Cohesive Law)
Penalty Stiffness Damage (Quadratic stress) Damage Evolution
K= 4.2E12 Pa; σn= 2.64 MPa (Mode I) δc1= 1.4 (Mode I)
σt= 22.15 MPa (Mode II) δc2= 0.37 (Mode II)
Fig 11. FEM simulation of different fracture modes in a DCB specimen.
Fig 12. Mesh resolution study: cohesive zone and the stress/strain variation along the grating length.
doi:10.1371/journal.pone.0141495.g012
Table 2. Mesh resolution and result convergence study.
Mode I Mode II
Element size (mm) Maxσy(MPa) MaxΔεxx(%) Maxσy(MPa) MaxΔεxx(%)
5.0 3.81 0 1.29 0
3.8 3.78 0 2.36 0.012
1.0 6.27 0.2 5.55 0.022
0.5 7.84 0.7 10.13 0.82
0.25 7.88 0.71 10.67 0.87
used. To compute the non-uniform strain contribution to the reflected peak width variation
Dl00WV, a linear strain variation was assumed, using the maximum and minimum strain values along the elements in the virtual grating position. In reality, the strain distribution follows a polynomial curve, which depends on the material, geometry and crack shape. However, this approximation can be considered good due to the small size of the sensor. Thefinal width vari-ationΔλ
WVvalue is obtained by simply adding both contributions: the non-uniform strain
Fig 13. Algorithm applied to the FEM model to obtain the FBG output prediction.
(Dl00WV) and the transverse stress (Dl0WV). ThePythonscript used to calculate the sensor response from the FEM model is shown in Supporting information (S1 File).
Description of the Sensor Response FEM Model. In the FEM model, pure mode I, pure mode II and mixed mode were simulated to represent different crack growth conditions. An FBG array of 5 gratings was defined as virtual measurement points, each with a10 mmlength and spaced10 mmfrom each other. The first grating was placed 10 mm from the beginning of the adhesive, as shown inFig 14. The FBG array was placed between the interface of the com-posite material and the structural adhesive.
Table 3lists the parameters of the optical fibre used to implement the algorithm.
Numerical Simulation of the FBG Sensor Output During Crack
Growth
InFig 15, the numerical simulation of the FBG output response for a crack growing in a DCB specimen is shown.
The plots in the left column represent the wavelength shiftΔλbcaused by the longitudinal
strainε
xx. The plots in the right column represent the width variation of the reflected peak
ΔλWVcaused by the fracture/damage phenomenon near the grating. Different fracture modes
were addressed, namely, Mode I, Mixed Mode and Mode II in the first, second and third plot rows, respectively. The wavelength shiftΔλband the width variation of the reflected peakΔλWV
vs. crack tip position (CTP) were plotted in all figures. At each abscissa point (CTP), the output values of the 5 FBG sensors in that specific crack position are presented.
A jump in the wavelength shiftΔλ
bwas observed when the crack passed the position of the
grating. The damage/crack changes the local compliance of the material and load distribution, making the area that surrounds the sensor less stiff and more deformed; therefore, an increase in the strain was measured. However, it is possible to observe some differences in the evolution (shape) of the wavelength shiftΔλbecause the position of the sensor and the crack related to
the applied moments is different.
The model predicted that a variation in the width of the reflected peakΔλ
WVwill occur
when the crack is near the grating, in which the original peak width is restored after the crack passes the grating. The width variation response in all cases showed the same evolution pattern, exhibiting a loading- and geometry-independent behaviour. The magnitude of the differences of theΔλ
WVin mode II is related to the fracture material properties, i.e., the fracture resistance
in mode II is higher than that in mode I. This means that the stress distribution during crack growth in mode II is different, creating a higher strain variation. The differences observed in theΔλWVresponse for the FBG5in Mode I, FBG1in Mode II, and FBG1in Mixed Mode are
due to the effect of the model boundary conditions.
As previously discussed, thismaterial-structure-sensorcan be used as a tool for studying the application of this monitoring technology in different locations or structures. A grating posi-tion analysis scheme is presented inFig 16. Four positions were analysed: bottom composite laminate, bottom adhesive-composite interface, top adhesive-composite interface, and top composite laminate for Mode I and Mode II fractures. The sensor response for each position is shown inFig 17. As expected, in Mode I fracture (Fig 17a), the gratings located closer to the crack tip measure higher magnitude values. However, placing the sensor close to the crack can be technically difficult or even increase the probability of damaging the sensor during crack growth.
Fig 14. FBG measurement point in the FEM model.
Table 3. Fibre Bragg Grating Parameters.
Parameters:
λb- Initial wavelength From manufacturer (Ex:1528.81;1541.31; 1554.25;1567.12; 1580.24
(nm))
L- FBG length 10 (mm)
neff,0- Initial refractive Index 1.45 pe- Photo-elastic coefficient 0.215 p11- Photo-elastic coefficient
[20] 0.121
p12- Photo-elastic coefficient
[20] 0.270
Ef- Elastic modulus of FBG 75 GPa νf- Poisson’s ratio of FBG 0.17
doi:10.1371/journal.pone.0141495.t003
Fig 15. FBG sensor output simulation under crack growth: Mode I, II and mixed Mode fracture.
Fig 16. FBG sensor position analysis scheme.
doi:10.1371/journal.pone.0141495.g016
Fig 17. FBG sensor position analysis.a) Sensor output for Mode I fracture. b) Sensor output for Mode II fracture.
In Mode II fracture (Fig 17b), the sensor in position 1 showed a greater magnitude ofΔλb
andΔλ
WV. This result is because at position 1, the sensor is more distant from the bending
neu-tral-axis, consequently deforming more,εxx!Δλb, and experiencing a larger amount of
non-uniform strain,ε
xx(x)!ΔλWV.
Note that the sensor outputΔλWVshowed a variation in the signal that depends on the
loca-tion of the crack and the loading type. However, for the width varialoca-tion of the reflected peak
ΔλWV, the sensor showed the same behaviour for different fracture modes, presenting a
load-ing-independent behaviour. This makesΔλWVa key parameter for detecting cracksin
com-posite material structures.
Model Experimental Validation
Material and Experimental Procedure
To measure the FBG sensor response under a crack/delamination situation, double cantilever beam specimens with embedded fibre Bragg grating sensors were subjected to a controlled frac-ture progression. A special effort was made to identify specific fracfrac-ture feafrac-tures, such as com-pression stress and non-uniform fields, during the crack growth.
Loading and Fracture Modes. The three different combinations of forces that can cause a crack to grow are presented inFig 18. Mode I crack: opening mode, by tensile stress normal to the plane of the crack. Mode II crack: shear mode, by shear stress acting parallel to the plane of the crack and perpendicular to the crack front. Mode III: tearing mode, by shear stress acting parallel to the plane of the crack and parallel to the crack front.
Nominal mode mixity or phase angle,ψnom, is a parameter that defines the ratio of Mode I
and Mode II [27],
cnom¼tan 1 KII
KI
ð14Þ
whereKIIandKIare the mode II and mode I stress intensity factors, respectively.
For a homogeneous specimen without considering the adhesive layer, as shown inFig 19, the parameterψnomcan be defined as [28]
cnom¼tan 1
ffiffiffi 3
p
2
M1þM2
M1þM2
ð15Þ
whereM1andM2are the moments applied to the top and bottom arms, respectively. The
mixed mode ratioψnomcan be defined by the ratio of the moments applied to the DCB arms
(M1/M2). For pure Mode I (opening fractureψnom= 0°), when the moments are the same and
applied in opposite directions,M1>M2andkM1k=kM2k, and for pure Mode II (shearing
fractureψnom= 90°), when the moments are the same and applied in the same direction,M1=
M2.
The three different fracture modes used to conduct the experiments were as follows: pure Mode I, opening fractureψnom= 0°; pure Mode II, shear fractureψnom= 90°; and mixed mode
I/II, with a phase angle ofψnom= 68°.
The experiments were conducted with a constant displacement rate of the lower beam of the test machine of 2.5 mm/min [29].
Fig 18. Scheme of the three modes of loading that can be applied to a crack.
[29], shown inFig 20, was used. In this testing apparatus, the loading is applied through moments, providing a stable crack growth in the range of mode I to Mode II. Moreover, this testing apparatus allows the test to be stopped without decreasing the applied load, making it possible to perform measurements in a process that simulates continuous crack growth conditions.
To perform the loading, wires apply an equal transverse force to the transverse arms, which are attached to the DCB beams. The position where the wires are connected to the transverse arms defines the moments applied to each DCB beam, meaning that different wire positions will provide different loading types, from pure Mode I to pure Mode II. The force in the wires is measured by two load cells. One extensometer and two LVDTs (linear variable differential transformers) measure the crack face opening and sliding in the DCB specimen.
DCB Specimen Manufacturing. Two plates with dimensions of 700 × 1000 mm and a thickness of approximately 7 mm were produced using multiaxial glass fibre. Ten layers of fab-ric per plate were used, consisting of two triaxial fabfab-rics (Saertex Triax S32E4590) as skin layers and eight unidirectional central layers (Saertex S35EU910). The layup stacking of the laminates was [90/ + 45/−45/04/04/ + 45/−45/90], and the backing of the unidirectional layers was
fac-ing outwards, away from the central plane. The plates were made by hand lay-up of dry fibre fabric, followed by epoxy impregnation (Momentive-Epikote/Epikure-100:30) by vacuum infu-sion at 50°C for 5 hours and post-curing at 80°C for 3 hours. The plates were glued using a commercial structural adhesive (Momentive-Epikote/Epikure MGS BPR 135G/137G), and 7 mm spacers were used to obtain a well-defined specimen thickness and geometry. A thin slip foil was placed on the edge of the structural adhesive to act as a pre-crack and ease crack initiation.
An array of 5 uncoated single-mode FBG sensors (5 gratings in one optical fibre), with a length of 10 mm, were embedded in the interface of the laminate plate with the structural adhe-sive. The gratings in the array were spaced 10mmfrom each other, and the first grating was positioned 10mmfrom the edge of the adhesive.
Five specimens, 30 mm in width, were cut from the sandwich plates. Steel parts were fixed to each beam by 4 steel screws (M5) by an epoxy adhesive (Scotch-Weld DP 460 from 3M, hardened at 40°C for two hours). The DCB dimensions, different components, and fibre grat-ing locations are shown inFig 21.
Measurement Technology
Digital Image Correlation Technique. The digital image correlation (DIC) technique was used during the DCB fracture testing to determine the presence of specific phenomena caused by the crack, such as non-uniform strain or transverse stress, and correlate it with the FBG Fig 19. Homogeneous mixed mode specimen scheme.
sensor output. The DIC technique is a non-contact optical method that can correlate the defor-mation/strain in a material by tracking changes in a random pattern on the specimen.
A pattern was painted on the side surface of the DCB specimen, as shown inFig 22, and ARAMIS V6.3 software was used to calculate the strains in each measurement. To perform the measurements, ARAMIS recognises the surface pattern in the unloaded specimen and allocates coordinates to the image pixels. Then, ARAMIS compares the pattern in the loaded specimen picture and, by tracking the changes, calculates the displacement and consequently the strain distribution in the specimen face. The facet parameters used for strain calculation were 60 × 60 pixel facets with a facet step of 15 pixels, which corresponds to a 45 pixel overlapping area [30]. Fibre Bragg Grating Optical Spectral Analyser System. The FBG sensor was connected to an optical spectral analyser (OSA)FS2200- Industrial BraggMeterfrom FiberSensingTM[31]. Each measurement performed by the OSA is a file with 20000 points, corresponding to the Fig 20. Schematic illustration of the double cantilever beam test set-up.
Fig 21. Sketch of the specimen geometry and FBG sensor position.
doi:10.1371/journal.pone.0141495.g021
Fig 22. DIC pattern painted on the side surface of the DCB specimen.
reflected light spectrum for the bandwidth from 1500 to 1600nm. To manage this amount of data, an algorithm usingPythonwas developed that computes from the reflected spectrum the wavelength shiftΔλband the increase in width of the reflected peakΔλWV. Similar to the DIC
technique, the algorithm uses the first reflected optical spectrum, measured in the unloaded specimen, to calculate the variation in the wavelength shift and increase in reflected peak width for each measurement (seeFig 23).
To calculate the wavelength shiftΔλb, the algorithm detects the maximum reflected optical
power of each grating and then computesΔλ
bin relation to the original reflected peak. If the
reflected peak is distorted or shows a split shape, the algorithm interpolatesΔλbbetween the
maximum points in the grating bandwidth and the last maximum peak before the split occurred. To calculate the width of the reflected peakλWV, the algorithm determines the
maxi-mum and minimaxi-mum reflected optical power for each grating and measures the peak width at half maximum optical power ((maximum+minimal)/2). It then computes the width variation of the reflected peakΔλ
WVrelative to the original reflected peak width.
Experimental Results and Discussion
Three DCB specimens loaded with different fracture modes, namely, Mode I (ψnom= 0°),
Mode II (ψnom= 90°), and Mixed Mode (ψnom= 68°), are shown inFig 24. The type of fracture
mode performed for each DCB specimen is described inTable 4.
In specimens 1 and 5, an initial fracture test was performed until the crack reached the mid-dle of the FBG array. Then, the test was restarted with a different fracture mode to simulate a change in the loading conditions and evaluate the ability of the sensors to measure a crack independent of the loading configuration.
A critical issue found when using FBG sensors embedded in the FRP material is the possibil-ity of damaging the sensor. If the crack changes it path direction and crosses the optical fibre, this will cut the signal, losing all the gratings ahead of that point. To avoid this situation, crack initiation between the triaxial laminate and the unidirectional laminate was promoted by using a thin slip foil, as shown inFig 25. Thus, the FBG sensor was0.3–0.4 mmaway from the crack face, protected from any damage, as long as the crack did not change direction. As planned, the crack followed the predicted path for the Mode II and mixed mode testing. However, the crack did change direction during the test of specimens 2, 3 and 4 under Mode I, losing some of the gratings during the propagation of the crack. Nevertheless, sufficient data was acquired during these tests, allowing the validation of the structure-material-sensor model in mode I fracture.
The FBG response and DIC strain measurements during crack growth in a DCB specimen are shown inFig 26. The reflected peak of the Bragg grating that is situated closer to the adhe-sive edge corresponds to FBG 5, with an original reflected peak ofλ
b= 1580nm. All the
differ-ent crack features/phenomena that can change the shape of the reflected peak were iddiffer-entified and correlated with a specific FBG response. The left row pictures are DIC measurements, where the top shows the negative component of strain in theydirection,εy(“compression”
strain), and the bottom shows the strain in thexdirection,ε
x.
The blue spot in the top DIC measurements is the compression fieldεyformed ahead of the
crack tip. The colour gradient in the bottom DIC measurements is the indication of longitudi-nal variation of strain that moves with the crack tip.
By analysing the three figures, it is possible to identify all the different stages in the sensor response during crack growth, as described previously. InFig 26a), before the crack reaches the proximity of the grating, the material accumulates uniform strain. This induces a uniform wavelength shift in the sensor response, fromλb,0= 1580.00nmtoλb= 1580.25nm. Next, the
Fig 23. Algorithm for calculating the wavelength shiftΔλband the width variation of the reflected peak
ΔλWVfrom the reflected optical spectrum.
shape of the reflected peak to a split peak shape, with a peak width increase ofΔλ
WV= 1.33nm,
as shown inFig 26b). Additionally, an increase in the wavelength shift,Δλb= 1.41nm, was
measured, which was caused by the loading increase that consequently increased the strain in the specimen. If the crack continues to grow, the grating will gradually experience the influence of the crack singularity (region dominated by stress concentration), which creates a non-uni-form strain distribution around the sensor length. This non-uninon-uni-form strain will create a change in the reflected peak shape, where multiple reflected peaks appear and the peak width increases
ΔλWV= 2.21nm, as shown inFig 26c). Following the previous stages, an increase in the
wave-length shift was measured,Δλ
b= 2.17nm, which was caused by the continuous load increase.
Finally, after the crack passed the grating full length, the reflected peak width decreased,ΔλWV
Fig 24. Fracture modes addressed in the DCB testing.
doi:10.1371/journal.pone.0141495.g024
Table 4. Fracture Modes Tested.
DCB specimen 1 2 3 4 5
Fracture Mode I/II I I I II
I I/II
II I
= 1.32nm, and the shape of the reflected peak gradually recovered its original shape, as shown inFig 26d). However, the wavelength shift continued to vary,ΔλWV=−3.44nm, following the
increase of load and strain in the specimen.
Due to the large quantity of data saved during the fracture tests, it is impossible to present all the results in this article. However, to provide the reader with a better understanding of the crack detection technique, three movies from the three fracture modes tested (S1,S2andS3 Videos) are presented in theSupporting Information. In each movie is shown the reflected spectrum from the FBG array, a picture of the specimen during the test, and the DIC results, synchronised with the wavelength shiftΔλ
band peak width variationΔλWVmeasured during
the test.
The Mode I, Mode II and Mixed Mode fracture testing experimental results are compared with the numerical simulation in Figs27,28and29. The wavelength shiftΔλand width
varia-tion of the reflected peakΔλ
WVwere computed from the measured reflected spectrum given by
the OSA of the Braggmeter using the developed algorithm. The crack tip position was calcu-lated using the DIC technique.
Note that the goal of this technique is to detect cracks, not to quantify stress or strain. Thus, the magnitude of the measured values can vary, but the information obtained that is used to determine the presence of the crack is accurate. With this, a good agreement between the experiments and simulation was found.
The wavelength shift,Δλb, difference between the experimental results and the numerical
prediction is due to the loading and geometric dependency of this parameter; i.e., small varia-tions in the position of the sensor or a different crack growing path can vary the measured strain. For the Mode II and Mixed Mode cases, the path of the crack shifts during the test, changing the position of the grating from the top crack face to the bottom face, as shown inFig 25. This causes a change in the measured strain,Δλ
b), from positive to negative. However, in
terms of absolute values, both cases exhibited the predicted behaviour. Fig 25. Crack face in the DCB specimen.
As previously discussed, the main advantage of this monitoring technique is the use of two different FBG output parameters,Δλ
bandΔλWV, to determine the presence of the crack and to
track its growth. The wavelength shift,Δλ
b, is a parameter related to the strain level in the
structure, but it is dependent on the loading and geometry configuration. This can be observed in mode I loading, where an increase ofΔλ
bis observed, and in Mode II/Mixed, where a
decrease inΔλ
boccurs. However, the rapid increase in the magnitude ofΔλbis caused by a
damage event that reduces the stiffness of the structure. In contrast, the width variation of the reflected peak,Δλ
WV, is a parameter that only depends on the presence of a crack, independent
of geometry and loading type. The width of the reflected peak,Δλ
WV, increases when the crack
is near the grating area, being low in magnitude before and after the crack passes. In summary, Fig 26. FBG sensor output during crack growth in Mode II.a) Before crack initiation; b) crack growth: compression field at grating position; c) crack growth: non-uniform strain at grating position; and d) crack growth and passing all grating length.
these two parameters are a good indicator of the presence of cracks, and a structural health monitoring system based on FBG sensor technology needs to evaluate both variables to accu-rately detect such damage.
As an example of this crack detection methodology, refer toFig 28, when the crack tip is at 50 mm (beginning of FBG3). The value ofΔλ
bis larger for FBG1 and FBG2; the FBG3Δλb
value is starting to increase; and the FBG4 and FBG5Δλ
bvalues are still low. This indicates
that the compliance of the material is changing in location 3. However, the value ofΔλ
WVis
higher for FBG3 and FBG4, and it is lower for FBG1, FBG2, and FBG5. This result indicates that these two locations, 3 and 4, are experiencing specific fracture features ahead of the crack tip (compression and non-uniform strain). Using this information, we can confidently predict the crack position, which has already passed positions 1 and 2 and is located at position 3.
Summary and Conclusions
Inspired by the change in the“conventional”structure design philosophy to a damage tolerant structural design, through the use of damage tolerant materials combined with structural health monitoring techniques, an approach to detect damage in structures composed of Fig 27. Embedded FBG sensor output in a DCB specimen under Mode I fracture testing: numerical and experimental results.
composite materials and structural adhesive was outlined in this paper. This concept will even-tually lead to a condition monitoring-maintenance, which consists of the detection of damage by sensors, characterisation of damage (type and size), and model predictions of residual life that will enable decision-making with respect to whether a structure should be repaired or replaced.
The ability of fibre Bragg gratings embedded in composite materials to detect and track cracks/delamination by identifying the response of a sensor to a specific fracture/damage phe-nomena was demonstrated. Three different mechanisms that can change the sensor output, namely, longitudinal strainεxx, transversal stressσy,zand non-uniform strainεxx(x), were
described and linked with the different damage mechanisms that occur during a crack growth event. These different measurement concepts were incorporated into a finite element model of a delamination of a double cantilever beam to simulate the sensor output under different con-ditions. Using this technique, it becomes possible to extract information from the sensor out-put that is independent of the loading type, structure geometry and boundary conditions, depending only on the proximity of the crack and the material properties.
Fig 28. Embedded FBG sensor output in a DCB specimen under Mixed Mode fracture testing: numerical and experimental results.
Thematerial-structure-sensormodel can be used as a design tool for applying this monitor-ing technology in different composite material structures, predictmonitor-ing the sensor output, and determining the optimised sensor-structure configuration. As per the authors’vision, this material-structure-sensormodel concept will make it possible to design structures in composite materials that can operate safely, even when in damaged conditions.
Supporting Information
S1 File.Pythonscript to calculate the FBG sensor response from the FEM model. (PDF)
S1 Video. Crack Monitoring in DCB under Mode I fracture.This movie shows the applica-tion of crack monitoring technique using FBG sensors in a DCB specimen under Mode I frac-ture. It is showed the reflected spectrum from the FBG array, a picture of the specimen during the test, and the DIC results, synchronized with the wavelength shiftΔλ
band peak width
varia-tionΔλWVresults computed during the test. The movie is divided in two parts: in the first part
the DIC technique shows the negative component of the strain field in theydirection,ε
y; in
Fig 29. Embedded FBG sensor output in a DCB specimen under Mode II fracture testing: numerical and experimental results.
the second part the DIC technique shows the strain field in thexdirection,εx.
(MP4)
S2 Video. Crack Monitoring in DCB under Mixed Mode fracture.This movie shows the application of crack monitoring technique using FBG sensors in a DCB specimen under Mixed Mode fracture. It is showed the reflected spectrum from the FBG array, a picture of the speci-men during the test, and the DIC results, synchronized with the wavelength shiftΔλ
band peak
width variationΔλWVresults computed during the test. The movie is divided in two parts: in
the first part the DIC technique shows the negative component of the strain field in they direc-tion,εy; in the second part the DIC technique shows the strain field in thexdirection,εx.
(MP4)
S3 Video. Crack Monitoring in DCB under Mode II fracture.This movie shows the applica-tion of crack monitoring technique using FBG sensors in a DCB specimen under Mode II frac-ture. It is showed the reflected spectrum from the FBG array, a picture of the specimen during the test, and the DIC results, synchronized with the wavelength shiftΔλ
band peak width
varia-tionΔλWVresults computed during the test. The movie is divided in two parts: in the first part
the DIC technique shows the negative component of the strain field in theydirection,ε
y; in
the second part the DIC technique shows the strain field in thexdirection,εx.
(MP4)
Acknowledgments
The author acknowledges the Seventh Framework Programme (FP7) for funding the project MareWint (Project reference: 309395) as Marie-Curie Initial Training Network, Fibersensing for providing the FBG sensors and hardware, and SSP-Technology for providing the material tested.
Author Contributions
Conceived and designed the experiments: GFP LPM MM. Performed the experiments: GFP. Analyzed the data: GFP. Contributed reagents/materials/analysis tools: GFP LPM MM. Wrote the paper: GFP LPM MM.
References
1. Jones RM. Mechanics of composite materials. 2nd ed. Taylor & Francis; 1999.
2. Braga DFO, Tavares SMO, da Silva LFM, Moreira PMGP, de Castro PMST. Advanced design for light-weight structures: Review and prospects. Progress in Aerospace Sciences. 2014 Apr; 69:29. doi:10. 1016/j.paerosci.2014.03.003
3. McGugan M, Pereira G, Sørensen BF, Toftegaard H, Branner K. Damage tolerance and structural
mon-itoring for wind turbine blades. Philosophical Transactions of the Royal Society of London A: Mathemat-ical, Physical and Engineering Sciences. 2015; 373 (2035). doi:10.1098/rsta.2014.0077
4. Sørensen BF. Cohesive laws for assessment of materials failure: Theory, experimental methods and
application. Risø-Technical Univ. of Denmark, RisøNational Laboratory for Sustainable Energy.
Mate-rials Research Division; 2010.
5. Sørensen BF. Cohesive law and notch sensitivity of adhesive joints. Acta Materialia. 2002 Mar; 50
(5):1053–1061. doi:10.1016/S1359-6454(01)00404-9
6. Silversides I, Maslouhi A, Laplante G. Interlaminar fracture characterization in composite materials by using acoustic emission. In: 5th International Symposium on NDT in Aerospace. Singapore; 2013. 7. Kyriazoglou C, Le Page BH, Guild FJ. Vibration damping for crack detection in composite laminates.
Composites Part A: Applied Science and Manufacturing. 2004 Jul; 35(7–8):945–953. doi:10.1016/j.
8. Hu H, Wang BT, Lee CH, Su JS. Damage detection of surface cracks in composite laminates using modal analysis and strain energy method. Composite Structures. 2006 Aug; 74(4):399–405. doi:10.
1016/j.compstruct.2005.04.020
9. Yan YJ, Yam LH. Online detection of crack damage in composite plates using embedded piezoelectric actuators/sensors and wavelet analysis. Composite Structures. 2002 Oct; 58(1):29–38. doi:10.1016/
S0263-8223(02)00043-0
10. Hill KO, Meltz G. Fiber Bragg grating technology fundamentals and overview. Journal of Lightwave Technology. 1997; 15(8):1263–1276. doi:10.1109/50.618320
11. Kashyap R. Fiber Bragg Gratings. 2nd ed. Academic Press; 1999.
12. Peters K, Studer M, Botsis J, Iocco A, Limberger H, Salath R. Embedded Optical Fiber Bragg Grating Sensor in a Nonuniform Strain Field: Measurements and Simulations. Experimental Mechanics. 2001; 41(1):19–28. doi:10.1007/BF02323100
13. In-Fiber Grating Optic Sensor, Fiber Optic Sensors. 2nd ed. CRC Press; 2008.
14. Sorensen L, Botsis J, Gmür T, Cugnoni J. Delamination detection and characterisation of bridging trac-tions using long FBG optical sensors. Composites Part A: Applied Science and Manufacturing. 2007 Oct; 38(10):2087–2096. doi:10.1016/j.compositesa.2007.07.009
15. Zhang W, Chen W, Shu Y, Lei X, Liu X. Effects of bonding layer on the available strain measuring range of fiber Bragg gratings. Applied Optics. 2014 Feb; 53(5):885. doi:10.1364/AO.53.000885PMID: 24663267
16. Jülich F, Roths J. Comparison of transverse load sensitivities of fibre Bragg gratings in different types of optical fibres. In: Proc. of SPIE: Optical Sensing and Detection. vol. 7726; 2010. p. 77261N. doi:10. 1117/12.854019
17. Bosia F, Giaccari P, Botsis J, Facchini M, Limberger HG. Characterization of the response of fibre Bragg grating sensors subjected to a two-dimensional strain field. Smart Materials and Structures. 2003; 925(12):925–934. doi:10.1088/0964-1726/12/6/009
18. Sorensen L, Botsis J, Gmür T, Humbert L. Bridging tractions in mode I delamination: Measurements and simulations. Composites Science and Technology. 2008 Sep; 68(12):2350–2358. doi:10.1016/j. compscitech.2007.08.024
19. Yashiro S, Okabe T, Toyama N, Takeda N. Monitoring damage in holed CFRP laminates using embed-ded chirped FBG sensors. International Journal of Solids and Structures. 2007 Jan; 44(2):603–613. doi:10.1016/j.ijsolstr.2006.05.004
20. Zhang X, Max J, Jiang X. Experimental investigation on optical spectral deformation of embedded FBG sensors. Proceedings of SPIE—the International Society for Optical Engineering, Photonics Packag-ing, Integration, and Interconnects VII. 2007; 6478. doi:10.1117/12.700807
21. Bennion I, Williams J, Zhang L, Sugden K, Doran N. UV-written in-fibre Bragg gratings. Optical and Quantum Electronics. 1996; 28:93–135. doi:10.1007/BF00278281
22. Alfano G, Crisÿeld MA. Finite element interface models for the delamination analysis of laminated com-posites: mechanical and computational issues. International Journal for Numerical Methods in Engi-neering. 2001; 50(7):1701–1736. doi:10.1002/nme.93
23. Burlayenko VN, Sadowski T. FE modeling of delamination growth in interlaminar fracture specimens. Budownictwo i Architektura. 2008; 2:95–109.
24. ABAQUS. User Manual. Version 6.13, ABAQUS Inc., Pawtucket, Rhode Island, USA. USA; 2013. 25. Turon A, Dávila CG, Camanho PP, Costa J. An engineering solution for mesh size effects in the
simula-tion of delaminasimula-tion using cohesive zone models. Engineering Fracture Mechanics. 2007 Jul; 74 (10):1665–1682. doi:10.1016/j.engfracmech.2006.08.025
26. Álvarez D, Blackman BRK, Guild FJ, Kinloch AJ. Mode I fracture in adhesively-bonded joints: A mesh-size independent modelling approach using cohesive elements. Engineering Fracture Mechanics. 2014; 115:73–95. doi:10.1016/j.engfracmech.2013.10.005
27. Rice J. Elastic fracture mechanics concepts for interfacial cracks. Journal of Applied Mechanics. 1988; 55(1):98–103. doi:10.1115/1.3173668
28. Sørensen BF, Goutianos S, Jacobsen TK. Strength scaling of adhesive joints in polymer–matrix
com-posites. International Journal of Solids and Structures. 2009 Feb; 46(3–4):741–761.
29. Sørensen B, Jørgensen K, Jacobsen T,Østergaard R. DCB-specimen loaded with uneven bending
moments. International Journal of Fracture. 2006; 141(1–2):163–176.
30. ARAMIS. User Manual. Version 6.3, GOM optical measuring Techniques, Mittelweg 7–8, D-38106 Braunschweig, Germany. Germany; 2011.