Abstract
The purpose of this work is to investigate experimentally the effects of mixed-mode I/II loading on the fracture behavior of polymer mortars. Three point bend beam specimens with off-center notch were used in plane-strain fracture toughness tests. Two approaches have been simultaneously used to determine the crack opening displacements. The crack mouth opening displace-ment was measured by means of a clip gauge, while the crack tip opening displacement was estimated through the Digital Image Correlation method. Fracture parameters, such as critical values of crack opening displacement, energy release rate and mixed-mode stress intensity factor were estimated. In addition, the values of crack mouth opening displacement and crack tip opening dis-placement were used to evaluate the rotational factor. Finally, the effect of sliding mode-II in fracture was not easily observed using clip gage, however this effect was noticed employing Digital Image Correlation method.
Key words
mixed-mode I/II; fracture; polymer mortar; digital image correla-tion method
Experimental investigation of mixed-mode-I/II fracture
in polymer mortars using digital image correlation
method
1 INTRODUCTION
Polymer mortars are composite materials made with polymeric materials and inorganic aggregates, Czarnecki (2010) and Ribeiro et al. (2003). These types of materials have the advantage of provid-ing lightweight, fast curprovid-ing and durability. They are three to five times stronger than conventional concrete; moreover, do not display brittle characteristics that have limited its usefulness for load-bearing applications. Nowadays, polymer mortars have been used in precast components for bridge panels, buildings, machine bases, and transportation components. Previous studies have allowed an optimization of polymer mortar formulation, considering an extensive experimental program by Reis (2009) and Reis et al. (2011a, 2011b).
L.C .S . N un e s an d J. M.L. Re is*
Laboratory of Theoretical and Applied Me-chanics, LMTA,
Department of Mechanical Engineering, PGMEC,
Universidade Federal Fluminense, UFF, Rua Passo da Patria 156, 24210-240 Niterói, RJ, Brazil
Tel.: +55 21 5588, Fax: +55 21 2629-5585
Received in 28 Mar 2013 In revised form 11 Apr 2013
Latin American Journal of Solids and Structures 11(2014) 330 – 343
Many recent studies have focused on fracture behavior of polymer mortars. An alternative pro-cedure to identify fracture properties, Young’s modulus and Poisson’s ratio, of polymer mortars was proposed by Nunes et al. (2011). In addition, an investigation of mode-I fracture behavior of chopped grass fiber reinforced polymer mortars evaluating the crack-tip opening displacement, the crack extension and critical stress intensity factor through digital image correlation method was developed by Nunes and Reis (2012).
Knowledge of mixed mode fracture has a great importance for different types of structures. Sev-eral experimental works based on mixed mode fracture of concrete and similar materials have been performed by Kazemi and Vossoughi Shahvaril (2004), Gálvez et al. (1998, 2002), Swartz et al. (1988) and Jenq and Shah (1988). Some of them were developed using different experimental meth-ods for quantifying fracture phenomena, being based on optical methmeth-ods such as moiré interferome-try by He et al. (1997), electronic speckle pattern interferomeinterferome-try by Li et al. (2009) and Richter et al. (1988) and acoustic emission by Ohtsu et al. (1999).
The possibility of obtaining full-field displacements has generated wide interest in the Digital Image Correlation (DIC) method. The DIC is a powerful available optical-numerical method devel-oped to estimate full-field displacement without contact. This method has been well documented in the literature, Sutton (2009), Dally and Riley (2005) and Shape (2008). Several investigators have recently turned to employ the DIC method in different types of mechanical problems, including fracture problems Ferreira et al. (2011), Shah and Chandra Kishen (2010), Nunes (2012) and Veer-man and Muller (1972).
The main purpose of the present work is to investigate the effects of mixed mode I/II loading on the fracture behavior of polymer mortars. In order to do that, fracture toughness tests were per-formed using three point bend beam specimens with off-center notch at different locations along the span. Two approaches were simultaneously employed to measure the crack opening displacement. The crack mouth opening displacement (CMOD) was measured by means of a clip gauge, while the crack tip opening displacement (CTOD) was estimated through the digital image correlation meth-od. The experimental data were used to estimate some important fracture parameters, such as ener-gy release rate and approximated mixed-mode stress intensity factor. Moreover, the rotational fac-tor Veerman and Muller (1972), Kolednik, (1989), Bhattacharya and Kumar (1995) and Kumar and Bhattacharya (1995), which is associated to rotation of specimen about a plastic hinge axis with notch opening, was also estimated.
2 MATERIALS AND METHODS
Latin American Journal of Solids and Structures 11(2014) 330 – 343
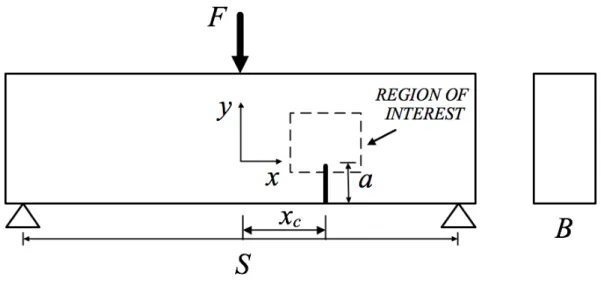
Polymer mortar specimens were compacted in a steel mold of dimensions of 30 x 60 x 250 mm3. The specimens were initially cured at room temperature and then post-cured for 3 hours at 80oC. The samples were notched using a 2mm diamond saw to a 20 mm depth. The final geometry for a single-edge-notched specimen was considered with a notch length, a, equal to 20 mm; a beam depth, W, equal to 60 mm; a beam thickness, B, equal to 30 mm; specimen loading span, S, equal to 240 mm. It is schematically illustrated in Fig. 1.
For inducing a mixed-mode fracture condition, loads were applied at the same position on the middle of specimens, while notches were located by xc values from position load at different loca-tions along the span, as shown in Fig. 1. The values of xc were obtained from the relation
x
c
=
γ
S
/ 2
, where γ varies from 0 to 0.6, Kazemi and Vossoughi Shahvaril (2004) and Jeng and Shah (1988).Figure 1 Scheme of three point bend beam with off-center notch
3 EXPERIMENTAL PROCEDURE
Three-point bend tests were performed using an electro-mechanical Shimadzu AG-X universal test-ing machine with a crosshead speed of 0.5mm/min. The crack mouth opentest-ing displacement (CMOD) was measured by means of a clip gauge mounted in the bottom of the beam in the notch and held in position by two 1.5mm steel knife edges glued to the specimen. At the same time, the crack tip opening displacement (CTOD) of specimen was determined through the DIC method. The experimental setup with clip gauge and DIC system is shown in Fig. 2. The DIC system for in-plane surface displacement measurement is composed of a Sony XCD-SX910 camera with Close Focus Zoom Lens (10xZoom). This system was used to record a sequence of image around notch tip, i.e., at region of interest as shown in Fig. 1.
Latin American Journal of Solids and Structures 11(2014) 330 – 343
Sutton et al. (2009) and Dally and Riley (2005). In order to do that, all specimens were painted with white paint and sprayed with black paint to obtain a random black and white speckle pattern to perform the correlation procedure.
Figure 2 Experimental setup of three-point bend tests: clip gage and DIC systems
The captured image were processed using DIC program (home-made DIC code) for estimating full-field displacements. The size of the images was 1280x960 pixels and the reference and target subsets equal to 31x 31 and 71x71 pixels, respectively. The accuracy of the DIC algorithm was ap-proximately equal to 0.01 pixels and the calibration factor, defined as millimeter per pixel, was equal to 10/393. It is important to emphasize that the 10x Zoom lens used in the present study provided relatively low image distortion. Those parameters were used for making accurate meas-urements.
4 RESULTS AND DISCUSSION
Latin American Journal of Solids and Structures 11(2014) 330 – 343
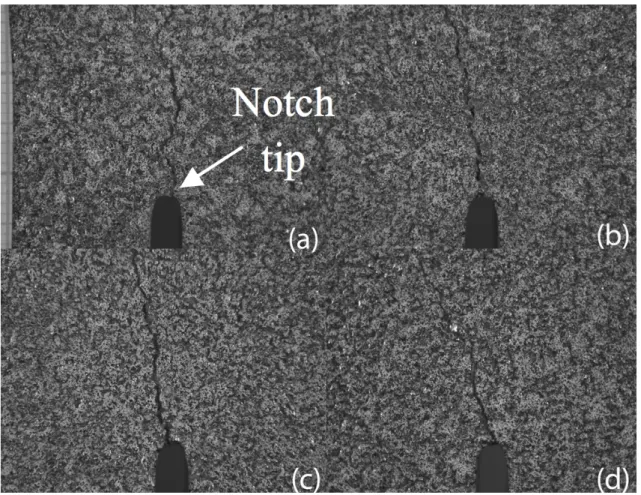
and taking into account these results the final failure angles were achieved, as summarized in Ta-ble1. It is important to note that the crack trajectory tends to applied load and the final failure angle of the crack increases, which accentuates the effect of sliding mode-II in fracture.
Figure 3 Experimental crack trajectories: (a) xc = 0 mm; (b) xc = 24 mm; (c) xc = 48 mm; (d) xc = 72 mm;
Table 1 Crack angle as a function of crack position.
Specimen xc(mm) Angle (degree)
CP1 0 0
CP2 24 11,3
CP3 48 11
CP4 72 23
Latin American Journal of Solids and Structures 11(2014) 330 – 343
Full-field displacements near the notch tip were measured by means of the DIC method. Sam-ples of u-displacement fields associated with different applied loads for CP1 (see Table 1) are illus-trated in Fig. 5. Clearly, the crack nucleation and crack propagations can be observed.
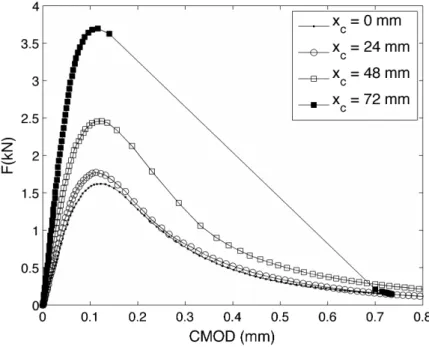
Figure 4 Crack mouth opening displacement as a function of applied loads
Latin American Journal of Solids and Structures 11(2014) 330 – 343
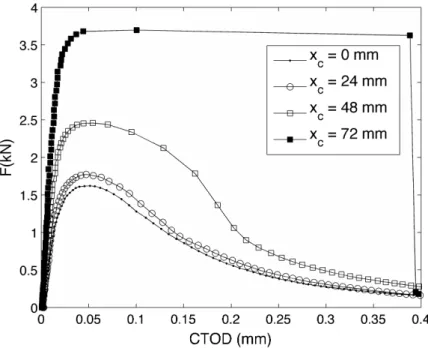
To determine the crack tip opening displacements (CTOD), the u-displacement fields were used. CTOD values were obtained by taking the discontinuity of u-displacement at the notch tip. More detailed analysis can be found in Nunes and Reis (2012). Figure 6 illustrates the crack tip opening displacement values as a function of applied loads, considering different notch positions. These re-sults were directly obtained from in-plane displacement fields near the notch tip. Note that for dif-ferent notch locations along the span, the critical applied load increases with xc values, while the load-CTOD plots present changes in shape.
Figure 6 Crack tip opening displacement as a function of applied loads
By results displayed in Figs. 4 and 6, the critical crack mouth opening displacement and the critical crack tip opening displacement were evaluated. These parameters were obtained taking into account the values of CMOD and CTOD corresponding to maximum applied loads. The results are summarized in Table 2.
Table 2 Fracture Parameters for three-point bending specimen with different notch locations.
Specimen xc (mm)
Fmax
(kN)
CMODC
(mm)
CTODC
(mm)
δ
0(mm) U (Nm)
Gc
(N/m)
Kc
(MPam1/2)
σ
Nmax(MPa)
CP1 0 1.62 0.122 0.051 0.308 0.47 390.68 2.23 11.68
CP2 24 1.77 0.112 0.047 0.329 0.51 423.48 2.32 10.64
CP3 48 2.46 0.124 0.054 0.390 0.64 536.55 2.61 11.06
Latin American Journal of Solids and Structures 11(2014) 330 – 343
As indicate in Table 2, the estimated critical CMOD have approximately the same values. Moreover, the values of critical CTOD from CP1, CP2 and CP3 are approximately equal to 0.05mm, while the critical CTOD from CP4 is larger than others. However, it is important to re-mark that this last value was achieved when fracture of the material was brittle and, consequently, a few number of points was taken into consideration.
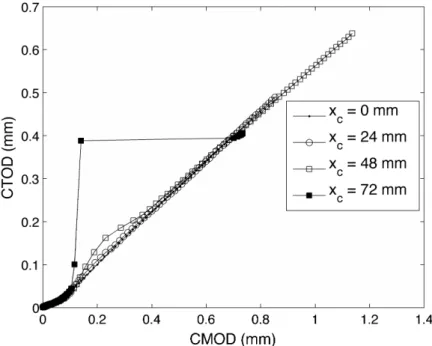
Figure 7 illustrates the correlation between CMOD and CTOD for different notch locations. A nonproportional behavior may be observed when the notches are taken off-center. This effect in-creases as the notch tends to move towards the support span. It is associated with mixed mode condition, in which the effect of sliding mode-II in fracture is accentuated. It is important to em-phasize that, in the present work, CTOD values were obtained directly. However, the indirect measurement of CTOD is usually determined by measuring the value of CMOD, considering linear relationship between them. Therefore, the use of DIC method has been proved to be useful to measure CTOD.
Figure 7 Crack tip opening displacement versus crack mouth opening displacement
Latin American Journal of Solids and Structures 11(2014) 330 – 343
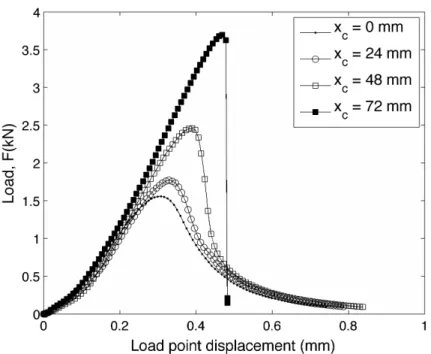
Figure 8 Load against load point displacement for different notch locations
The energy release rate of three-point bend beam was determined using the Direct Energy Method. In this method, only energy absorbed by the beam to the point of instability is considered. The energy release rate may be given by Swartz et al. 1988
G
c=
U
−
0.5
mg
δ
0BW
(
1
−
a
/
W
)
(1)where U is the area under the load-load point displacement curve, mg is the beam weight between support,
δ
0 is the load point displacement at peak load. The geometrical parameters of specimensB, W and a were previously presented in section 2.
Estimated values of U and
δ
0 are summarized in Table 2. Moreover, the energy release valuesLatin American Journal of Solids and Structures 11(2014) 330 – 343
Figure 9 Energy release rate at different notch locations
Despite mixed-mode condition, in present analysis, only approximate values of mixed-mode stress intensity factor associated with different notch locations were estimated. For determining this parameter, the calculated values of energy release (see Table 2) were taken. In this way, the follow-ing expression, considerfollow-ing the Poisson’s ratio very small, is assumed
K
c
=
G
cE
(2)where the Young’s modulus is E = 11.7 GPa, Nunes and Reis (2012). The estimated values of ap-proximated mixed-mode stress intensity factor are shown in Table 2. Fracture toughness increase as notch is dislocated, higher Kc is reported but more brittle failure is observed.
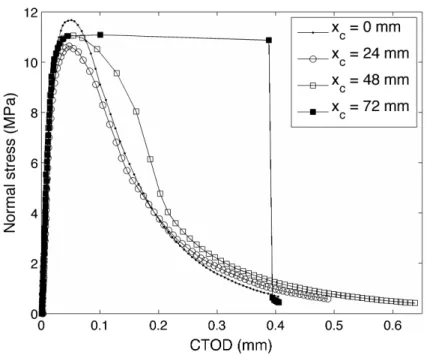
The tensile traction acting on the crack surface, or normal stress, can be expressed by
σ
N=
6
M
W
2B
(
1
−
a
/
W
)
2 (3)with the moment given by
M
=
F
4
(
S
−
2
x
c)
+
qL
4
(
S
−
2
x
c)
+
q
4
(
L
−
2
x
c)
2
. Where q is weight per
Latin American Journal of Solids and Structures 11(2014) 330 – 343
Figure 10 Normal stress as a function of crack tip opening displacement
The bend specimen rotates about a plastic hinge axis with notch opening. The rotational factor r is associated with this plastic hinge with the center of rotation at a distance
r W
(
−
a
)
from thecrack tip. In order to determine the rotational factor, the crack tip opening displacement (CTOD) and crack opening displacement (COD) were taken into account. The rotational factor can be de-termined through a linear relationship given by Gdoutos (2005).
r
=
CTOD
COD
−
CTOD
⎛
⎝
⎜⎜
⎜⎜
⎞
⎠
⎟⎟
⎟⎟
a
W
−
a
(
)
(4)Latin American Journal of Solids and Structures 11(2014) 330 – 343
Figure 11 Rotational factor as a function of CTOD
The rotational factor as a function of crack tip opening displacement for different notch location is shown in Fig. 11. It is important to emphasize again that the effect of sliding mode-II in fracture is observed.
5 CONCLUSIONS
Latin American Journal of Solids and Structures 11(2014) 330 – 343
Acknowledgements The authors would like to thank the Research Foundation of the State of Rio de Janeiro (FAPERJ) and The Brazilian National Council for Scientific and Technological Devel-opment (CNPq) for supporting part of the work presented here.
References
Bhattacharya, S., Kumar, A.N. (1995). Rotational factor using bending moment approach under elasto-plastic situation-I. Notch 3PB geometry, Engineering Fracture Mechanics 50 (4):493-505.
Czarnecki, L., (2010). Polymer concrete, Cement Wapno Beton 15(2):63–85.
Dally, J.W., Riley, W.F., (2005) Experimental Stress Analysis, 4th ed. McGraw Hill. Ferreira, M.D.C., Venturini, W.S., Hild, F., (2011). On the analysis of notched concrete beams: From measurement with digital image correla-tion to identificacorrela-tion with boundary element method of a cohesive model, Engineering Fracture Mechanics 78: 71–84.
Gálvez, J.C., Cendón, D.A., Planas, J., (2002). Influence of shear parameters on mixed–mode fracture of con-crete, International Journal of Fracture 118:163–189.
Gálvez, J.C., Elices, M., Guinea, G.V., Planas, J. (1998). Mixed mode fracture of concrete under proportional and nonproportional loading, International Journal of Fracture 94: 267–284.
Gdoutos, E.E., (2005). Fracture Mechanics: An Introduction, 2nd Ed., Springer.
He, S., Feng, Z., Rowlands, R.E., (1997). Fracture process zone analysis of concrete using moiré interferometry, Experimental Mechanics 37(3):367-372.
Jenq, Y.S., Shah, S.P. (1988). Mixed-mode fracture of concrete, International Journal of Fracture 38:123-142. Kazemi, M.T., Vossoughi Shahvaril, F., (2004). Mixed mode fracture of concrete: an experimental investigation, Scientia Iranica 11(4):378-385.
Kolednik, O. (1989). Plastic and overall rotational factors in bend- and CT-specimens, International Journal of Fracture 39:269-286.
Kumar, A.N., Bhattacharya, S. (1995). Rotational factor using bending moment approach under elasto-plastic situation-II. Crack 3PB geometry, Engineering Fracture Mechanics 50 (4): 507-517.
Lin, Q., Fakhimi, A., Haggerty, M., Labuz, J.F., (2009). Initiation of tensile and mixed-mode fracture in sand-stone, International Journal of Rock Mechanics and Mining Sciences 46:489–497.
Nunes, L.C.S., Reis, J.M.L., da Costa Mattos, H.S., (2011). Parameters identification of polymer concrete using a fracture mechanics test method and full-field measurements, Engineering Fracture Mechanics 78(17):2957-2965. Nunes, L.C.S., Reis, J.M.L., (2012). Estimation of crack-tip-opening displacement and crack extension of glass fi-ber reinforced polymer mortars using digital image correlation method, Materials and Design 33:248–253. Nunes, L.C.S., (2012). Crack-craze opening profiles near a crack tip in a polytetrafluoroethylene, Polymer Testing 31: 375–383.
Ohtsu, M., Kaminaga, Y., Munwam, M.C., (1999). Experimental and numerical crack analysis of mixed-mode failure in concrete by acoustic emission and boundary element method, Construction and Building Materials 13:57-64.
Reis, J.M.L., (2009). Effect of textile waste on the mechanical properties of polymer concrete, Materials Research 12:63-67.
Latin American Journal of Solids and Structures 11(2014) 330 – 343
Reis, J.M.L, Moreira, D.C., Nunes, L.C.S., Sphaier, L.A. (2011)b. Evaluation of the fracture properties of poly-mer mortars reinforced with nanoparticles, Composite Structures 93(11): 3002-3005.
Ribeiro, M., Tavares, C., Ferreira, A.J.M., Fernandes, A.A., (2003). Bending characteristics of resin concretes, Materials Research 6:247-254.
Richter, M.A., Wagner, J.W., (1988) Experimental evaluation of hinge phenomenon in notched three point bend bars using laser speckle metrology, Engineering Fracture Mechanics 30(6):819-826.
RILEM PC-2. (1985) Method of making polymer concrete and mortar specimens, Technical Committee TC-113 Test Methods for Concrete-Polymer Composites (CPT), International Union of Testing and Research Laborato-ries for Materials and Structures.
Shah, S.G., Chandra Kishen, J.M., (2010). Fracture properties of concrete–concrete interfaces using digital image correlation, Experimental Mechanics 51(3):303-313.
Sharpe, W.N., (2008). Handbook of Experimental Solid Mechanics, Springer Science and Business Media, LLC New York.
Sutton, M.A., Orteu, J.J., Schreier, H.W., (2009). Image Correlation for Shape, Motion and Deformation Meas-urements, Springer Science and Business Media LCC.
Swartz, S.E., Lu, L.W., Tang, L.D. (1988). Mixed-mode fracture toughness testing of concrete beams in three-point bending, Materials Structures/Matériaux et Constructions 21:33-40.