ISSN 1517-7076 artigo 11748, pp.841-852, 2016
Corresponding Author : David Hon Tew Received on: 11/12/2015 Accepted on: 23/08/2016
10.1590/S1517-707620160004.0080
Atmospheric corrosion of Nylon 6,6
in Mauritius
David Hon Tew 1, Baboo Yashwansingh Ranveersingh Surnam 1
1
Mechanical and Production Eng. Dept., Faculty of Engineering, University of Mauritius, Reduit, Mauritius
email: [email protected]; [email protected]
ABSTRACT
Plastics are being more and more commonly used for outdoor applications in Mauritius. In this context, the atmospheric corrosion degradation behaviour of nylon 6,6 was observed in the Mauritian atmosphere, having a corrosivity category of C3, according to ISO 9223. The crack width, depth and extent of the cracks formed on the surface were investigated using micrometry and image analysis. The changes in the chemical composition of the nylon 6,6 were investigated using the Fourier Transform Infrared spectroscopy technique. It was observed that the nylon 6,6 surface showed a progressive discolouration and a sudden increase in the size of the cracks after around 2 years of exposure. The degree of crack formation in terms of crack width, the depth of degradation and the microhardness of the surface were evaluated and all showed significant degradation only after about 2 years of exposure. Degradation has penetrated the test material within 750 µm from the surface in 4.5 years of exposure. Using the FTIR technique, evidence of chain scission occurring among the polymer chains was observed.
Keywords: nylon, atmospheric corrosion, weathering, cracks, FTIR.
1. INTRODUCTION
Any polymeric material which is mainly exposed outdoors, and hence to the weather conditions, will most likely deteriorate after a period of time. This process is also known as weathering. Weathering of polymers is a complex and unpredictable process because the degradation factors such as temperature, humidity or intensity of solar irradiation will depend primarily on the weather conditions. However, much emphasis needs to be put on the weathering resistance of polymeric materials as the demand for these materials is increasing day by day. Polymers deteriorate through:
1. Thermal degradation, which can be followed by thermo-oxidation [1];
2. Ultraviolet degradation, such as photo-oxidation. This involves the formation of micro cracks and a yellowing effect on composites [2] or surface cracking on long fiber-reinforced thermoplastic composites samples [3];
3. Hydrolytic degradation, which can cause subsequent discolouration of the material [4]; 4. Environmental stress cracking;
5. Any combination of the above degradation process; 6. Metal induced degradation [2].
Deterioration of synthetic polymers generally involves changes in the physical and visual appearance of the material and may appear in the following ways [5]: Surface embrittlement, crack formation, yellowing of surface, softening of material, discolouration of surface, charring, delamination and swelling of material. Some common properties, which are often investigated in numerous weathering studies, to determine the amount of degradation in synthetic polymers are:
1. Surface change- most oxidation processes, such as thermo-oxidation and photo-oxidation, take place readily on the surface. This usually results in the formation of cracks which propagates progressively across the surface. Yellowing of the material is also a common parameter used to gauge quickly the degree of degradation due to U.V exposure. A study carried out by Chevali et al.[3] showed that there was a significant increase in the yellowing effect of polypropylene (PP) with increasing exposure duration after 400 hours.
842 formation of these particular chemical compounds is also proposed by RABEK [1]. Additionally, WOO et al. [2] identified the presence of carbonyl groups compounds in photo-degraded nanocomposites specimens using Fourier Transform Infrared spectroscopy (FTIR) and reported an increase in its concentration with increasing exposure time to ultraviolet radiation.
3. Change in molecular weight- Since most types of degradation mechanisms involve chain scission of the polymer backbone into smaller molecules, the overall molecular weight of the polymer will actually decrease. This change in molecular weight is sometimes used as an index to evaluate degradation. 4. Change in mechanical properties- Tensile strength is the most common mechanical property studied with
weathered specimens because it provides important information on whether the weathered specimens will function as intended if a load is applied during their service lifetime. Qayyum and White [6] reported a considerable reduction in tensile strength on weathered polypropylene compounds. Additionally, the same authors observed in another study [7] the presence of brittle layers on polyvinyl chloride (PVC) and Nylon 6,6 weathered specimens which exhibited fracture and ultimate failure during tensile testing. In Mauritius synthetic polymers are becoming very popular for outdoor exposures. Large steel towers for fixing telecommunications antennas, for example, are now being embellished by the use of synthetic polymers to give them a more aesthetically pleasing look.
Deterioration of a polymeric component will not only affect the function and service life of the component but also its aesthetics, in some cases. One common example here is the outdoor plastic furniture which when exposed to sunlight for a very long time degrades in terms of appearance. In the long term, the most common way for polymers to degrade, when exposed outdoors, is through weathering when exposed to the atmosphere. However, degradation of polymers may also occur due to specific conditions such as heat caused by external sources.
Ito and Nagai [8] found that in the Japanese railway fields, polymeric components such as insulation roof sheets, hand straps, or air ducts for instance had an estimated service lifetime of 20 years but the polymeric products were replaced every 5-10 years for reliability. The main degradation factors responsible for the deterioration of these components under conditions in which railway services operated, were reported as mainly in terms of temperature, solar irradiation, presence of chemicals and mechanical vibrations.
In Mauritius, though synthetic polymers are being more commonly used for outdoor applications, no study has been performed to investigate how these materials degrade in the Mauritian atmosphere. In atmospheric corrosion tests, carbon steel samples were exposed outdoors, according to BS EN ISO 8565 [9]. In the exposure racks, nylon 6,6 supports were used to hold the metal samples. During the study, it was observed that the nylon supports had also weathered. Hence, in this study the atmospheric degradation in the nylon supports are investigated to get a better insight into their atmospheric degradation behaviour in the Mauritian atmosphere.
1.1 Corrosivity of the Mauritian atmosphere
843
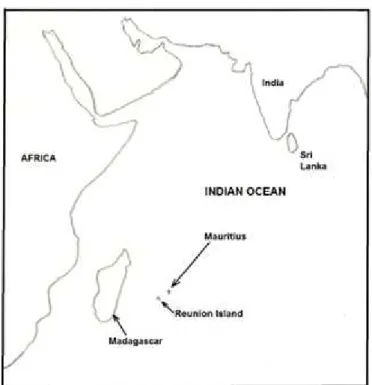
Figure 1: Location of Mauritius in the Indian Ocean.
Figure 2: Mass loss against time of exposure.
To determine the corrosivity of the Mauritian atmosphere, low carbon steel was exposed at several sites in Mauritius, according to BS EN ISO 8565 [9]. The sites included a marine site (Belle Mare), a marine industrial site (Port Louis) and two rural sites (St Julien d’Hotman and Reduit). The results for the mass loss analysis performed according to BS 7545 [10] over 1 ½ years of exposure are shown in Figure 2 [11]. Based on the mass loss analysis, the corrosivity of the atmospheres were determined, according to ISO 9223 [12]. The results are as shown in Table 1. From these results and from results of other researches performed in Mauritius, it is expected that most sites in Mauritius, apart from the capital city (Port Louis), would fall in the corrosivity category C 3 [11]. Hence, in this study, the nylon from corrosivity category C3 sites was chosen for further experimentation and analysis.
0
5
10
15
20
25
0
100
200
300
400
500
600
700
M
as
s
los
s
(g
)
Days of exposure
844
Table 1: Corrosivity category of different sites.
Figure 3: Nylon supports as used in the exposure racks.
2. MATERIALS AND METHODS
The nylon 6,6 test specimens used in this study were initially used to support metal plates in the exposure racks for outdoor exposure of low carbon steel samples as shown in Figure 3. They are of 32 mm diameter and 20 mm in depth.
A total of 56 samples were randomly collected from the exposure racks after 1,1.5, 2, 2.5, 3, 3.5, 4, 4.5 years of exposure. All the specimens removed from category C3 environments, according to ISO 9223 [12], were considered. It should be noted that, Mauritius is a small tropical island of 1865 km2 and the atmospheric corrosivity over the whole island does not vary much and falls in the category C3, apart from the capital city which falls in category C4 [11].
The main aim of this study is to investigate how atmospheric corrosion degradation on nylon 6,6 progresses in the island. This was performed by:
1. Examining the surface of the components to find width, depth and extent of the cracks formed. This was performed through micrometry, using the Nikon ME600 metallurgical microscope, and image analysis, using the ImageJ v1.46r software.
2. Determining the changes in the chemical composition of the nylon 6.6 with time using the FTIR technique.
3. Performing microhardness tests on the samples’ surface.
Site Corrosivity cate-gory
Port Louis C4
St Julien d’Hotman C3
Belle Mare C3
845 2.1 Examining crack formation
2.1.1 Crack width
The crack widths on the surface of each of the test specimens selected were measured using a filar micrometer arrangement connected to the eyepiece of the Nikon Microscope ME600. The average of the 5 largest crack width observed on each nylon sample was determined.
2.1.2 Thickness of degraded layer
The thickness of the degraded layer across each weathered specimen was measured in order to investigate how deep the deterioration has penetrated the material. Each specimen was first sectioned. The cross-sectioned surface of each test specimen was then placed under the optical microscope and the average maximum depth of the degraded layer observed was measured through micrometry.
2.2 Vickers Microhardness
Simultaneously, the variation of the hardness of the samples along their length, perpendicular to the weathered surface was measured. This was performed by cutting the samples along their diameter. The Vickers indenter was used for microhardness testing. Five measurements were taken along the depth of the cut sample at 0.5 mm distance interval, according to ATSM E384- 11e1 [13]. A load of 50 gf was used because higher loads made larger indentation which was out of bounds of the field view for measurement.
Also, the variation of the hardness of the nylon 6,6 samples 0.5 mm from the degraded surface was determined for various time of exposure. This was performed to find out whether the surface hardness varies with time of exposure.
2.3 Use of FTIR
Degradation of a polymer, usually caused by thermo-oxidation and photo-oxidation during weathering, involves a chain reaction involving free radicals, which is followed by the formation of new chemical compounds as products. These degradation products commonly appear as carbonyl groups compounds. By identifying and quantifying the amount of these specific chemical groups in weathered Nylon specimens, it is possible to evaluate the degree of degradation based on this change in chemical structure. The FTIR was used in this study to investigate the change in the chemical structure of the Nylon test specimens due to weathering.
A thin surface layer was cut from each sample for this purpose. 0.0145 g of the cut sample was then dissolved in 2,2,2-Trifluoroethanol (TFE). This solution was then used in the FTIR tests.
3. RESULTS AND DISCUSSIONS
3.1 Visual examination of degraded surfaces
An initial visual examination of the degraded surfaces at both macroscopic and microscopic level revealed a progressive surface change mainly in terms of colour and formation of cracks with increasing time of exposure.
3.2 Discolouration due to weathering
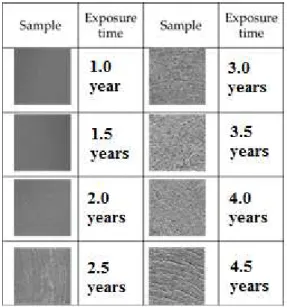
Discolouration of polymer surface was observed with increase in time of exposure. This is usually caused by photo-degradation of the surface upon UV exposure. Figure 4 shows typical progressive surface colour change and degradation observed on the weathered samples’ surfaces. Yellowing or discolouration is a common phenomenon observed during weathering of polymers [3].
3.3 Formation of cracks due to weathering
846
Figure 4: Scanned surfaces of weathered specimens (grayscale).
Figure 5: Typical nylon surface at a magnification of 500X.
Larger cracks on the nylon surface start to appear after 2 years of exposure, as shown in Figure 6, and the degree of crack formation suddenly increase after 2.5 years of exposure. The formation of cracks became more evident as the exposure time increased to 4.5 years. After 2 years of exposure, the average maximum crack width was found to be equal to 25 µm. An average maximum crack width of 85 µm was recorded after 4.5 years of exposure.
847
Figure 6: Cracks formed in the nylon specimens from 2 years to 4 years of exposure.
3.4 Degree of crack formation
3.4.1 Average maximum crack width
The crack width of the samples was measured. The 5 maximum values were considered for analysis. Their average was determined for the various time of exposure of the samples, as shown in Figure 7.
Figure 7: Average maximum crack width against time of exposure.
Cracks were not observed up to 1 year of exposure. As from 1.5 years of exposure, the crack width was found to increase linearly with time. The trendline, as shown in Figure 7, was found to have a coefficient of determination of 0.97. This shows that the results correlate well with the trendline.
3.5 Depth of cracks formed
Figure 8 shows a typical progression of degradation observed across the cross-section of specimens from 1 to 0,0
10,0 20,0 30,0 40,0 50,0 60,0 70,0 80,0 90,0
0,0 1,0 2,0 3,0 4,0 5,0
C
ra
ck
w
id
th
(
u
m
)
848
3.5.1 Years of exposure under an optical microscope
The average values of the maximum depth of cracks observed on the cross-section of the samples specimens are shown in Figure 8.
Figure 8: Cross section of nylon samples after (a) 1.5 years (b) 3 years and (c) 4.5 years of exposure.
From Figure 9, it can be observed that the depth of cracks formed on the surface were not deep for the first 2.5 years of exposure. After this period of exposure, there was a sudden increase in the depth of cracks formed reaching around 750 µm after 4.5 years of exposure.
Figure 9: Graph of average value of maximum depth of cracks against years of exposure.
3.6 Vickers Microhardness
3.6.1 Changes in hardness across the specimens
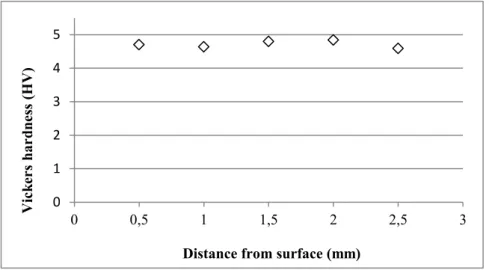
No change in the hardness of nylon was observed along the cross section of the samples, for the first 2.5 years of exposure. A typical graph for one year of exposure is shown in Figure 10.
0 100 200 300 400 500 600 700 800
0 1 2 3 4 5
D
e
p
th
o
f
cr
a
cks
(
u
m
)
Time of exposure (years)
849
Figure 10: Hardness of nylon along the cross section from the surface of the sample, for one year of exposure.
After 2.5 years of exposure, the hardness of the samples near the surface (1 mm from the latter) was found to be lower than that further away from the surface. This is shown in Figure 11. The changes in hardness of the samples are near to the surface, most probably because of the degradation occurs only at the surface.
Figure 11: Hardness of nylon along the cross section from the surface of the sample, for three years of exposure
3.6.2 Changes in hardness with time of exposure
Since the changes in the hardness of the samples are observed on or near the surface, the degradation of nylon outdoors can be considered to affect only the surface. This also confirms the results of the tests performed from the visual analysis. In order to evaluate how the hardness has changed over time on the nylon 6,6 surface which is the most affected region, the hardness of the specimens were measured at a depth of 0.5 mm from the surface.
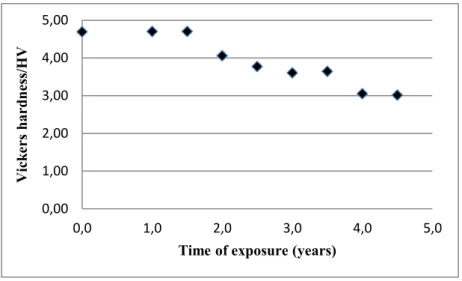
Figure 12 shows the results obtained for the variation of the hardness with increase in time of exposure at 0.5 mm below the degraded surface. From the graph, it can be observed that there is a gradual decrease in the hardness of nylon with increase in time of exposure. The decrease started to become more significant after 2 years of exposure. One possible explanation for this decrease was the fact that the increase in size of the cracks, as discussed previously, caused the formation of cavities within the material. The presence of cracks therefore caused the material to be less resistant to deformation and hence to a decrease in hardness. 0 1 2 3 4 5
0 0,5 1 1,5 2 2,5 3
V ic k er s h a rd n es s (H V )
Distance from surface (mm)
0 1 2 3 4 5 6
0 0,5 1 1,5 2 2,5 3
V ic k er s h a rd n es s (H V )
850
Figure 12: Variation of hardness with time of exposure at 0.5mm from the degraded surface.
3.7 Changes in chemical structure due to weathering
FTIR analysis was performed to monitor the change in chemical structure due to degradation. There is a possibility that photo-oxidation generates degradation products belonging to the carbonyl group. Detecting the presence of this type of chemical group may demonstrate that UV exposure and heat were the main cause of degradation. Figure 13 shows the typical absorbance FTIR spectra for samples exposed for 1 year and 4.5 years.
No evidence of the presence of the carbonyl group was found in the FTIR spectra. Carbonyl group compounds usually absorb infra-red radiation between 1680 – 1750 cm-1
and only the peak due to C=O in the amide bond was observed. However, George and Browne [14] made similar observations when evaluating deterioration of Nylon 6,6 parachutes.
Nevertheless, from Figure 13, it is clear that there is a decrease in the area under the peaks of the samples exposed for 1 year and 4.5 years. The area under the peaks corresponds to the relative concentration of chemical groups and it is evident that the chemical groups found in the sample exposed over 4.5 years have decreased considerably. This decrease is generally caused by the chain scission of the polymer chains upon degradation which is common during photo-oxidation and thermo-oxidation.
Figure 13: FTIR spectra. 0,00 1,00 2,00 3,00 4,00 5,00
0,0 1,0 2,0 3,0 4,0 5,0
V
ic
k
er
s
h
a
rd
n
es
s/
H
V
851 3.8 Weathering of nylon compared to mild steel
In the C3 environment in Mauritius, mild steel degrades linearly with time of exposure for around 28 days [11]. For the medium and long term, it was found that the corrosion trend follows the power law.
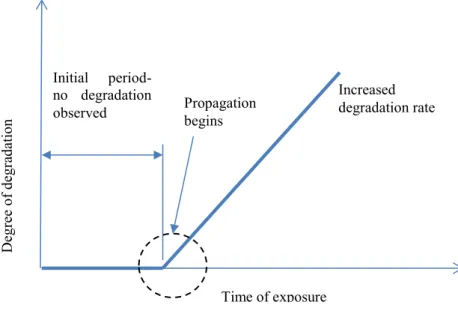
For nylon 6,6, this is not the case. Weathering is not clearly observed in the first two years of exposure. However, after this period nylon degrades at a fast rate with linear increase in surface crack formation.
The degradation of nylon 6,6 in the Mauritian atmosphere can, thus, be represented by Figure 14. This pattern consists of an initial period of time during which no degradation is observed until propagation begins and accelerate the rate of degradation.
Figure 14: Weathering model for nylon.
4. CONCLUSIONS
Hence, in this study, it has been observed that:
1. Most of the physical and mechanical properties investigated changed in a similar pattern with increasing exposure time. This pattern consists of an initial period of time during which no degradation is observed until propagation begins and accelerate the rate of degradation.
2. Visual examination of the surface of the nylon samples showed a progressive discolouration and a sudden increase in the size of the cracks only after 2 years of exposure. The propagation of free radicals attacking the polymers was discussed as a possible explanation for the sudden change observed.
3. The degree of crack formation in terms of crack width and crack area ratio, the depth of degradation and the microhardness of the surface were evaluated and all showed significant degradation after around 2 years of exposure. The degradation occurs on the material’s surface.
4. Degradation has penetrated the test material up to 0.75 mm from the surface after 4.5 years of exposure. This is significant and should be taken into consideration when designing for the outdoor environment. 5. No carbonyl group compounds were found in the weathered samples using FTIR but evidence of chain
scission occurring among the polymer chains was found after investigation of the IR spectrum. Hence, changes in nylon are not only of physical nature but also of a chemical nature.
Nylon 6,6 may be a good alternative to metals in atmospheric exposures. It will resist atmospheric degrada-tion for around two years in a C3 category environment. However, after 2 years, it will degrade gradually and in the long term, it may not necessarily be a reliable material for use as alternative to metals.
Increased degradation rate Initial period-
no degradation
observed Propagation begins
D
eg
re
e
o
f
d
eg
ra
d
at
io
n
852 5. BIBLIOGRAPHY
[1] RABEK, J.F, Polymer photodegradation: mechanisms and experimental methods, 1st ed., London, Chapman & Hall, 1995.
[2] WOO, R.S.C, CHEN, Y., ZHU, H., LI, J., KIM, J.-K., LEUNG, C.K.Y., “Environmental degradation of epoxy-organoclay nanocomposites due to UV exposure. Part I: photo-degradation”, Composites Science and Technology, v. 67, pp3448–3456, 2007.
[3] CHEVALI, V.S., DEAN, D.R., JANOWSKI, G.M., “Effect of environmental weathering on flexural creep behavior of long fiber-reinforced thermoplastic composites”, Polymer Degradation and Stability, v. 95, pp2628-2640, 2010.
[4] MOSES, O.O, “Engineering Materials and the Environment”, Journal of Applied Sciences, v. 2, pp966-69, 2007.
[5] SCHWEITZER, P.A., Corrosion of polymers and elastomers, 2nd ed., Boca Raton: Taylor & Francis Group, 2006.
[6] QAYYUM, M.M., WHITE, J.R., “Effect of filler species on the long term properties of polyproylene compunds: Part 2. Weathering in an extreme hot climate”, Plastics and Rubber Processing and Applications, v. 12, pp171-78, 1989.
[7] QAYYUM, M.M., WHITE, J.R., “Plastic fracture in weathered polymers”, Polymer, v. 28, pp473-74, 1987.
[8] ITO, M., NAGAI, K., “Degradation issues of polymer materials used in railway field”, Polymer Degrada-tion and Stability, v. 93, pp1723-1735, 2008.
[9] BS EN ISO 8565, Metals and alloys: atmospheric corrosion testing. General requirements, 1995. [10] BS 7545, Method of removal of corrosion products from corrosion tests specimens of metals and alloys, 1991.
[11] B.Y.R. Surnam, Atmospheric corrosion of carbon steel in Mauritius, P.hD Thesis, University of Mauri-tius, Maurituus, 2010.
[12] ISO 9223, Corrosion of metals and alloys – classification of corrosivity of atmosphere, 1992. [13] ATSM E384- 11e1, Standard Test Method for Knoop and Vickers Hardness of Materials, 2011.