www.atmos-chem-phys.net/12/2007/2012/ doi:10.5194/acp-12-2007-2012
© Author(s) 2012. CC Attribution 3.0 License.
Chemistry
and Physics
Ionic and carbonaceous compositions of PM
10
, PM
2
.
5
and PM
1
.
0
at
Gosan ABC Superstation and their ratios as source signature
S. Lim1,*, M. Lee1, G. Lee2, S. Kim3, S. Yoon3, and K. Kang4
1Dept. of Earth and Environmental Sciences, Korea University, Seoul, South Korea
2Dept. of Environmental Science, Hankuk University of Foreign Studies, Yongin, South Korea 3School of Earth and Environmental Sciences, Seoul National University, Seoul, South Korea 4College of Ocean Science, Jeju National University, Jeju, South Korea
*now at: Laboratoire de Glaciologie et G´eophysique de l’Environnement (LGGE), CNRS/University of Grenoble,
Grenoble, France
Correspondence to:M. Lee ([email protected])
Received: 26 April 2011 – Published in Atmos. Chem. Phys. Discuss.: 19 July 2011 Revised: 30 January 2012 – Accepted: 2 February 2012 – Published: 21 February 2012
Abstract. PM1.0, PM2.5, and PM10were sampled at Gosan
ABC Superstation on Jeju Island from August 2007 to September 2008. The carbonaceous aerosols were quan-tified with the thermal/optical reflectance (TOR) method, which produced five organic carbon (OC) fractions, OC1, OC2, OC3, OC4, and pyrolyzed organic carbon (OP), and three elemental carbon (EC) fractions, EC1, EC2, and EC3. The mean mass concentrations of PM1.0, PM2.5, and PM10
were 13.7 µg m−3, 17.2 µg m−3, and 28.4 µg m−3,
respec-tively. The averaged mass fractions of OC and EC were 23.0 % and 10.4 % for PM1.0, 22.9 % and 9.8 % for PM2.5,
and 16.4 % and 6.0 % for PM10. Among the OC and EC
sub-components, OC2 and EC2+3 were enriched in the fine mode, but OC3 and OC4 in the coarse mode. The filter-based PM1.0 EC agreed well with black carbon (BC)
mea-sured by an Aethalometer, and PM10EC was higher than BC,
implying less light absorption by larger particles. EC was well correlated with sulfate, resulting in good relationships of sulfate with both aerosol scattering coefficient measured by Nephelometer and BC concentration. Our measurements of EC confirmed the definition of EC1 as char-EC emitted from smoldering combustion and EC2+3 as soot-EC gener-ated from higher-temperature combustion such as motor ve-hicle exhaust and coal combustion (Han et al., 2010). In par-ticular, EC1 was strongly correlated with potassium, a tra-ditional biomass burning indicator, except during the sum-mer, when the ratio of EC1 to EC2+3 was the lowest. We also found the ratios of major chemical species to be a use-ful tool to constrain the main sources of aerosols, by which the five air masses were well distinguished: Siberia, Beijing,
Shanghai, Yellow Sea, and East Sea types. Except Siberian air, the continental background of the study region, Beijing plumes showed the highest EC1 (and OP) to sulfate ratio, which implies that this air mass had the highest net warming by aerosols of the four air masses. Shanghai-type air, which was heavily influenced by southern China, showed the high-est sulfate enhancement. The highhigh-est EC2+3/EC1 ratio was found in aged East Sea air, demonstrating a significant influ-ence of motor vehicle emissions from South Korea and Japan and less influence from industrial regions of China. The high ratio results from the longer residence time and less sensitiv-ity to wet scavenging of EC2+3 compared to EC1, indicat-ing that soot-EC could have greater consequence in regional-scale warming.
1 Introduction
2008 S. Lim et al.: Ionic and carbonaceous compositions of PM10, PM2.5and PM1.0at Gosan
number concentration and cloud lifetime (IPCC, 2007; Hay-wood and Boucher, 2000).
Because the chemical composition and size distribution of aerosols are important in quantifying their radiative effects (Brasseur et al., 1999; Ramanathan et al., 2001; Buzorius et al., 2004), knowledge of the chemical composition of at-mospheric aerosols of a given size is required to assess their impact on the environment. Aerosols are often classified into submicron and supermicron particles; the former are of par-ticular concern to public health and climate change because they mainly originate from anthropogenic sources and inter-act more efficiently with sunlight. Anthropogenic sources contribute almost as much as natural sources to the global aerosol optical depth (AOD) (Hansen et al., 1997; Robertson et al., 2001).
Anthropogenic aerosols are typically composed of various inorganic and organic species (IPCC, 2007), among which sulfate, nitrate, and carbonaceous aerosols including black carbon (BC) and organic carbon (OC) are of major interest due to their atmospheric abundances. In particular, carbona-ceous aerosols are major contributors to fine aerosols smaller than 1 µm and typically constitute a significant, sometimes dominant, fraction of the total fine particle mass of submi-cron particles (Gray et al., 1986; Shah et al., 1986; An-drews et al., 2000; Yang et al., 2005). They are composed of light-absorbing carbon as well as light-scattering carbon. The radiative forcing at the top of the atmosphere is found to change sign from negative to positive when carbonaceous aerosols are abundant over highly reflecting surfaces such as land and snow, which results in higher atmospheric heating (Ramanathan and Carmichael, 2008; Ramachandran et al., 2009).
These carbonaceous aerosols are mainly divided into two categories: elemental carbon (EC), often called BC or soot, and OC. Especially for EC, there are various definitions and analytical methods to quantify its atmospheric concen-tration (Andreae and Gelencs´er, 2006; Han et al., 2010). EC is usually referred to a near-elemental soot-carbon-like composition and to the fraction of carbon that is oxidized in combustion analysis above a certain temperature thresh-old. Soot carbon may be defined as aggregates of spherules made of grapheme layers, consisting almost purely of car-bon, with minor amounts of bound heteroelements, espe-cially hydrogen and oxygen, whereas BC is referred to a black, blackish or brown substance formed by combustion, present in the atmosphere as fine particles. BC generally implies to have optical properties and composition similar to soot carbon. While EC is usually determined by ther-mal methods based on its chemical properties, BC is mea-sured using its optical properties. Therefore, BC and EC may show slightly different concentrations due to their different quantification techniques. EC enters the atmosphere exclu-sively as a primary (i.e. direct particulate) emission origi-nating nearly completely from pyrolysis during incomplete combustion, mainly of biomass and fossil fuel (Nunes and
Pio, 1993; Bond et al., 2007). Because EC is optically ab-sorptive and highly polyaromatic, it has recently been a sub-ject of interest in many studies encompassing local to global scales. In particular, EC (or BC) could be the next most im-portant contributor to global warming, in terms of direct forc-ing, after CO2(Jacobson, 2001; Ramanathan and Xu, 2010).
The surface forcing is about 2–3 times larger than the forc-ing at the top of the atmosphere for absorbforc-ing aerosols such as EC, producing a large atmospheric warming (Ramanathan and Carmichael, 2008).
On the other hand, OC is commonly considered as the non-absorptive fraction of the carbonaceous aerosol. It has more molecular forms and a lower molecular weight than EC. OC is produced from both direct emission and gaseous precursors by atmospheric oxidation or oligomerization (Ja-cobson et al., 2000; Kanakidou et al., 2005; Tsigaridis et al., 2006). The main primary source of OC is combustion along with EC emissions and biogenic emissions. In addi-tion, OC is produced from oxidation of precursor gases in the atmosphere, constituting what is called secondary organic aerosol (SOA). A considerable proportion of organic aerosols is hygroscopic, thereby serving as cloud condensation nu-clei (CCN) along with sulfate aerosols. On the other hand, EC particles are hydrophobic when they are emitted, but the sulfates or water soluble organic compounds (WSOC) that become attached to EC particles can change them from hy-drophobic to hydrophilic, eventually making them efficient CCN (Decesari et al., 2002; Persiantseva et al., 2004; Pet-zold et al., 2005). When EC was coated with reflecting com-pounds like OC, the absorption by EC was found to increase at least by a factor of 1.5 (Bond et al., 2006). In addition, carbonaceous aerosols, when mixed with atmospheric dust, have the potential to influence the atmospheric chemistry of several trace gases such as NO2, O3, and SO2(Dentener et
al., 1996).
Although the definition and measurement techniques for atmospheric EC or BC have long been subjects of scientific controversy, the recent discovery of light-absorbing carbon that is not black but brown (or yellowish) makes it imperative to reassess and redefine the components that make up light-absorbing carbonaceous matter in the atmosphere (Andreae and Gelencs´er, 2006). There has been growing evidence for the contribution of brown carbon to light absorption in atmo-spheric aerosols from chemical aerosol measurements and laboratory studies (Mukai and Ambe, 1986; Havers et al., 1998; Hoffer et al., 2006; Alexander et al., 2008; Park et al., 2010).
radiative effect. In particular, Asia is the main source of global anthropogenic aerosol emission. At present, anthro-pogenic emissions of gaseous pollutants in Asia are larger than those in Europe and North America and will continue to increase in the future (Akimoto, 2003). An emission inven-tory study in Asia suggests that 30–60 % of the total emission of aerosol gaseous precursors and primary BC and OC are emitted in China (Streets et al., 2003), in particular,∼41 % of submicron BC. The recently documented linear increase of primary BC and OC between 1850 and 2000 highlights the importance of continuous measurements of carbonaceous particles (Bond et al., 2007). Additionally, the frequent pres-ence of desert dust makes the East Asian atmosphere more complex because of both scattering of sunlight and absorp-tion of radiaabsorp-tion (Huebert et al., 2003).
In recent decades, carbonaceous aerosols, both EC and OC, have been measured in many regions of Northeast Asia, including South Korea, China, and Japan (Ohta et al., 1998; Kim et al., 2000; He et al., 2001; Park et al., 2001; Ye et al., 2003; Cao et al., 2005; Hagler et al., 2006; Lee et al., 2007, 2008; Shen et al., 2007; Zhang et al., 2007; Moon et al., 2008; Aggarwal and Kawamura, 2009; Lee et al., 2009). The areas covered have included urban areas (He et al., 2001; Park et al., 2001; Ye et al., 2003; Zhang et al., 2007; Lee et al., 2009), developing regions (Hagler et al., 2006), and sandlands (Cao et al., 2005; Shen et al., 2007). Most of these studies focused on PM2.5 through a year (He et al.,
2001; Ye et al., 2003) and PM2.5or PM10 during a specific
season, such as spring (Lee et al., 2007; Shen et al., 2007), spring and early summer (Aggarwal and Kawamura, 2009), fall and winter (Cao et al., 2005) , or winter (Zhang et al., 2007). There have been few year-round studies of both fine and coarse aerosols, particularly at a site where it is feasi-ble to monitor long-range transport and the atmospheric pro-cesses involving air pollutants emitted from the Asian conti-nent. This limitation hinders the full characterization of car-bonaceous aerosols in Northeast Asia.
In the present study, we measured soluble ionic species, OC, and EC in PM1.0, PM2.5, and PM10 at Gosan ABC
Superstation on Jeju Island throughout the year from Au-gust 2007 to September 2008. The main objective was three-fold: (1) to better understand the variability of major PM components, particularly OC and EC, of both fine and coarse aerosols; (2) to identify the sources of these components; and finally (3) to examine the relationships between chem-ical compositions and optchem-ical properties.
2 Measurement
PM1.0, PM2.5, and PM10 were measured at Gosan
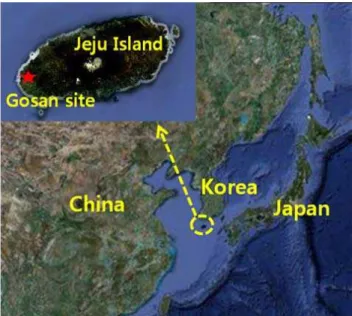
ABC Superstation on Jeju Island during August 2007– September 2008. Gosan station (33.17◦N, 126.10◦E, 70 m a.s.l., Fig. 1) served as a base for the ACE-Asia ex-periment in 2001 and was designated as one of the ABC
Su-Fig. 1. Map showing Gosan ABC superstation (33.17◦N, 126.10◦E, 70 m a.s.l.) from Google mapmaker (http://www.google. com/mapmaker). The station is located on the west coast of Jeju Is-land, South Korea.
perstations (Lee et al., 2007). It has been considered to be an ideal location to monitor Asian outflows and assess their impact on air quality over the northern Pacific (Carmichael et al., 1996, 1997; Chen et al., 1997).
In the present study, the concentrations of water-soluble inorganic ions, EC, OC, and mass in PM1.0, PM2.5, and PM10
were measured for about one year. Ambient air was collected through PM1.0, PM2.5, and PM10 sharp-cut cyclone coated
with Teflon (URG, USA) at 16.7 LPM, and cumulative flow was measured with a dry gas-meter. These low-volume sam-plers were installed at the top of a 10-m tower. Particles were collected on pre-weighed 37-mm Teflon filters for mass and ion analysis, and on pre-heated 37-mm quartz-fiber filters (Pall corp., USA) for carbon analysis.
Sampling was conducted usually once every six days. It started at 09:00 LST and lasted for 24 h. There was less num-ber of samples collected during summer and winter monsoon periods because of rain, snow, or strong wind. With addi-tional samples during particular events such as Asian dust and pollution plumes, a total of 41 sets of samples were taken for this study (Table 1).
Eight species of water-soluble ions, which included SO24−, NO−3, Cl−, NH+
4, K+, Na+, Ca2+, and Mg2+, were
2010 S. Lim et al.: Ionic and carbonaceous compositions of PM10, PM2.5and PM1.0at Gosan
Table 1.The number of sample sets of PM10, PM2.5, and PM1.0taken from August 2007 to September 2008.
Year 2007 2008
Month Aug Oct Nov Dec Jan Feb Mar Apr May Jun Aug Sep total
No. 1 5 4 2 5 3 4 8 4 1 2 2 41
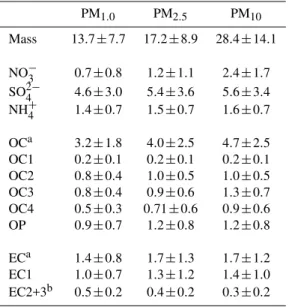
Table 2.Averaged concentrations of mass and major compositions of PM1.0, PM2.5, and PM10.
PM1.0 PM2.5 PM10
Mass 13.7±7.7 17.2±8.9 28.4±14.1
NO−3 0.7±0.8 1.2±1.1 2.4±1.7
SO24− 4.6±3.0 5.4±3.6 5.6±3.4
NH+4 1.4±0.7 1.5±0.7 1.6±0.7
OCa 3.2±1.8 4.0±2.5 4.7±2.5
OC1 0.2±0.1 0.2±0.1 0.2±0.1
OC2 0.8±0.4 1.0±0.5 1.0±0.5
OC3 0.8±0.4 0.9±0.6 1.3±0.7
OC4 0.5±0.3 0.71±0.6 0.9±0.6
OP 0.9±0.7 1.2±0.8 1.2±0.8
ECa 1.4±0.8 1.7±1.3 1.7±1.2
EC1 1.0±0.7 1.3±1.2 1.4±1.0
EC2+3b 0.5±0.2 0.4±0.2 0.3±0.2
All concentrations are given as mean±standard deviation in µg m−3.
aOC is the sum of OC1, OC2, OC3, OC4, and OP, and EC is the sum of EC1, EC2, and EC3. See the measurement section for the definition of each sub-component. OC1, OC2, OC3, and OC4 are fractions of OC liberated at different temperatures: 120◦C, 250◦C, 450◦C, and 550◦C, respectively. Some OC is charred during the gradual in-crease in temperature and is defined as OP (pyrolyzed organic carbon). EC1, EC2, and EC3 are carbon fractions evolved under an O2atmosphere at 550◦C, 700◦C, and 800◦C, respectively, after OC/EC split.
bIn this study, the mean EC2+3 of PM
1.0(0.46) was a little higher than that of PM2.5 (0.40) and PM10(0.30). It is likely associated with the amount of catalytically active ions (Han et al., 2009a) and mineral oxides (Fung, 1990; Novakov and Corrigan, 1995; Elmquist et al., 2006). In particular, the presence of these components in coarse par-ticles may lead to a catalytically mediated lowering of the activation energy for soot oxidation but not for char (Elmquist et al., 2006).
liberated in an oxygen-free environment until a temperature of>600◦C is attained, allowing it to be separated from the more volatile OC that evolves at lower temperatures. Eight fractions of carbon, including four fractions of OC (at 120◦C for OC1, at 250◦C for OC2, at 450◦C for OC3, and at 550◦C for OC4 in a He atmosphere), three fractions of EC (at 550◦C for EC1, at 700◦C for EC2, and at 800◦C for EC3 in a 2 % O2/98 % He atmosphere), and OP, pyrolyzed (or charred)
OC, were determined by this analysis method. OP is mea-sured after the introduction of a He/O2atmosphere but before
reflectance or transmittance returns to its initial value (Chow et al., 2005).
Cut off
PM1.0 PM2.5 PM10
C
onc
e
nt
ra
ti
on (
µ
g
/m
3 )
0 5 10 15 20 25 30
Mass EC OC IONs
Fig. 2. Mean concentrations of mass, water-soluble ions, EC, and OC in PM1.0, PM2.5, and PM10. Ions include SO24−, NO−3, and Cl−for anions and NH+4, K+, Na+, Ca2+, and Mg2+for cations.
In conjunction with chemical composition, BC concentra-tion was determined by absorpconcentra-tion at 7 wavelengths, 370, 450, 520, 590, 660, 880, and 950 nm, using an Aethalometer (AE-31, Magee Scientific Corp., USA) every 10 min. Scat-tering coefficients were obtained at 450 nm, 550 nm, and 700 nm by a Nephelometer (model 3563, TSI Inc., USA) ev-ery 10 min. For these measurements, ambient air was pulled through a sampling manifold without cut-points. These op-tical measurement data are available since January 2008. Gaseous pollutants, including O3, NO2, CO, and SO2, and
a meteorological suite were measured hourly by the National Institute of Environmental Research (NIER) and the Korea Meteorological Administration (KMA), respectively. These data were averaged hourly or daily for comparison with the chemical composition data.
3 Results and discussion
3.1 Size-fractionated ionic and carbonaceous compositions
The daily concentrations of PM1.0, PM2.5, and PM10varied
between 1.3 and 29.5 µg m−3, 3.9 and 39.2 µg m−3, and 7.5
1 PM1.0 PM2.5 PM10
TC / Mass
0.0 0.2 0.4 0.6 0.8 1.0
PM1.0 PM2.5 PM10
OC / Ma ss 0.0 0.2 0.4 0.6 0.8 1.0
PM1.0 PM2.5 PM10
EC / Mass 0.0 0.2 0.4 0.6 0.8 1.0
PM1.0 PM2.5 PM10
Nitrate / Mass 0.0 0.2 0.4 0.6 0.8 1.0
PM1.0 PM2.5 PM10
S u lf at e / Mas s 0.0 0.2 0.4 0.6 0.8 1.0
PM1.0 PM2.5 PM10
C a lc ium / M a s s 0.00 0.01 0.02 0.03 0.04 0.05
PM1.0 PM2.5 PM10
OC / TC
0.0 0.2 0.4 0.6 0.8 1.0
PM1.0 PM2.5 PM10
EC / TC 0.0 0.2 0.4 0.6 0.8 1.0 (a) (b) (d) (c) (e) (f) (g) (h) 2 PM1.0 PM2.5 PM10
OC1/ TC 0.0 0.1 0.2 0.3 0.4 0.5
PM1.0 PM2.5 PM10
OC2/T C 0.0 0.1 0.2 0.3 0.4 0.5
PM1.0 PM2.5 PM10
OC 3/ T C 0.0 0.1 0.2 0.3 0.4 0.5
PM1.0 PM2.5 PM10
OC 4/ T C 0.0 0.1 0.2 0.3 0.4 0.5
PM1.0 PM2.5 PM10
OP /T C 0.0 0.1 0.2 0.3 0.4 0.5
PM1.0 PM2.5 PM10
EC1/TC 0.0 0.1 0.2 0.3 0.4 0.5
PM1.0 PM2.5 PM10
E C 2+3 / TC 0.0 0.1 0.2 0.3 0.4 0.5 (i) (j) (k) (l) (m) (n) (o)
Fig. 3.Ratios of each chemical component to mass or total carbon (TC = OC + EC) in PM1.0, PM2.5, and PM10:(a)total carbon-to-mass, (b)OC-to-mass,(c)EC-to-mass,(d)nitrate-to-mass,(e)sulfate-to-mass,(f)calcium-to-mass,(g)OC-to-TC,(h)EC-to-TC,(i)OC1-to-TC, (j)OC2-to-TC,(k)OC3-to-TC,(l)OC4-to-TC,(m)OP-to-TC,(n)EC1-to-TC,(o)EC2+3-to-TC. Total Carbon (TC) is the sum of OC and EC, which are the sum of 5 sub-components (OC1, OC2, OC3, OC4, and OP) for OC and 3 components (EC1, EC2, and EC3) for EC (Han et al., 2007, 2010). OP stands for pyrolyzed organic carbon. Solid and blue dotted lines within the box denote the median and the mean value, respectively, and the box represents the 25th and 75th percentiles. Whiskers above and below the box indicate the 90th and 10th percentiles, and solid circles are outliers corresponding to 5th and 95th percentiles of the data.
were 13.7 µg m−3 for PM1.0, 17.2 µg m−3 for PM2.5, and
28.4 µg m−3 for PM10(Fig. 2 and Table 2), suggesting that
the daily mass well represented episodic events associated with pollution and dust plumes. Caution needs to be ex-erted when comparing these values with annual mean be-cause there is relatively less number of samples during sum-mer and winter monsoon periods. The noticeable feature was a large fraction of PM1.0against PM10 (48.4 %) and against
PM2.5(60.8 %) on average. PM2.5accounted for 79.6 % of
PM10.
In particulate matter of all sizes, the most abundant con-stituents were water-soluble ions, which were followed by OC and EC (Fig. 2). We did not convert OC to OM, and the following discussion is pertinent only to OC. The con-centrations of ions were almost twice as high as those of OC, and OC was nearly two times higher than EC. The average mass fractions of ions, OC, and EC were 53.9 %, 23.0 %,
and 10.4 % for PM1.0, 52.4 %, 22.9 %, and 9.8 % for PM2.5,
and 43.4 %, 16.4 %, and 6.0 % for PM10, revealing that
car-bonaceous compounds were the most abundant in PM1.0and
PM2.5. A considerable fraction of mass other than
water-soluble ions, OC, and EC was possibly due to major, minor, and trace metals, including silica, which were not measured (Moon et al., 2008).
The ratios of OC/EC were 2.2, 2.3, and 2.8 for PM1.0,
PM2.5, and PM10, respectively. These mean OC/EC ratios
were much lower than those measured at the regional back-ground (RB) site in Western Mediterranean (∼11 for PM2.5)
(Pey et al., 2009) and at two RB sites in western China (∼12 for PM10)(Qu et al., 2009), and still lower than those of
2012 S. Lim et al.: Ionic and carbonaceous compositions of PM10, PM2.5and PM1.0at Gosan
3
Month
1 2 3 4 5 6 7 8 9 10 11 12
Win
d
sp
eed
(
m
/s)
2 4 6 8 10 12 14
R
e
lat
iv
e
humidit
y
(
%
),
T
e
mp
er
at
u
re (
oc)
0 20 40 60 80 100
W
ind d
ir
e
c
tion mode
NW SE NE
Wind speed Temperature Relative humidity Wind direction mode
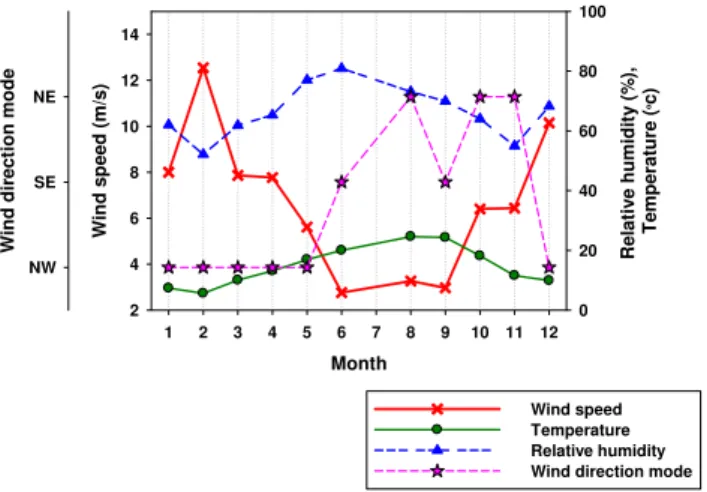
Fig. 4. Monthly variations of meteorological parameters includ-ing temperature, relative humidity, wind speed, and wind direction. Wind direction is represented as a mode divided into 8 from N to NW for 1-h data, and the wind mode in this study includes NE, SE, and NW.
emissions near Gosan station, its EC level is relatively higher than those of above RB sites because it is under direct influ-ence of the northeast Asian outflows. Beijing and Shanghai are the main source regions of anthropogenic emissions af-fecting Gosan aerosols, which will be further discussed in Sect. 3.4. Therefore, the low OC/EC ratio in this study area likely indicates the effect of long range transport of urban plumes from China.
The distributions of TC/mass, OC/mass, and EC/mass among particle sizes were very similar, increasing with de-crease in particle diameter (Fig. 3a, b, and c). The trends imply substantial anthropogenic influence and atmospheric processing such as condensation, gas-to-particle conversion, or surface-limited oxidation processes. With the low OC/EC ratio most of OC is anthropogenic. Additionally, EC/mass distributions were slightly sharper than OC/mass with de-crease in particle size, indicating a larger contribution of EC to fine particles. For water-soluble ions, sulfate was the most abundant single species, and its concentration was comparable to that of TC, accounting for 20∼30 % of the mass (Fig. 3e). Also, the sulfate-to-mass ratio was found to be slightly more shifted toward PM1.0 than was the
TC-to-mass ratio, while being similar in size distribution. This shift is probably due to a large amount of non-sea-salt sulfate (nss-SO24−)originating from anthropogenic sources, which contributed about ∼75–99 % of total sulfate aerosols, and is dependent on gas-to-particle conversion processes. The concentrations of none-sea-salt components were calculated from the measured sodium concentrations and the ratio of the component to sodium in seawater.
In contrast to the carbonaceous aerosols and the sulfate, significant differences in size distributions were observed for calcium and nitrate (Fig. 3d and f). These species were much
higher in PM10 than in the other size fractions. In the case
of nitrate, the next most abundant species among the water-soluble ions, this is due to its chemical and physical charac-teristics, especially its volatility. Ammonium nitrate, being more volatile than ammonium sulfate, will tend to evaporate from smaller particles and yield gaseous nitric acid which reacts onto coarser particles. Ammonium sulfate, being es-sentially non-volatile, has a size distribution controlled by gas-phase diffusion and will tend to accumulate in small par-ticles (Bassett and Seinfeld, 1984). For calcium, its main sources are soils and sea salt in general; however, the soil-derived calcium would be a more abundant component of to-tal calcium in the present study because non-sea-salt-calcium (nss-Ca2+)accounts for∼43–97 % of the total calcium in all particle sizes. In previous studies, it has been suggested that nitrate is formed through heterogeneous reactions including nitrogen oxides and by absorption of nitric acid on the sur-face of soil particles (Mamane and Gottlieb, 1989; Zhang et al., 1994). At the Gosan station, the correlation between ni-trate and calcium in PM10was significant (R2=0.51) for all
measurements, including the high PM10 episodes that were
affected by Asian dust event. The correlation implies that there is a mineral affinity of nitrate in coarse mode parti-cles and that some of the nitrate could have been formed on dust particles enriched with calcium. In fact, there have been intensive studies on the link between anthropogenic nitrate or sulfate and mineral constituents of Asian dust (Wang et al., 2007; Lin et al., 2007; Geng et al., 2009) and Saharan dust particles (Talbot et al., 1986; Mace et al., 2003; Koc¸ak et al., 2007). Particularly, Geng et al. (2009) reported that the nitrate-containing secondary soil-derived particles were markedly increased in coarse mode during Asian dust period. Asian dust was also suggested to provide a removal mecha-nism for NOx(or HNO3)and perhaps contribute to nitrogen
4
PM1.0
Spring Summer Fall Winter
Ma
ss
fra
c
tion
(%)
0 20 40 60 80 100
PM2.5
Season
Spring Summer Fall Winter PM10
Spring Summer Fall Winter Mass concentration
(
μ
g m
-3 )
0 10 20 30 40
OC EC nitrate sulfate Mass
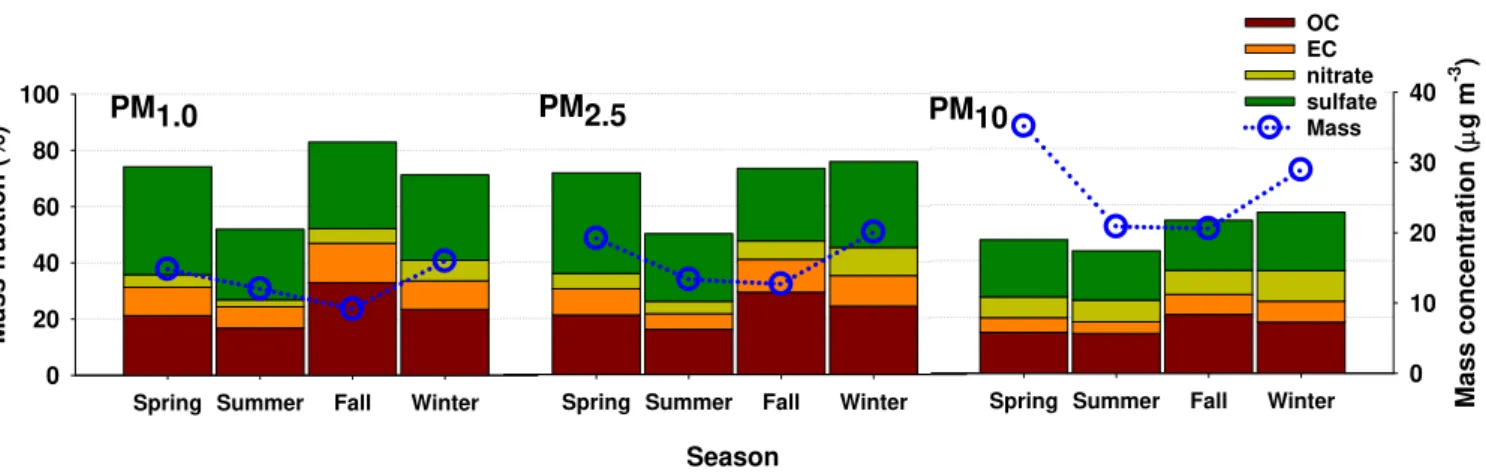
Fig. 5.Seasonal variations of mass concentrations (blue circle) and fractions of OC, EC, nitrate, and sulfate against mass in PM1.0, PM2.5, and PM10. Spring, summer, fall, and winter include March to May, June to early September, October to November, and December to February, respectively.
aerosol particles with larger surface-to-volume ratios than larger particles (Maria et al., 2004). Although EC is mixed with organic compounds in the atmosphere, surface-limited oxidation may easily occur because organic compounds of-ten have efficient surface reactivity (Maria et al., 2004; Rus-sell et al., 2002). In the case of OC, interestingly, the OC/TC ratio was highest in the coarse mode and lowest in PM1.0.
The OC enrichment in coarse mode could be attributed to the formation of secondary organic aerosols (SOA) and sub-sequent increase in size during aging processes (Liu et al., 2009). The relatively higher OC/EC ratio (2.5 for PM2.5and
3.3 for PM10)in spring and summer implies SOA formation
at higher temperature, even though OC concentrations were lower than those in winter. Mochida et al. (2007) performed size-segregated aerosol measurements off the coast of East Asia and found a high OC proportion in the supermicron mode of up to 61 %, suggesting primary emission of organ-ics associated with sea salt and dust particles or other primary sources (e.g. plant waxes, soil-derived microbes, and anthro-pogenic particles). In this measurement, a similar behavior of OC and EC was observed during an Asian dust event in May 2008 (Lim et al., 2010a, b), in which the ratio of OC to EC was raised in dust-laden air possibly due to the impact of dust-related primary OC. Therefore, it is suggested that there was a considerable contribution of primary OC as well as SOA to total OC concentration particularly in the present study.
The ratios of OC and EC subcomponents to TC (Fig. 3i–o) were divided into three types. The first group includes OC1, OP, and EC1, whose ratios against TC did not show a clear tendency to vary with particle size (Fig. 3i, m, and n). OC1 may represent semi-volatile organic carbon because OC1 not only is the first carbon evolved at the lowest temperature but also is observed to be the most abundant and variable in con-centration among the 5 OC fractions in our blank filters. OP is a measure of pyrolyzed organic carbon, and its
character-istics are well described by Andreae and Gelencs´er (2006), who explained that OP can be released as a gas or in solid form and become associated with submicron or supermicron particles. Similarly, EC1 was defined as char EC (Han et al., 2010), and a detailed discussion of EC1 is given in Sect. 3.3. The second group includes OC2 and EC2+3, whose ratios to TC were enhanced in the smaller size particles (Fig. 3j and o). This enhancement strongly supports the view that a con-densation process or surface-limited oxidation was involved in the formation of OC2 and EC2+3. Particularly, OC2 is thought to be a secondary organic carbon, which will be fur-ther discussed in Sect. 3.4. In contrast to OC2, the fractions OC3 and OC4 clearly increased with increasing particle size (Fig. 3k and l), and their concentrations were also higher in PM10than in PM1.0, suggesting the characteristic of primary
aerosols.
3.2 Seasonal patterns
The monthly variations of meteorological parameters in-clude those of temperature, which varied between 4.4◦C and 25.8◦C, and relative humidity, which ranged from 37.2 % to 87.6 % over the whole period, showing distinct seasonal pat-terns. The mode of wind direction in degrees from 0◦to 360◦ was chosen for each month and categorized into eight groups from N to NW. Throughout the winter and the spring, the prevailing wind was northwesterly under the influence of the winter monsoon over East Asia, with high wind speeds up to 13 m s−1, suggesting a greater influence during that period from Asian continental outflows. With the arrival of sum-mer, the wind direction was shifted to easterly with lower wind speeds below 3 m s−1, indicating reduced continental
outflows (Kim et al., 2007).
2014 S. Lim et al.: Ionic and carbonaceous compositions of PM10, PM2.5and PM1.0at Gosan
(a)
5
Aethalometer 880 nm BC (μg/m3)
0 1 2 3 4
EC
(
μ
g
/
m
3 )
0 1 2 3 4 5 6
PM10 EC, slope=1.5 , R2=0.95
PM1.0 EC, slope=1.0, R2=0.92
μ
μ
(b)
5
μ
μ
/
PM1.0 sulfate (μg/m
3 )
0 2 4 6 8 10 12 14
PM
1.
0
EC
(
μ
g/
m
3 )
0 1 2 3 4
R2=0.59
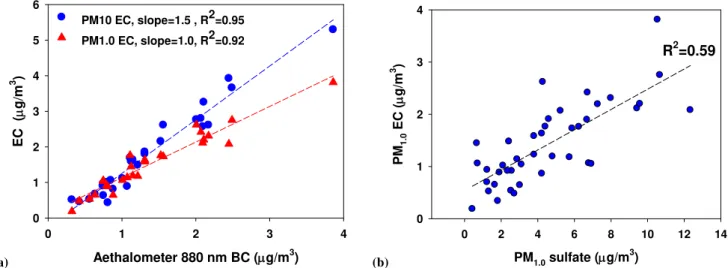
Fig. 6. Correlations of(a)BC measured by Aethalometer at 880 nm with EC in PM1.0and PM10and(b)sulfate with EC in PM1.0. The Aethalometer acquires data at seven wavelengths from the ultraviolet to near-infrared: 370, 470, 520, 590, 660, 880, and 950 nm. BC concentrations were averaged for 24 h in accordance with collection duration for filter samples. The dotted lines represent linear regression fits, for whichR2values are given.
Table 3.Correlation coefficients of absorption and scattering prop-erties of aerosols with EC and sulfate concentrations in PM1.0.
PM1.0EC PM1.0sulfate
Aethalometer BC (520 nm)a 0.94 0.64
Scattering coefficient (550 nm)b 0.73 0.79
aAethalometer acquires data at seven wavelengths: 370, 470, 520, 590, 660, 880, and 950 nm.
bNephelometer acquires data at three wavelength: 450, 550, and 700 nm.
during winter at 16.3 µg m−3and 20.3 µg m−3, respectively, followed by spring, when the highest seasonal PM10 was
observed (35.2 µg m−3). The enhanced mass concentrations were associated with anthropogenic sources, mostly from the Asian continent during the winter monsoon season and with Asian dust events in the spring. The lowest mass concentra-tions at all sizes were due to frequent rain and small conti-nental effects during the summer season (Lim et al., 2010a, b). While sulfate was most abundant during spring with a fraction of 20–38 %, nitrate was the highest during winter, with a fraction of 7–11 %. The occurrence of the highest sulfate fraction in spring compared with other seasons was due to the combination of enough SO2sources mainly from
Asian continent and favorable ambient conditions for con-verting SO2 to sulfate. In summer, on the other hand,
sul-fate concentrations were low because of the lowest SO2
con-centrations below 1.0 ppbv even under favorable conditions for sulfate conversion and wet removal of precursor gases and particles. Seasonal nitrate levels were inversely related to ambient temperature, being highest in winter at 7–11 %, moderate in spring and fall at 5–9 %, and lowest in summer at 3–8 %.
In this study, carbonaceous fractions were higher in sum-mer and fall under low mass and sulfate concentrations but lower in winter and spring under high mass and sulfate con-centrations. Particularly, the OC and EC fractions of PM1.0
were highest in fall. It is likely due to biomass burning from local farmlands and nearby continents as well. In spring, biomass burning also takes place but its effect is diluted by high anthropogenic emissions of sulfur and nitrogen.
3.3 Characteristics
The EC was compared with BC measured by Aethalometer (Fig. 6a). In contrast to EC quantification by thermochemi-cal analysis, BC concentration was obtained by optithermochemi-cal analy-sis, which estimates light absorption of particles and converts it into mass concentration using a mass specific attenuation cross-section of 16.6 m2g−1at 880 nm (Magee BC calibra-tion, Hansen, 2005). The slope of the regression equation of PM1.0EC against BC at 880 nm was 1.0, whereas the slope
for PM10 EC against BC was 1.5. This result implies that
mass absorption efficiency is higher for smaller particles and that the greater fraction of coarse EC may not absorb as much BC as fine EC does.
Aethalometer (Table 3). EC was also well correlated with scattering efficiency and BC. It has been shown that more hy-groscopic particles, such as sulfate of a given size, will grow more under humid conditions, scattering more incident light (Jimenez et al., 2009). Other studies have reported Mie cal-culations of soot particles with sulfate coatings showing en-hanced absorption (Martins et al., 1998; Fuller et al., 1999). These results suggest a positive contribution of sulfate coat-ings to net warming.
EC is not a single chemical compound. It can be subdi-vided into two classes based on our analytical method: char-EC and soot-char-EC (Han et al., 2007, 2010). Char was de-fined as carbonaceous material obtained by heating organics and formed directly from pyrolysis or as an impure form of graphitic carbon obtained as a residue when carbonaceous material is partially burned or heated with a limited supply of air. Soot was defined as only those carbon particles that form at high temperature via gas-phase processes. Previous studies showed that char and soot had different chemical and physical properties (Kuhlbusch, 1997; Masiello, 2004), as well as optical properties (Bond, 2001; Bond et al., 2002; Kirchstetter et al., 2004). We adopted the operational def-initions of EC fractions that Han et al. (2010) suggested to demonstrate the different characteristics of char and soot, based on their previous lab experiment (Han et al., 2007). Their experiment result supported the use of the TOR method to discriminate between char- and soot-EC. The activation energy was lower for char- than soot-EC; char materials al-ways oxidized at low-temperature (550◦C, at EC1 stage), while Diesel and n-hexane soot samples exhibited similar EC2 peaks (at 700◦C) and carbon black samples peaked at both EC2 and EC3 (800◦C). In our study, therefore, char-EC and soot-EC are operationally defined as EC1 and as EC2+3, respectively. In the present work, the mean EC1 concentra-tions were almost two times higher than the mean EC2+3 concentrations for all size cuts, ranging from 0.96 µg m−3to 1.39 µg m−3 for EC1 and from 0.30 µg m−3to 0.46 µg m−3 for EC2+3.
We compared the relationships between EC1 and EC2+3 in the different seasons. They showed the strongest correla-tion in winter and spring (R2=0.4–0.6 for PM1.0, PM2.5,
and PM10), which suggests common combustion sources
such as biomass burning, residential heating, and coal com-bustion. In contrast, they were poorly correlated in sum-mer (R2=0.03–0.2 for PM1.0, PM2.5, and PM10), which
was likely due to reduced sources, particularly from biomass burning and residential heating. Furthermore, the overall cor-relation between EC1 and EC2+3 was better in PM10rather
than PM1.0. This seems to be associated with particle size:
EC1 has larger size (∼1–100 µm) than EC2+3, which is emit-ted as gas or smaller particles (∼hundreds of nm).
Although, generally, the concentration of aerosols in the study area is mainly determined by emissions from the Asian continent, transport processes and wet scavenging have an effect on the level of each aerosol component. Here, we
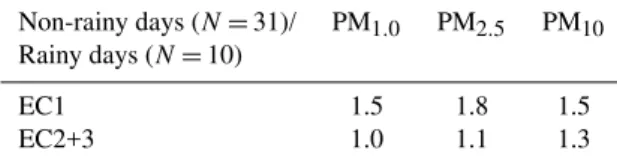
ex-Table 4.The ratios of EC1 and EC23 concentrations for non-rainy days to those for rainy days in PM1.0, PM2.5, and PM10.
Non-rainy days (N=31)/ PM1.0 PM2.5 PM10 Rainy days (N=10)
EC1 1.5 1.8 1.5
EC2+3 1.0 1.1 1.3
amined the impact of precipitation on the mass difference between EC1 and EC2+3 using the ratio of the concentra-tion during non-rainy days (31 days) to the concentraconcentra-tion during rainy days (10 days) (Table 4). EC2+3 showed lit-tle wet scavenging effect with a ratio of 1.0∼1.3. On the other hand, EC1 had a difference in concentration between non-rainy and rainy days. These results imply a longer res-idence time of EC2+3 in the atmosphere, meaning that soot aerosols are suspended and transported longer. In general, since char-EC is composed of large particles (>∼1 µm) as well as small particles, it could be easily removed by wet deposition. Soot, consisting of submicron particles of grape-like clusters, may have an atmospheric lifetime of a month (Ogren and Charlson, 1983) and has strong light absorption characteristics with little spectral dependence (Schnaiter et al., 2003; Kirchstetter et al., 2004). Thus soot could have greater consequence for warming.
2016 S. Lim et al.: Ionic and carbonaceous compositions of PM10, PM2.5and PM1.0at Gosan
6
Season
Winter Spring Summer Fall
PM
1.
0
E
C
2+
3/EC
1
0.0 0.5 1.0 1.5
Season
Winter Spring Summer Fall
PM
10
E
C
2+3/EC1
0.0 0.5 1.0 1.5
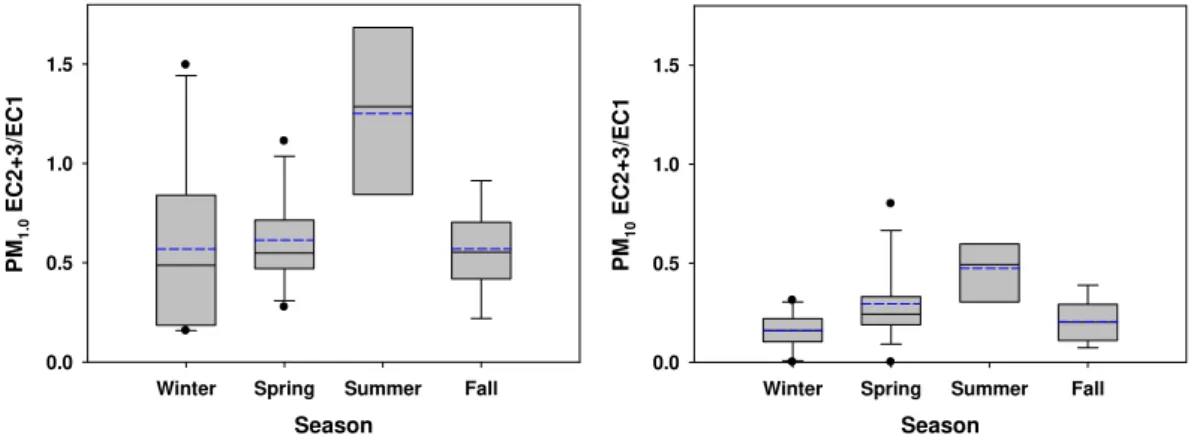
Fig. 7.Seasonal variations of soot-EC to char-EC in PM1.0and PM10. See Fig. 3 for the detailed explanation of box and whisker plot.
7
PM10
EC1
0 1 2 3 4 5 6
Winter: slope=0.19, R2=0.84
Spring: slope=0.16, R2
=0.79
Summer: slope=0.11, R2
=0.60 Fall: slope=0.13, R2
=0.59
PM1.0
EC1
0.0 0.5 1.0 1.5 2.0 2.5 3.0 3.5
Po
tassiu
m
0.0 0.2 0.4 0.6 0.8 1.0
Winter: slope =0.21, R2 =0.80 Spring: slope=0.25, R2=0.79
Summer: slope=0.07, R2=0.27
Fall: slope=0.19, R2=0.76
Fig. 8.Correlations of EC1 with potassium for PM1.0and PM10in each season. Lines stand for linear regression fittings, for which slopes andR2values are given.
a sandland in China, of which result were consistent with our observation that EC1 had a minimum level in summer, but in contrast to our observations, the level of EC2+3 was also minimum in summer. Higher EC2+3 concentrations during summer in our data imply increased influence of South Korea and Japan on EC concentrations. Hence, EC2+3 is consider-ably enhanced, but EC1 is markedly less because of limited contact with industrial regions in China. In other study by Han et al. (2009b) that measured PM2.5 EC in 14 Chinese
cities during summer and winter period, the lower ratios of EC2+3/EC1 were found at the sites associated with indus-tries in the Eastern coastal region of China, while the oppo-site trend was observed at the oppo-sites in Northern and Southern China with the least industrial effect. Therefore, our study supports the classification of char-EC and soot-EC proposed by Han et al. (2010), and the ratio of EC2+3 to EC1 can serve as an indication of a continental effect. This result agrees well with air mass trajectories, which will be discussed in the following section. For example, the EC2+3/EC1 ratios for the days shown in Fig. 9 are (a) 0.96, (b) 0.17, (c) 0.32, (d) 0.47, and (e) 1.79.
Except for summer, EC1 was closely correlated with potassium, which, among the water-soluble ions, is tradition-ally well known as an indication of biomass burning (Silva et al., 1999; Guazzotti et al., 2003). Because char-EC has a wide variety of sources and its concentration itself does not provide accurate information about the source, this approach can suggest the contribution of biomass burning to EC1 concentration in different seasons. For the whole measure-ments, non-sea-salt potassium (nss-K+)accounted for∼50– 99 %, which could be associated with mineral dust as well as combustion aerosols. In PM10, nss-K+ was well
corre-lated with nss-SO24−(R2=0.70), but moderately correlated
with nss-Ca2+ (R2=0.53). In addition, nss-K+ and nss-SO24−showed similarity in size distribution of being enriched in fine mode. Among OC sub-components, OC2, thought to be secondary, was significantly correlated with sulfate and potassium. In the airborne measurements of trace ele-ments produced from savanna biomass burning, Gaudichet et al. (1995) indicated that near the emission, K was mainly present as KCl, evolving to K2SO4in the ambient samples.
Thus, our potassium would be likely to represent the effect
(a) (b)
(c) (d)
(e)
2018 S. Lim et al.: Ionic and carbonaceous compositions of PM10, PM2.5and PM1.0at Gosan
of biomass burning, even if it may include some of fossil fuel combustion, dust, and sea salt as well.
Li et al. (2006) quantified EC and OC concentrations in Horquin sandland in northeastern China by a thermal method and reported the strongest correlation of EC with potassium among five elements, suggesting a significant contribution of rural biomass burning to regional carbonaceous aerosol concentrations. A previous study estimated the emissions of BC in China and pointed out that biomass burning is one of the main sources of BC in China (Streets et al., 2003). Gustafsson et al. (2009) used14C to distinguish fossil fuel and biomass-burning contributions to BC during pollution events in South Asia. They found a far larger contribution of biomass combustion to BC emissions. Biomass burning is dominated on a global scale by fires due to slash-and-burn land clearance, waste burning in agriculture and forestry, and residential wood combustion for heating and cooking (Szi-dat et al., 2009). In particular, East Asia contains biomass burning sources in undeveloped regions of China, Siberia, and North Korea. Biomass combustion-derived materials are likely generated throughout, with the strongest correlations in winter and spring, and transported to the study area. In summer, it is possible that reduced burning and relatively in-creased sea-salt potassium (ss-K+)lead to a poor correlation between EC1 and potassium, and that EC1 may deposit on the surface of larger and hygroscopic ss-K+, leading to better correlation in PM10than PM1.0. It is less likely that Siberian
wildfires or biomass burning in eastern China had influence on EC1 level of summer samples (Kim et al., 2007).
3.4 Source areas
To examine the source signature of aerosols and the effect of transport paths on aerosol composition, we categorized air masses into 5 regimes based on meteorological and chemical characteristics and air mass trajectories every 3 h using the FLEX-PART Lagrangian particle dispersion model (Stohl et al., 2005) (Fig. 9). In this analysis, samples which were af-fected by precipitation or did not show constant trajectories in time were excluded. The five types are labeled “Siberia”, “Beijing”, “Shanghai”, “Yellow Sea”, and “East Sea” ac-cording to the major geographical regions over which an air mass passed during transport. The Siberia, Beijing, Shang-hai, Yellow Sea, and East Sea types included 6 days from Oc-tober to March, 10 days from OcOc-tober to May, 4 days from October to May, 2 days in April, and 6 days from June to September, respectively. The characteristic regimes of each air type are summarized in Table 5. It should be noted that the study region is heavily affected by the monsoon system, and stagnant conditions often developed during transition pe-riods, when trajectories tended to spread over wider areas.
From late fall to early spring, the study region is under the influence of frontal system in association with a Siberian high that is periodically extends towards the southeastern China. As a high pressure approaches, air is usually
trans-ported directly from Siberia to Jeju along with a trough. Then high pressure center shifts its way to the southeast and wind turns to northwesterly. While the former represents the con-tinental background air descending from the free troposphere in Siberian region, the latter is classified as Beijing type air that passed fast over Mongolia and Beijing region. As the high pressure is weakened, the air slowly moves down to the southern part of China or over the Yellow Sea before reach-ing Gosan. The former is classified as Shanghai type that captured the emissions from the southern (Shanghai) as well as northern (Beijing) part of China. The latter is Yellow Sea that is mainly influenced by the Bohai Bay area and in part the west coast of the Korean peninsula. The air mass labeled East Sea was influenced by the East Sea, including Japan and South Korea, and was the most frequently observed air mass in summer. Siberia type can be regarded as clean background air of the northeast Asia (Fig. 9a). The Beijing and Shanghai types represent fresh continental and aged continental plume, respectively (Fig. 9b and c). As being aged over the ocean, the Yellow Sea type exhibits characteristics of continental plumes (Fig. 9d) and is distinguished from East Sea type air (Fig. 9e).
For each air mass category, the ratios of major constituents in submicron and supermicron aerosols are compared in Ta-ble 6. Siberia air showed the lowest levels of CO, sulfate, and PM1.0 mass concentrations, resulting in high ratios of
chemical constituents. In Beijing type air, the ratios of OP, EC1, and nitrate to mass were the highest. In contrast, an en-hanced sulfate/mass ratio was recognizable in Shanghai and Yellow Sea air masses. For these two air masses, the high sul-fate content was the result of favorable meteorological con-ditions such as weak winds and high relative humidity over a warm sea surface (Fig. 9c and d) (Lim et al., 2010a, b) in conjunction with sources from nearby land. The higher ni-trate/sulfate ratios in Beijing type air mass are largely due to the temperature dependency of nitrate because the Beijing air was more frequently encountered at Gosan in the colder sea-sons. Therefore, Beijing and Shanghai plumes were unam-biguously differentiated by the ratios of EC1, OP, and nitrate against sulfate.
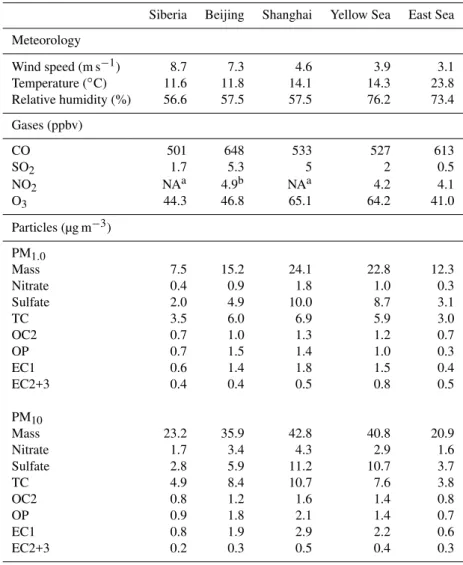
Table 5.Meteorological and chemical characteristics of the 5 air mass categories.
Siberia Beijing Shanghai Yellow Sea East Sea
Meteorology
Wind speed (m s−1) 8.7 7.3 4.6 3.9 3.1
Temperature (◦C) 11.6 11.8 14.1 14.3 23.8
Relative humidity (%) 56.6 57.5 57.5 76.2 73.4
Gases (ppbv)
CO 501 648 533 527 613
SO2 1.7 5.3 5 2 0.5
NO2 NAa 4.9b NAa 4.2 4.1
O3 44.3 46.8 65.1 64.2 41.0
Particles (µg m−3) PM1.0
Mass 7.5 15.2 24.1 22.8 12.3
Nitrate 0.4 0.9 1.8 1.0 0.3
Sulfate 2.0 4.9 10.0 8.7 3.1
TC 3.5 6.0 6.9 5.9 3.0
OC2 0.7 1.0 1.3 1.2 0.7
OP 0.7 1.5 1.4 1.0 0.3
EC1 0.6 1.4 1.8 1.5 0.4
EC2+3 0.4 0.4 0.5 0.8 0.5
PM10
Mass 23.2 35.9 42.8 40.8 20.9
Nitrate 1.7 3.4 4.3 2.9 1.6
Sulfate 2.8 5.9 11.2 10.7 3.7
TC 4.9 8.4 10.7 7.6 3.8
OC2 0.8 1.2 1.6 1.4 0.8
OP 0.9 1.8 2.1 1.4 0.7
EC1 0.8 1.9 2.9 2.2 0.6
EC2+3 0.2 0.3 0.5 0.4 0.3
aNA: not available.bNA on 14 February and 3 April.
In the present study, OP was recognized as a major com-ponent of OC and found to be a source signature of the Bei-jing type air mass. Through the entire period of observa-tion, OP was noticeably elevated when wind speed was high under the influence of a strong continental high or a migra-tory cyclone. As a result, high ratios of OP to EC1 were observed in fast-moving air parcels carried by northwesterly winds in winter or northerly winds in spring, which could bring relatively fresh emissions from Beijing and its vicinity and plumes due to biomass burning in Mongolia (Kim et al., 2007) and Siberia if they existed (Fig. 9a). In contrast, OP re-mained low in the warmer seasons, which were characterized by stagnant air masses, leading to low OP/EC ratios. These variations are evident in Table 6, in which it can be seen that the ratio of OP/EC1 was quite low in Yellow Sea and East Sea air masses. Therefore, the main sources of OP are likely to be coal combustion and biomass burning.
2020 S. Lim et al.: Ionic and carbonaceous compositions of PM10, PM2.5and PM1.0at Gosan
Table 6.Ratios of major chemical constituents indicating source regions categorized into 5 regimes: Siberia, Beijing, Shanghai, Yellow Sea, and East Sea.
Ratio PM1.0 PM10
Siberia Beijing Shanghai Yellow Sea East Sea Siberia Beijing Shanghai Yellow Sea East Sea
OP/Mass ↑ ↑ – – – ↑ ↑ – – –
EC1/Mass ↑ ↑ – – – ↑ ↑ ↑ – –
Nitrate/Mass ↑ ↑ ↑ – – – ↑ ↑ – –
Sulfate/Mass – – ↑ ↑ – – – ↑ ↑ –
Nitrate/Sulfate ↑ – – – – ↑ ↑ – – –
OC2/TC – – – ↑ ↑ – – – ↑ ↑
EC2+3/EC1 ↑ – ↑ – ↑↑ – – ↑ – ↑↑
OP/Sulfate ↑↑ ↑ – ↓ ↓ ↑ ↑ – – –
EC1/Sulfate ↑ ↑ – – – ↑ ↑ – – –
The ratios are expressed as symbols:↑↑for values larger than mean×1.5,↑for those between mean and mean×1.5, – for those between mean×0.5 and mean, and↓for those smaller than mean×0.5.
Although EC and BC have long been major topics of re-search due to their light-absorbing characteristics, the recent discovery of light-absorbing organic carbon makes it imper-ative to reassess and redefine the components that make up light-absorbing carbonaceous matter in the atmosphere (An-dreae and Gelencs´er, 2006; Alexander et al., 2008). There is a continuum of carbonaceous substances in atmospheric aerosols, where refractory organics included in a thermo-chemical classification are consistent with colored organics in an optical classification. These so-called brown carbons have a sharply increased absorption efficiency toward shorter wavelengths, although the absorption is much less than that of soot carbon at the wavelength of 550 nm, and this spectral dependence causes the material to appear brown and makes their absorption in the UV potentially significant due to the large amounts occurring in continental aerosols (Kirchstet-ter et al., 2004; Hoffer et al., 2006). However, their optical properties, origin, and chemical composition are poorly un-derstood and thus need further investigation.
The results discussed above highlight the fact that the Bei-jing air mass is distinguished not only by higher ratios of EC1 and OP to mass but also by higher ratios of EC1 (and OP) to sulfate. This implies that air masses from the Beijing area may have a more significant influence on net warming than do air masses from the other regions. This result confirms the main conclusion of Ramana et al. (2010), who estimated the impact of BC/sulfate ratios of air masses transported from the Beijing and Shanghai areas on net warming based on surface and aircraft measurements conducted over the Yellow Sea in spring and summer.
4 Conclusions
Daily PM1.0, PM2.5, and PM10samples were taken at Gosan
ABC Superstation on Jeju Island from August 2007 to September 2008. The mass concentrations of PM1.0, PM2.5,
and PM10 varied between 1.3 and 29.5 µg m−3, 3.9 and
39.2 µg m−3, and 7.5 and 69.8 µg m−3, respectively. PM1.0
and PM2.5account for 48.4 % and 79.6 % of PM10,
respec-tively, indicating a large portion of fine-mode aerosols in this study area. EC tended to be enriched in smaller particles and made up 10.4 %, 9.8 %, and 6.0 % of PM1.0, PM2.5, and
PM10, respectively. Unlike EC, OC accounted for 23.0 %,
22.9 %, and 16.4 % in PM1.0, PM2.5, and PM10,
respec-tively. The size distributions of OC subcomponents such as OC3 and OC4 reflected substantial contributions of primary sources such as dust, sea salt, or biogenic matter.
The definition and measurement techniques for atmo-spheric EC (or BC) have long been subjects of scientific con-troversy. We compared our observed EC with BC measure-ments obtained by Aethalometer and found a perfect relation-ship with a slope of 1.0 for PM1.0 EC1 (but not for PM10).
This result indicates that coarse particles have lower light-absorbing efficiency than fine particles. In our data, EC and sulfate were well correlated, meaning that there is difficulty in distinguishing absorbing aerosols from scattering aerosols. For EC, the definition of EC1 as char-EC and EC2+3 as soot-EC applied well to our measurements; the former is emit-ted from smoldering combustion (such as biomass burning and residential and coal combustion), and the latter is gen-erated from flaming combustion (such as motor vehicle ex-haust and coal combustion). The mean EC1 concentrations were almost two times higher than the mean EC2+3 concen-trations for all three particle sizes, ranging from 1.0 µg m−3
for EC2+3. EC1 was strongly correlated with potassium throughout the year except for summer. While EC2+3 was more enriched in PM1.0, EC1 favored PM2.5 or PM10. As
a result, EC1 was more sensitive to wet scavenging, and the ratio of EC1 to EC2+3 was higher in summer. This differ-ence was likely linked with a longer residdiffer-ence time of EC2+3 than that of EC1 in the atmosphere. This result implies a role of EC2+3 as a contribution to warming, particularly at a regional scale, due to its longer lifetime, even though its concentrations in the atmosphere are lower.
This study highlights the ratios of major chemical species as useful tools to distinguish the main sources of aerosols and the degree of atmospheric processing. Five air mass types were clearly identified: Siberia, Beijing, Shanghai, Yellow Sea, and East Sea types. Siberian types would be regarded as continental background air of the northeast Asia. While the Beijing, Shanghai, and Yellow Sea air masses were mostly influenced by China, the Korean emissions affected the Yel-low Sea and East Sea type air masses. For the East Sea air, Japanese and Korean influences were dominant. The Bei-jing type air was the freshest and was distinguished by higher concentrations of EC and OP relative to sulfate, signifying a higher net warming effect of aerosols in this air type than in the other three types. OP was also suggested as a light-absorbing form of carbon. On the other hand, sulfate was remarkably enhanced in air that had been slowly transported over China or the Yellow Sea, which was the case of the Shanghai and Yellow Sea air masses. The aged air masses of Yellow Sea and East Sea types in particular showed lower OP to sulfate ratios and higher OC2 to TC ratios. The latter implies a secondary role among OC fractions in conjunction with a tendency of enrichment at smaller aerosol sizes. Fur-thermore, the highest ratio of EC2+3 to EC1 was found in the East Sea air, in sharp contrast with the other air mass cat-egories, which showed less impact of Chinese emissions.
Acknowledgements. Authors thank to A. Stohl for allowing us to
use Flexpart results at Gosan. This study was supported by the Korea Research Foundation grant KRF-2008-314-C00402 and Research Agency for Climate Science grant RACS 2010-1007.
Edited by: X. Querol
References
Aggarwal, S. G. and Kawamura, K.: Carbonaceous and inorganic composition in long-range transported aerosols over northern Japan: Implication for aging of water-soluble organic fraction, Atmos. Environ., 43, 2532–2540, 2009.
Akimoto, H.: Global Air Quality and Pollution, Science, 302, 1716–1719, doi:10.1126/science.1092666, 2003.
Alexander, D. T. L., Crozier, P. A., and Anderson, J. R.: Brown Car-bon Spheres in East Asian Outflow and Their Optical Properties, Science, 321, 833–836, doi:10.1126/science.1155296, 2008. Andreae, M. O. and Gelencs´er, A.: Black carbon or brown
car-bon? The nature of light-absorbing carbonaceous aerosols,
At-mos. Chem. Phys., 6, 3131–3148, doi:10.5194/acp-6-3131-2006, 2006.
Andrews, E., Saxena, P., Musarra, S., Hildemann, L. M., Koutrakis, P., McMurry, P. H., Olmez, I., and White, W. H.: Concentration and composition of atmospheric aerosols from the 1995 SEAVS experiment and a review of the closure between chemical and gravimetric measurements, J. Air Waste Manage. Assoc., 50, 648–664, 2000.
Bassett, M. E. and Seinfeld, J. H.: Atmospheric equilibrium model of sulfate and nitrate aerosols-II. Particle size analysis, Atmos. Environ., 18, 1163–1170, 1984.
Bond, T. C.: Spectral dependence of visible light absorption by carbonaceous particles emitted from coal combustion, Geophys. Res. Lett., 28, 4075–4078, doi:10.1029/2001GL013652, 2001. Bond, T. C., Covert, D. S., Kramlich, J. C., Larson, T. V., and
Charl-son, R. J.: Primary particle emissions from residential coal burn-ing: Optical properties and size distributions, J. Geophys. Res., 107, 8347, doi:10.1029/2001JD000571, 2002.
Bond, T. C., Habib, G., and Bergstrom, R. W.: Limitations in the enhancement of visible light absorption due to mixing state, J. Geophys. Res., 111, D20211, doi:10.1029/2006JD007315, 2006. Bond, T. C., Bhardwaj, E., Dong, R., Jogani, R., Jung, S., Ro-den, C., Streets, D. G., and Trautmann, N. M.: Historical emis-sions of black and organic carbon aerosols from energy-related combustion, 1850–2000, Global Biogeochem. Cy., 21, GB2018, doi:10.1029/2006GB002840, 2007.
Brasseur, G. P., Orlando, J. J., and Tyndall, G. S.: Atmospheric Chemistry and Global Change. Oxford University Press., Ox-ford, UK, 654, 1999.
Buzorius, G., McNaughton, C. S., Clarke, A. D., Covert, D. S., Blomquist, B., Nielsen, K., and Brechtel, F. J.: Secondary aerosol formation in continental outflow condi-tions during ACE-Asia, J. Geophys. Res., 109, D24203, doi:10.1029/2004JD004749, 2004.
Cao, J. J., Wu, F., Chow, J. C., Lee, S. C., Li, Y., Chen, S. W., An, Z. S., Fung, K. K., Watson, J. G., Zhu, C. S., and Liu, S. X.: Char-acterization and source apportionment of atmospheric organic and elemental carbon during fall and winter of 2003 in Xi’an, China, Atmos. Chem. Phys., 5, 3127–3137, doi:10.5194/acp-5-3127-2005, 2005.
Carmichael, G. R., Zhang, Y., Chen, L. L., Hong, M. S., and Ueda, H. : Seasonal variation of aerosol composition at Cheju Island, Korea, Atmos. Environ., 30, 2407–2416, 1996.
Carmichael, G. R., Hong, M. S., Ueda, H., Chen, L. L., Murano, K., Park, J. K., Lee, H. G., Kim, Y., Kang, C., and Shim, S.: Aerosol composition at Cheju Island, Korea, J. Geophys. Res., 102, 6047–6061, doi:10.1016/1352-2310(95)00230-8, 1997. Chen, L.-L., Carmichael, G. R., Hong, M., Ueda, H., Shim, S.,
Song, C. H., Kim, Y. P., Arimoto, R., Prospero, J., Savoie, D., Murano, K., Park, J. K., Lee, H., and Kang, C.: Influ-ence of continental outflow events on the aerosol composition at Cheju Island, South Korea, J. Geophys. Res., 102, 28551–28574, doi:10.1029/97JD01431, 1997.
Chen, L.-W. A., Moosmuller, H., Arnott, W. P., Chow, J. C., Wat-son, J. G., Susott, R. A., Babbitt, R. E., Wold, C. E., Lincoln, E. N., and Hao, W. M.: Emissions from laboratory combustion of wildland fuels: Emission factors and source profiles. Environ. Sci. Technol., 41, 4317–4325, 2007.
2022 S. Lim et al.: Ionic and carbonaceous compositions of PM10, PM2.5and PM1.0at Gosan
Lowenthal, D. H., Crow, D. J., Kohl, S. D., Engelbrecht, J. P., and Green, M. C.: Source profiles for industrial, mobile, and area sources in the Big Bend Regional Aerosol Visibil-ity and Observational (BRAVO) Study, Chemos., 54, 185–208, doi:10.1016/j.chemosphere.2003.07.004, 2004.
Chow, J. C., Watson, J. G., Louie, P. K., Chen, L. W., and Sin, D.: Comparison of PM2.5 carbon measurement methods in Hong Kong, China, Environ. Pollut., 137, 334–344, 2005.
Decesari, S., Facchini, M. C., Matta, E., Mircea, M., Fuzzi, S., Chughtai, A. R., and Smith, D. M.: Water soluble organic com-pounds formed by oxidation of soot, Atmos. Environ., 36, 1827– 1832, 2002.
Dentener, F. J., Carmichael, G. R., Zhang, Y., Lelieveld, J., and Crutzen, P. J.: Role of mineral aerosol as a reactive surface in the global troposphere. J. Geophys. Res., 101, 22869–22889, doi:10.1029/96JD01818, 1996.
Elmquist, M., Cornelissen, G., Kukulska, Z., and Gustafs-son, ¨O.: Distinct oxidative stabilities of char versus soot black carbon: Implications for quantification and environmen-tal recalcitrance, Global Biogeochem. Cycles, 20, GB2009, doi:10.1029/2005GB002629, 2006.
Fuller, K. A., Malm,W. C., and Kreidenweis, S. M.: Effects of mix-ing on extinction by carbonaceous particles, J. Geophys. Res., 104, 15941–15954, 1999.
Fung, K. K.: Particulate carbon speciation by MnO2 oxidation. Aerosol Sci. Technol., 12, 122–127, 1990.
Gaudichet, A., Echalar, F., Chatenet, B., Quisefit, J. P., Malingre, G., Cachier, H., Artaxo, P., Maenhaut, W., and Buat-M’enard, P.: Trace elements in tropical African savannah biomass burning aerosol, J. Atmos. Chem., 22, 19–39, 1995.
Geng, H., Park, Y., Hwang, H., Kang, S., and Ro, C.-U.: Elevated nitrogen-containing particles observed in Asian dust aerosol samples collected at the marine boundary layer of the Bohai Sea and the Yellow Sea, Atmos. Chem. Phys., 9, 6933–6947, doi:10.5194/acp-9-6933-2009, 2009.
Gray, H. A., Cass, G. R., Huntzicker, J. J., Heyerdahl, E. K., and Rau, J. A.: Characteristics of atmospheric organic and elemen-tal carbon particle concentrations in Los Angeles, Environ. Sci. Technol., 20, 580–582, doi:10.1021/es00148a006, 1986. Guazzotti, S. A., Suess, D. T., Coffee, K. R., Quinn, P. K., Bates,
T. S., Wisthaler, A., Hansel. A., Ball, W. P., Dickerson, R. R., Neus¨uß, C., Crutzen, P. J., Prather, K. A.: Characteriza-tion of carbonaceous aerosols outflow from India and Arabia: Biomass/biofuel burning and fossil fuel combustion, J. Geophys. Res., 108, D15, doi:10.1029/2002JD003277, 2003.
Gustafsson, ¨O., Krus˚a, M., Zencak, Z., Sheesley, R. J., Granat, L., Engstr¨om, E., Praveen, P. S., Rao, P. S. P., Leck, C., and Rodhe, H.: Brown clouds over South Asia: Biomass or fossil fuel com-bustion?, Science, 323, 495–498, doi:10.1126/science.1164857, 2009.
Hagler, G. S. W., Bergin, M. H., Salmon, L. G., Yu, J. Z., Wan, E. C. H., Zheng, M., Zeng, L. M., Kiang, C. S., Zhang, Y. H., Lau, A. K. H., and Schauer, J. J.: Source areas and chemical composition of fine particulate matter in the Pearl River Delta region of China, Atmos. Environ., 40, 3802–3815, 2006.
Han, Y. M., Cao, J., Chow, J. C., Watson, J. G., An, Z., Jin, Z., Fung, K., and Liu, S.: Evaluation of the thermal/optical reflectance method for discrimination between char- and soot-EC, Chemo-sphere, 69, 569–574, doi:10.1016/j.chemosphere.2007.03.024,
2007.
Han, Y. M., Cao, J. J., Posmentier, E. S., Chow, J. C., Watson, J. G., Fung, K. K., Jin, Z. D., Liu, S. X., and An, Z. S.: The effect of acidification on the determination of elemental carbon, char-, and soot-elemental carbon in soils and sediments, Chemosphere, 75, 92–95, doi:10.1016/j.chemosphere.2008.11.044, 2009a. Han, Y. M., Lee, S. C., Cao, J. J., Ho, K. F., and An, Z. S.:
Spa-tial distribution and seasonal variation of char-EC and soot-EC in the atmosphere over China, Atmos. Environ., 43, 6066–6073, doi:10.1016/j.atmosenv.2009.08.018, 2009b.
Han, Y. M., Cao, J.J., Lee, S. C., Ho, K. F., and An, Z. S.: Different characteristics of char and soot in the atmosphere and their ratio as an indicator for source identification in Xi’an, China, Atmos. Chem. Phys., 10, 595–607, doi:10.5194/acp-10-595-2010, 2010. Hansen, A. D. H.: The Aethalometer™, Magee Scientific
Com-pany, Berkeley, California, USA, 2005.
Hansen, J., Sato, M., and Ruedy, R.: Radiative forcing
and climate response. J. Geophys. Res., 102, 6831–6864, doi:10.1029/96JD03436, 1997.
Havers, N., Burba, P., Lambert, J., and Klockow, D.: Spec-troscopic characterization of humic-like substances in
air-borne particulate matter, J. Atmos. Chem., 29, 45–54,
doi:10.1023/A:1005875225800, 1998.
Haywood, J. and Boucher, O.: Estimates of the direct and indirect radiative fording due to tropospheric aerosols: A review, Rev. Geophys., 38, 513–543, doi:10.1029/1999RG000078, 2000. He, K., Yang, F., Ma, Y., Zhang, Q., Yao, X., Chan, C. K., Cadle,
S., Chan, T., and Mulawa, P.: The characteristics of PM2.5 in Beijing, China, Atmos. Environ., 35, 4959–4970, 2001. Hoffer, A., Gelencs´er, A., Guyon, P., Kiss, G., Schmid, O., Frank,
G. P., Artaxo, P., and Andreae, M. O.: Optical properties of humic-like substances (HULIS) in biomass-burning aerosols, At-mos. Chem. Phys., 6, 3563–3570, doi:10.5194/acp-6-3563-2006, 2006.
Huebert, B. J., Bates, T., Russell, P. B., Shi, G., Kim, Y. J., Kawa-mura, K., Carmichael, G., and Nakajima, T.: An overview of ACE-Asia: Strategies for quantifying the relationships between Asian aerosols and their climatic impacts, J. Geophys. Res., 108, 8633, doi:10.1029/2003JD003550, 2003.
IPCC: Climate Change 2007: The Physical Science Basis (Con-tribution of Working Group I to the Fourth Assessment Report of the Intergovernmental Panel on Climate Change), edited by: Solomon, S., Qin, D., Manning, M., Chen, Z., Marquis, M., Av-eryt, K. B., Tignor, M., and Miller, H. L., Cambridge Univ. Press, New York, 131–217, 2007.
Jacobson, M. Z.: Strong radiative heating due to the mixing state of black carbon in atmospheric aerosols, Nature, 409, 695–697, doi:10.1038/35055518, 2001.
Jacobson, M. C., Hansson, H.-C., Noone, K. J., and Charlson, R. J.: Organic atmospheric aerosols: review and state of the sci-ence, Rev. Geophys., 38, 267–294, doi:10.1029/1998RG000045, 2000.