www.atmos-chem-phys.org/acp/5/515/ SRef-ID: 1680-7324/acp/2005-5-515 European Geosciences Union
Chemistry
and Physics
To what extent can aerosol water explain the discrepancy between
model calculated and gravimetric PM
10
and PM
2
.
5
?
S. G. Tsyro
Norwegian Meteorological Institute, Oslo, Norway
Received: 13 July 2004 – Published in Atmos. Chem. Phys. Discuss.: 29 September 2004 Revised: 20 January 2005 – Accepted: 9 February 2005 – Published: 16 February 2005
Abstract. Inter-comparisons of European air quality mod-els show that regional transport modmod-els, including the EMEP (Co-operative Programme for monitoring and evaluation of the long-range transmission of air pollutants in Europe) aerosol model, tend to underestimate the observed concentra-tions of PM10 and PM2.5. Obviously, an accurate
represen-tation of the individual aerosol constituents is a prerequisite for adequate calculation of PM concentrations. On the other hand, available measurements on the chemical characteriza-tion of ambient particles reveal that full chemical PM mass closure is rarely achieved. The fraction unaccounted for by chemical analysis can comprise as much as 30–40% of gravi-metric PM10or PM2.5mass. The unaccounted PM mass can
partly be due to non-C atoms in organic aerosols and/or due to sampling and measurement artefacts. Moreover, a part of the unaccounted PM mass is likely to consist of water as-sociated with particles. Thus, the gravimetrically measured particle mass does not necessarily represent dry PM10 and
PM2.5mass. This is thought to be one of the reasons for
mod-els under-prediction of observed PM, if calculated dry PM10
and PM2.5concentrations are compared with measurements.
The EMEP aerosol model has been used to study to what ex-tent particle-bound water can explain the chemically uniden-tified PM mass in filter-based particle samples. Water con-tent of PM2.5and PM10 has been estimated with the model
for temperature 20◦C and relative humidity 50%, which are
conditions required for equilibration of dust-loaded filters ac-cording to the Reference method recommended by the Euro-pean Committee for Standardization (CEN). Model calcula-tions for Europe show that, depending on particle compo-sition, particle-bound water constitutes 20–35% of the an-nual mean PM10 and PM2.5 concentrations, which is
con-sistent with existing experimental estimates. At two Aus-trian sites, in Vienna and Streithofen, where daily
measure-Correspondence to:S. G. Tsyro ([email protected])
ments of PM2.5 mass and chemical composition are
avail-able, calculated PM2.5water content is found to be about 75–
80% of the undetermined PM2.5 mass and there is
correla-tion between them. Furthermore, accounting for aerosol wa-ter has improved the agreement between modelled and mea-sured daily PM2.5 concentrations, whilst model calculated
dry PM2.5concentrations appear to agree quite well with the
total identified PM2.5mass. No information on the
compo-sition of PM measured at EMEP sites is presently available. Given that PM10 and PM2.5concentrations are measured at
EMEP stations with gravimetric methods they are likely to contain water. We show that the levels of modelled PM10and
PM2.5concentrations with aerosol water included agree with
measurements better than dry PM concentrations. As ex-pected, the spatial correlation has not changed significantly, whereas the temporal correlation of daily PM10 and PM2.5
with monitoring data has slightly improved at most of the EMEP sites. Our results suggest that aerosol water should be accounted for in modelled PM10and PM2.5when compared
with filter-based gravimetric measurements.
1 Introduction
PM10 with measurements from the EMEP monitoring
net-work. Recently, measurement data available from EIONET (European Environment Information and Observation Net-work) and from national (Austrian, Spanish and Norwegian) monitoring networks and research projects have been em-ployed for the model evaluation.
In previous studies (e.g. Tsyro, 2003), the EMEP aerosol model was found to systematically underestimate observed PM2.5 and PM10 concentrations by 40–60% on average,
when dry PM2.5and PM10masses from the model were
com-pared with measurements. The model underestimation of ob-served PM concentrations was partly explained by that such important aerosol components as secondary organic aerosols (SOA) and wind blown and re-suspended dust, was not yet implemented in the model. This means that the model simu-lations did not complete the mass closure of PM2.5and PM10.
On the other hand, data on PM2.5and PM10measurements
supplemented with analyses of the particle chemical compo-sition (e.g. Balasubramanian et al., 2003; Matta et al., 2003; Putaud et al., 2004; Zappoli et al. 1999; Yttri, 2003) re-veal that full chemical mass closure is rarely achieved, and there is often a discrepancy between chemical and gravimet-ric masses. In other words, after all important aerosol com-ponents (inorganic and carbonaceous compounds, minerals and metals) are analysed a part of PM mass remains unidenti-fied. The possible sources for the discrepancy between gravi-metric PM mass and the total mass of all identified compo-nents are associated with: 1) non-C atoms, i.e. oxygen, hy-drogen, nitrogen, in organic aerosol, 2) particle-bound water and 3) measurement artefacts. In this paper, we will focus on the role of particle water in PM mass. Accounting for water absorbed by collected particles on the filter tape of the Beta-gauge was discussed in Chang and Tsai (2003) and Chang et al. (2001). In the work by Neus¨uß et al. (2002), the mass of water associated with hygroscopic aerosol compounds, was derived from the measured particles growth factor and was estimated to be about 20–25% of PM10mass at 60% relative
humidity. In the same work, particle chemical mass concen-trations including water were shown to correspond fairly well with the gravimetric mass concentrations.
Filter-based gravimetric methods are recommended by EMEP and EU Council for determining PM10mass
concen-trations at monitoring sites. In accordance with the Ref-erence Method developed by the European Committee for Standardization (CEN), the filters should be equilibrated at about 50% relative humidity and 20◦C temperature before
they are weighed, both prior to the sample collection and af-ter sampling. Gravimetrically deaf-termined PM mass will also include the mass of liquid water associated with particles.
The purpose of this work is to estimate with a model to what extent aerosol water can explain the unaccounted frac-tion of gravimetric PM mass. For this purpose, the EMEP aerosol model has been used. We also examine how account-ing for particle-bound water improves the comparison of model calculated PM10and PM2.5with observations. Firstly,
a short description is given of the EMEP aerosol model. We also briefly explain the CEN Reference method recom-mended by EU and EMEP for measuring PM mass. Then, the main results from model verification with respect to PM10
and PM2.5are outlined and problems related to the
interpre-tation of comparison/disagreement between calculations and measurements are identified. Further, the model estimates of water content in PM10 and PM2.5at the conditions required
for filter equilibration are presented. Daily measurements of PM2.5concentrations and chemical composition available at
two Austrian stations have been employed for more elaborate testing of model calculations of particle-bound water, dry and wet PM2.5mass. Finally, assuming that gravimetrically
mea-sured PM mass at EMEP sites includes particle-bound wa-ter, we compare model simulated wet (including water) PM10
and PM2.5concentrations with EMEP measurements.
Sum-mary and conclusions are given in the end.
2 The EMEP aerosol model
Below, a brief description of the EMEP aerosol model is given. Previous model versions have been described in Tsyro (2002), with a detailed model description of the lat-est version in Appendix A in Simpson et al. (2003).
2.1 Short model description
The EMEP aerosol model describes the emissions, chemi-cal transformations, transport and dry and wet removal of at-mospheric aerosol and calculates the size-aggregated aerosol number and mass and particle chemical composition. The particle size distribution is resolved with four monodisperse size modes, i.e. nucleation, Aitken, accumulation and coarse mode. The aerosol chemical composition is described with seven components: sulphate (SO24−), nitrate (NO−3), ammo-nium (NH+4), elemental (EC) and organic (OC) carbon, sea salt (NaCl) and mineral dust, which are assumed to be inter-nally mixed. In this way, all particles in the same mode are assumed to have the same size and chemical composition. Aerosol associated water is a diagnostic parameter and calcu-lated in the model for each size mode. The aerosol dynamics module MM32 (Pirjiola et al., 2003) is employed to calculate particle coagulation and condensational growth. The empir-ical parameterisation by Berndt et al., 2000 for binary nu-cleation rate of H2SO4–H2O is currently used in the EMEP
aerosol model.
The model accounts for primary and secondary aerosols. In the model, primary aerosols originate from both anthro-pogenic and natural sources. Primary anthroanthro-pogenic emis-sions of PM10 and PM2.5are based on the TNO CEPMEIP
assumptions have been used in the model to characterise chemical composition and size distribution of PM emis-sions. PM2.5emissions have been distributed between OC,
EC and mineral dust, and between the Aitken and accumu-lation modes, and the coarse PM emissions have been as-sumed to consist of mineral dust. The primary natural PM in the model includes presently sea salt aerosol, for which the formation rates are calculated following Monahan (1978) and M˚artinsson et al. (2002). Implementation in the EMEP model of natural mineral dust due to wind erosion and re-suspension is in progress, but not included in the results pre-sented here.
Secondary aerosols in the model are formed from the anthropogenic emissions of gaseous precursors, SOx, NOx
and NH3, as a result of homogeneous and heterogeneous
chemical transformations. Gas/aerosol partitioning of semi-volatile inorganic components is calculated with the Equi-librium Simplified Aerosol Model, EQSAM, (Metzger et al., 2002a). The EQSAM used in the EMEP model currently treats the equilibrium in SO24−–HNO3–NO−3–NH3–NH+4–
Na+–Cl− system. Several schemes to calculate the forma-tion of secondary organic aerosols (SOA) from biogenic and anthropogenic sources have been tested (Andersson-Sk¨old and Simpson, 2001; Simpson and Makar, 2004), but SOA is not included presently in the aerosol model.
Aerosol water is calculated with EQSAM based on the aerosol chemical composition. At each time-step, particle diameter is calculated from the total (i.e. dry PM plus wa-ter) particle mass and the particle number concentration in each size mode. The parameterisation of particle dry depo-sition is based on the resistance approach, where the sub-laminar layer resistance is calculated dependent on the par-ticle size and the type of land-use. The scheme for aerosol wet deposition employs the size dependent scavenging ratios for in-cloud and sub-cloud scavenging. In clouds, all accu-mulation mode particles are assumed to become activated. A rather simple approach is presently implemented in the model to account for the in-cloud activation and growth of Aitken particles (Fitzgerald, 1973; Hansson, person. com-mun.). The detailed model description can be found in Ap-pendix A in Simpson et al. (2003) and on the EMEP website at http://www.emep.int.
2.2 Aerosol water in the EMEP aerosol model
The aerosol water content is calculated with the EQSAM model based on the semi-empirical so-called ZSR-relation after Zdanovski (1948) and Stokes and Robinson (1966), which assumes that the water activity of the mixed solute is equal to the water activity of all single-solute solutions. Thus, the water content associated with a mixed solution is the sum of the water content of all binary solutions. Then, the mass of aerosol liquid water content (LWC) is found as
the sum:
LW C=
N
X
i
(Mi/mi), (1)
where LWC(kg/m)3 is the liquid water content of aerosol,
N is the total number of single-salt solutions, Mi (mol/m3)
is the molar concentration andmi (mol/kg) is the molality
of salt i. The single-solute molalities are parameterized in terms of relative humidity (detailed description can be found in Metzger et al., 2002 and Metzger, 2000).
The version of EQSAM adopted in the EMEP model as-sumes meta-stable aerosols, i.e. that aqueous aerosols re-main in a meta-stable phase. This implies that calculated aerosol water represents the upper branch of the hysteresis curve. This is believed to be rather typical for most of the measurement conditions when the end of filter exposure is in the morning. However, in some cases when the ambient humidity is much lower than that in the conditioning room (i.e. 50%), collected particles will absorb water following the lower branch of the hysteresis curve. In such cases, the model may overestimate the water content of the particle sample. The soluble aerosol compounds in the aerosol model are SO24−, NO−3, NH+4 and sea salt. Soluble aerosol compounds, accounted for in the aerosol model, are SO24−, NO3−, NH4+
and sea salt, while organic aerosols are presently assumed to be insoluble. Because of the latter assumption, an underes-timation of aerosol water can be expected, as a significant fraction of OC can be water soluble (e.g. Putaud et al., 2003; Balasubramanian et al., 2003; Matta et al., 2003). However, this assumption is not expected to change the main results presented here because the mass OC in PM is considerably underestimated by the model as it does not include SOA (see above).The calculated aerosol water content will depend on the mass of soluble aerosol compounds and on the type of salt mixture in particles.
3 Measurements of PM mass
3.1 EMEP/EU guidelines for PM10measurements
To establish the basis for PM10-monitoring a reference
developed by CEN under mandate of the European Commis-sion (Second Position Paper, 2003).
EU Council Directive 1999/30/EC defines the reference method for the sampling and measurement of PM10 to be
the one described in EN 12341. However, a Member State may use any other method which gives results equivalent to the reference method or displays a consistent relationship to the reference method. The EMEP manual on PM10
measure-ments (EMEP/CCC, 2001) adopted in 2002 states that the aerosol particulate mass should preferably be determined ac-cording to EN 12341 (1998), or other methods and/or instru-ments if proven to provide results consistent with the ref-erence method. All of the sites currently reporting PM10
and PM2.5 concentrations to EMEP use gravimetric
meth-ods, otherwise Beta-gauges (Beta Attenuation Monitors) and TEOM (Tapered Elements Oscillating Microbalance) instru-ments are still the most commonly used methods to monitor PM mass in European national networks.
When gravimetric methods are used for PM mass mea-surements, the daily samples collected on filters are trans-ferred to the laboratory for conditioning, weighing and sub-sequent chemical analyses. As required by EN 12341, the filters should be equilibrated at 20◦C (±1) and 50% relative
humidity (±5) for 48 h. This equilibration should be per-formed before the filters are weighed prior to the sample col-lection, and after sampling, before the filter is weighed again with the collected sample. As pointed out above, the equili-brated filters will contain some amount of liquid water asso-ciated with particles, so that the gravimetrically determined PM10 and PM2.5 concentrations do not typically represent
PM dry mass. On the other hand, automated instruments for PM monitoring, like TEOM or Beta-gauge, either use heated inlets or other equipment (e.g. diffusion dryer in TEOM) in order to remove moisture from the sample. Thus, the auto-matically monitored PM concentrations will be much closer to representing dry aerosol mass than gravimetric PM mass. 3.2 Particle water in gravimetric PM mass
Available data on PM mass measurements, supplemented with analysis of PM chemical composition, and results of mass closure experiments presented in a number of publica-tions, reveal that full chemical characterisation of particles is rarely achieved. There is typically a difference between the gravimetric PM mass concentration and the sum of all chem-ically identified components. The unaccounted part of PM mass could be as large as 25–35% of the PM10 and PM2.5
mass.
It was already pointed out above, that besides sampling and analysis artefacts affecting the attainment of chemical mass balance, the unaccounted mass can partly be explained by elements associated with organic aerosols other than car-bon. Moreover, a part of the unaccounted PM mass is com-monly attributed to particle-bound water. Estimates based on the growth factor measurements show that for instance
(NH4)2SO4can contain about 30% (mass) of water at 50%
relative humidity (Schwela et al., 2002). Studies of the wa-ter uptake by particles on filwa-ters exposed to different humidi-ties (Winkler and Junge, 1972) show the increase of particle mass at relative humidity of 50% to be 10–30% compared to the dry mass. Results from several studies, summarised in Schwela et al. (2002), support those findings. Further more, the amount of water in PM samples will vary for different samples and measurement sites, depending on the particle composition and the ambient relative humidity and tempera-ture (e.g. Warneck, 2000). Depending on the ambient condi-tions during sampling, particles on the dust-loaded filter can either adsorb or lose water under post-equilibration. The re-lationship between particle mass and composition and par-ticle water content is rather complicated due to hysteresis in the water adsorption-desorption pathways (i.e. the deli-quescence and crystallization relative humidity points of the aerosol particle do not coincide). Due to the hysteresis phe-nomenon, the mass of water will be greater in particle sam-ples collected at high ambient humidity and then transferred to a lower humidity environment in the laboratory, as com-pared to the opposite case.
4 Model calculations and comparison with measure-ments
4.1 Calculations of dry PM concentrations
The EMEP aerosol model, without any accounting for PM-water, was previously compared for the years 1999–2001 with data available from the EMEP monitoring network, the AIRBASE database and several national research campaigns (Tsyro, 2003; Tsyro et al., 2003). The model was found to systematically underestimate measured PM2.5 and PM10
concentrations by 40–60% on average (as shown in Fig. 9, upper panels), when dry PM10 and PM2.5 concentrations
were compared with measurements. These discrepancies be-tween model calculations and measurements were explained in terms of the lack of secondary organic aerosols (SOA) and wind blown and re-suspended dust. For instance, the largest underestimations of PM10 and PM2.5 by the model
were found at Spanish stations. This is because of the sig-nificant contribution of mineral dust to PM in Spain due to wind soil erosion and Saharan dust intrusions (Rodr´ıguez et al., 2001; Rodr´ıguez et al., 2002).
Particulate matter is not a single pollutant, but a complex mixture of many pollutants. Therefore, the adequate model calculation of PM10 and PM2.5depends on its accurate
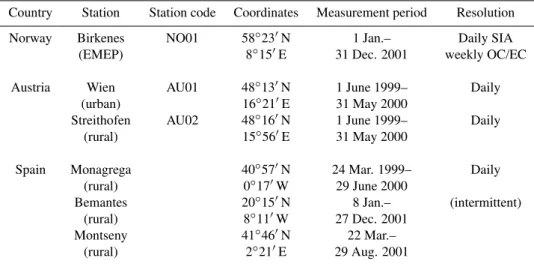
Table 1. Overview of the stations where measurements were available of both PM mass and chemical composition.
Country Station Station code Coordinates Measurement period Resolution
Norway Birkenes NO01 58◦23′N 1 Jan.– Daily SIA
(EMEP) 8◦15′E 31 Dec. 2001 weekly OC/EC
Austria Wien AU01 48◦13′N 1 June 1999– Daily
(urban) 16◦21′E 31 May 2000
Streithofen AU02 48◦16′N 1 June 1999– Daily
(rural) 15◦56′E 31 May 2000
Spain Monagrega 40◦57′N 24 Mar. 1999– Daily
(rural) 0◦17′W 29 June 2000
Bemantes 20◦15′N 8 Jan.– (intermittent)
(rural) 8◦11′W 27 Dec. 2001
Montseny 41◦46′N 22 Mar.–
(rural) 2◦21′E 29 Aug. 2001
sites where PM10and PM2.5concentrations were measured,
except for one site in Birkenes, Norway (Table 1).
Thus, there was insufficient information for drawing con-clusions on the reasons for the discrepancies between mod-elled and measured PM concentrations. Recently, measure-ments of PM10and PM2.5chemical composition from
Span-ish and Austrian national networks and research campaigns (Rodrˆıguez et al., 2002; Querol, personal commun.; and Puxbaum et al., 2003) have been made available to us (Ta-ble 1). These data have been used for evaluating the revised model results in this work.
In Tsyro (2003), model calculated annual mean PM10
chemical compositions were compared with data on aerosol chemical characterization synthesized in Putaud et al. (2004). Model predictions of the annual mean concentrations of sec-ondary inorganic aerosols (SIA), namely SO24−, NO−3 and NH+4, were generally in reasonable agreement with the mea-sured concentrations (examples for rural stations are pre-sented in Fig. 1). As expected, the model considerably un-derestimated concentrations of organic carbon (OC) as only primary anthropogenic OC was taken into account in the cal-culations. At some sites, especially in Spain, the model also underestimated mineral dust concentrations because wind blown and re-suspended dust was not implemented in the aerosol model. On the other hand, the uncertainties asso-ciated with anthropogenic PM emissions and, in particular, with their chemical speciation were recognised to be an im-portant source of discrepancies between modelled and mea-sured concentrations of carbonaceous and mineral aerosol components.
It was emphasized that improvement in the quality of PM emission data and its chemical speciation as well as the fur-ther model development to account for all important aerosol components were prerequisites for the accurate modelling of PM chemical composition. However, the question remains:
would the model, providing its adequate calculation of the individual aerosol components, be able of reproducing the monitored PM10 and PM2.5 concentrations? As discussed
above, a part of the unidentified PM mass can probably be attributed to aerosol water. At present, particle-bound wa-ter is not measured operationally at the stations where PM is monitored. If PM mass alone is measured with filter-based gravimetric methods it appears impracticable to derive dry PM mass for appropriate model verification from the mea-sured PM concentrations. Instead, in this work we use the model to estimate the amount of water remaining on parti-cles after the filter conditioning and then, to account for the residual water in calculated PM10and PM2.5concentrations
when comparing them with observations. 4.2 Model calculations of particle-bound water 4.2.1 Annual mean PM water content
Water content of PM10 and PM2.5has been calculated with
the model for the conditions which are required according to the Reference Method for sample equilibration, i.e. temper-ature of 20◦C and relative humidity of 50%. Calculated in
this way PM water content represents particle-bound water (henceforth also referred to as residual water) still present in gravimetric PM10and PM2.5concentrations after the sample
conditioning. Figure 2 shows the maps of model calculated annual mean mass of residual PM10 water and the fraction
of water in “wet” PM10concentrations for 2001. According
to our model simulations, gravimetrically measured annual mean PM10 concentrations can contain between 0.5µg/m3
water in Scandinavia and 6.5µg/m3water in the Netherlands and Belgium. The calculated annual mean mass of residual water associated with PM2.5varies between 0.3 and 5µg/m3.
Fig. 1.Chemical composition of PM10and rural stations: calculated with the EMEP aerosol model vs. measured (from Putaud et al., 2004). In the measurements, ND – denotes the unidentified PM fraction.
the type of mixture of soluble PM constituents. Thus, the geographical distribution of calculated residual aerosol wa-ter reflects the distribution of soluble aerosols, which in the model are sulphate, nitrate, ammonium and sea salt. Organic aerosols have been assumed insoluble. Because secondary inorganic components are mainly in the fine mode the water content of PM10 and PM2.5 is rather similar in most inland
areas. There is a noticeable increase in the mass of particle-bound water found in the coastal areas due to the contribution of sea salt particles.
According to the model estimates, the fraction of resid-ual water varies across Europe between about 20 and 40% (largely 20–30%) in PM10 and between 20 and 35% in
1.0 2.0 3.0 4.0 5.0
2001
PM10 water
20 25 30 35 40
2001
PM10 water frac
Fig. 2.Model calculated(a)mass (inµg/m3) of particle water and(b)water fraction (%) in PM10 (water contributions calculated for 20◦C and 50% RH. Year: 2001).
The lowest fraction of residual water in PM10 mass (below
20%) has been calculated for parts of Russia, where the cal-culated fraction of insoluble primary particles (EC, OC, min-eral dust) in PM10 is largest (30–50%). The calculated
dis-tribution of residual water fraction in PM2.5is rather similar
to that in PM10. The largest differences in water content of
PM10 and PM2.5 are calculated in coastal areas due to the
contribution of water associated with coarse sea salt parti-cles. Our calculations of PM10 and PM2.5 water content at
50% relative humidity seem to be in an agreement with re-sults from other relevant studies (e.g. Neus¨uß et al., 2002) and are believed to be a rather reasonable estimate of resid-ual particle water.
Figure 3 compares the annual mean chemical composition of PM10and PM2.5calculated with the EMEP aerosol model
with measurements at stations in Spain, Austria and Norway. Here, purple colour designates both the undetermined frac-tion in measured PM mass (ND) and the residual particle-bound water in the model results. As expected, model calcu-lated PM10 and PM2.5 concentrations agree better with the
measured values when residual water in PM is accounted for. Figure 3 indicates that the main reason for model under-estimation of PM10 and PM2.5 is its underestimation of the
concentrations of carbonaceous particles and mineral dust in Spain.
At all considered sites, the mass of residual water calcu-lated with the model is smaller than the unaccounted mass in measured PM10and PM2.5(Fig. 3 and Table 2).
Accord-ing to the calculation results, water in PM10 and PM2.5can
explain 30 to 80% of the unaccounted mass. Since aerosol water was not measured at those sites it was impracticable to validate the model calculations of residual PM10and PM2.5
water.
The calculation results in this section suggest the follow-ing:
1. The model seems to give a reasonable estimate of the
mass of water in PM10 and PM2.5at 50% relative
hu-midity. Accurate calculation of the mass of soluble components, in this case SO24−, NO−3 and NH+4, is a prerequisite for the good prediction of water content. 2. The residual particle water can explain a part of the
undetermined PM mass (30–80% according our esti-mates), while the other, more variable part on the unde-termined PM mass is probably due to other factors, e.g. non-C atoms associated with organic aerosols and/or the measurement artefacts (as discussed in Putaud et al., 2004; Yttri, 2003).
However, more measurements on PM mass and chemical composition and, in particular, measurements of particle wa-ter are needed for further testing and verification of those results.
4.2.2 Testing model results with daily data at two Austrian sites
At the sites shown in Fig. 3, the fraction of undetermined PM mass averaged over longer (6–12 months) periods is around 20–35%. However, for daily PM2.5 and PM10 the
unac-counted fraction varied from below 0 to 75–80% (negative values occurred in several cases were probably due to the measurement artefacts). Measurement data with a daily reso-lution on gravimetric PM2.5concentrations and PM2.5
chem-ical composition was only available at two Austrian sites, Vi-enna and Streithofen, for the period 1 May 1999–31 May 2000. We have used these data in order to see if a corre-spondence can be found between daily variations of model calculated PM2.5 water, on the one hand, and PM2.5
unac-counted mass in observations, on the other hand. Below, we present results for 2000, while the analysis and conclusions have been based on the data from both 1999 and 2000.
Table 2.Unaccounted mass in measured PM10and mass of modelled residual aerosol water in PM10(PM2.5at Montseny) and their fractions with respect to the mass of soluble PM (SIA+marine).
Bemantes Monagrega Montseny NO01 AU01 AU02
ND (µg/m3) 3.5 5.86 5.97 1.68 8.43 5.9
ND/soluble PM 0.50 0.78 1.12 0.55 0.73 0.55
Mod. water (µg/m3) 3.01 2.39 2.57 1.13 4.11 3.8
Water/soluble PM 0.47 0.41 0.41 0.39 0.39 0.41
PM10 and PM2.5 chemical composition, Spain
0 5 10 15 20 25
Obs Bemantes
Mod Bemantes
Obs Monagrega
Mod Monagrega
Obs Montseny
Mod Montseny
u
g
/m
3
ND-water other dust SS OC+EC NH4 NO3 SO4
PM10, Birkenes, 2001
0 1 2 3 4 5 6 7
Obs NO01 Mod NO01
u
g
/m
3
PM10, Austria
0 5 10 15 20 25 30 35
Obs AU01 Mod AU01 Obs AU02 Mod AU02
u
g
/m
3
ND(water) other dust SS EC OC NH4 NO3 SO4
1.06.99 -31.05.00 2001 1.06.99 -31.05.00 2001
Fig. 3.Model calculated and measured chemical composition of PM10(PM2.5at Montseny). Here, ND means “not determined PM mass” in measurements and “water” is model calculated particle water (see also explanations in the text).
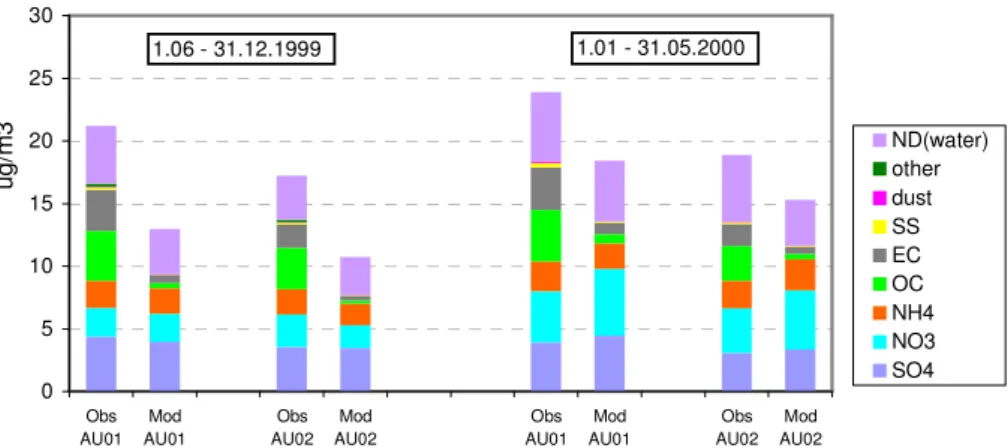
averaged over the period 1 January–31 May 2000, is shown in Fig. 4.
Similar to results for PM10shown in Fig. 3, the largest
dis-crepancy in PM2.5 composition between model results and
measurements is found for carbonaceous particles (Fig. 3), especially for EC, whereas model fine OC compares better with measurements than OC in PM10. The larger
underes-timation of OC mass in PM10 is probably due to coarse
PM2.5 chemical composition, Austria 0 5 10 15 20 25 30 Obs AU01 Mod AU01 Obs AU02 Mod AU02 Obs AU01 Mod AU01 Obs AU02 Mod AU02 u g /m 3 ND(water) other dust SS EC OC NH4 NO3 SO4 1.06 - 31.12.1999 1.01 - 31.05.2000
Fig. 4. Modelled and measured chemical composition of PM2.5at Austrian sites: AU01 (Vienna) and AU02 (Streithofen) averaged over
periods 1 June–31 December 1999 and 1 January–31 May 2000.
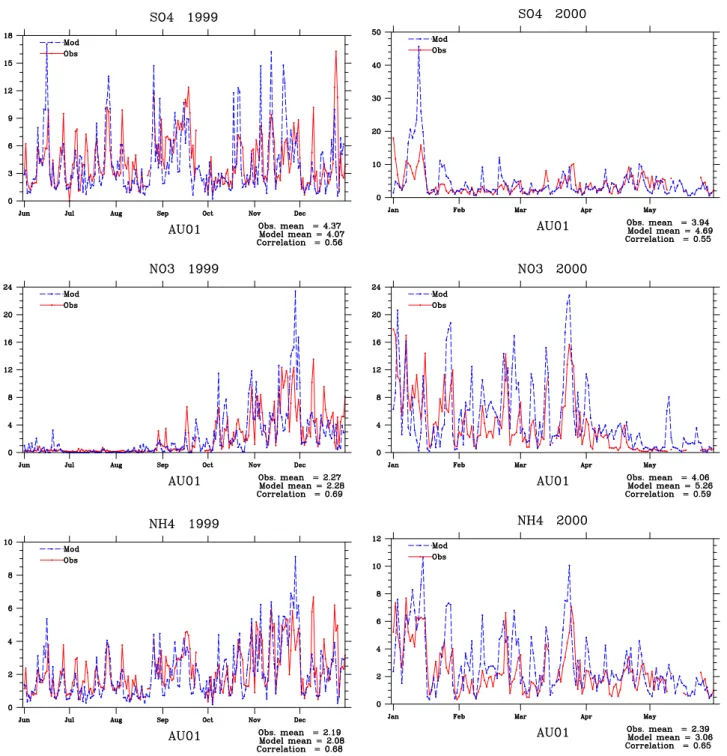
Model calculated concentrations of the main PM2.5
solu-ble components, SO24−, NO−3 and NH+4, compare reasonably well with measurements (Fig. A1 in Appendix). The tem-poral correlation coefficients (R) for daily concentrations in 1999 and 2000 periods vary from 0.54 to 0.56 for SO24−, from 0.59 to 0.69 for NO−3, from 0.62 to 0.68 for NH+4 and from 0.3 to 0.62 for sea salt. The total mass of SIA is simulated correctly by the model; however there are slight discrepancies between calculated and observed contributions of the individual inorganic components. On average, the model slightly underestimates measured sulphate and am-monium concentrations in 1999 and overestimates those in 2000. Calculated average nitrate concentrations are very close to measurements in 1999 and overestimated by about 25–30% in 2000. For 1999, sea salt is under-predicted by the model, while calculations for 2000 are rather close to mea-surements. Based on these verification results for main hy-groscopic components it can be expected that model calcula-tions should give a reasonable estimate of water in measured PM2.5mass.
A rather good correspondence has been found between calculated residual aerosol water and unaccounted PM2.5
mass in 2000 (Fig. 5), with the correlation coefficients R of 0.45 and 0.57 at Vienna and Streithofen sites respectively. On the other hand, for 1999 the corresponding correlation coefficients are 0.32 and 0.17. Notably, the correlations be-tween unaccounted PM2.5 mass and the measured mass of
soluble PM2.5 components (SIA and sea salt) in 2000 are
much higher (0.62 at AU01 and 0.63 at AU02) than in 1999 (0.37 at AU01 and 0.35 at AU02). This may indicate that in 1999 the unaccounted PM mass was to a larger degree asso-ciated with other factors than particle water. In a number of days in 1999, the mass of undetermined PM2.5drops below
zero, which could be attributed to the measurement/analysis uncertainties. Averaged over the whole period, the mass of
model calculated residual water is smaller than the mass of PM2.5 undetermined fraction. However, on some days the
model calculated mass of PM2.5 water exceeds the
unac-counted PM2.5mass. The careful study of calculation results
has revealed that on those days the model overestimates the concentrations of one or several soluble PM2.5constituents,
which consequently results in overestimation of aerosol wa-ter.
As pointed out above, the contribution to organic aerosol mass from elements other than carbon (e.g. hydrogen, oxy-gen, nitrogen) can be one of the sources of unaccounted PM mass in measurements, if OC mass in the identified PM frac-tion is presented as mass of carbon. In Puxbaum et al. (2003), the factors for conversion of organic carbon mass to organic matter (OM) mass of 1.3 and 1.7 were considered appropriate for respectively urban (the Vienna site) and rural (the Strei-thofen site) environments. We have used those conversion factors to derive the total mass of organic aerosol (i.e. OM) in PM2.5and thus account for the unaccounted part of PM2.5
due to non-C atoms in organic particles. Then, the unac-counted PM2.5mass should be largely due to particle-bound
water.
In this case (Fig. 6), the model calculated mass of resid-ual water is somewhat larger than the undetermined PM2.5
mass and the correlation between them is slightly lowered compared to that in Fig. 5. The exceedance of unaccounted PM2.5mass by the model calculated mass of particle water,
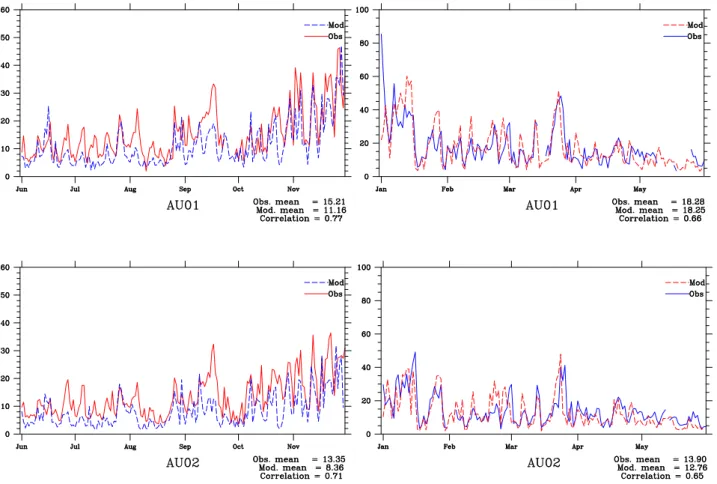
Fig. 5. Daily time-series of model calculated residual water in PM2.5mass (blue dashed line) and the unaccounted (*) PM2.5mass in measurements (red solid line) at AU01 and AU02 for the period 1 July 1999–1 June 2000. (*) Unaccounted part may include non-C atoms associated with organic aerosol.
underestimation of particle water is anticipated due to the model not accounting for the contribution of water associ-ated with organic components Unfortunately, the measure-ment data at those sites were insufficient for more elaborate examination of the results.
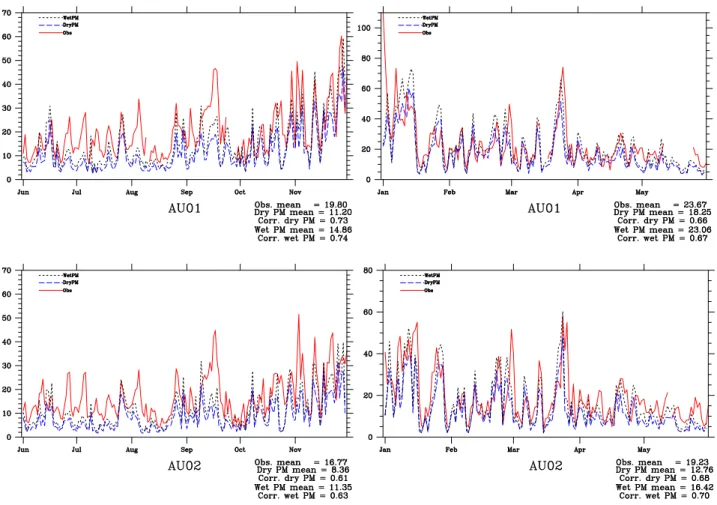
As shown in Fig. 7, model calculated “wet” PM2.5 con-centrations (i.e. including aerosol water) are closer to the observed levels of PM2.5. Moreover, the model accounting for aerosol water has somewhat improved the correlation be-tween calculated and measured PM2.5. On the other hand, modelled “dry” PM2.5 concentrations agree quite well with the identified mass of measured PM2.5, i.e. the mass of all chemically identified components (Fig. 8).
Summarising, the correspondence, found between calcu-lated particle water and the unaccounted fraction of gravi-metric PM2.5 mass measured at the Austrian sites, supports a common explanation that a part of unaccounted PM2.5 mass is due to particle-bound water. According to our cal-culations, the unaccounted fraction of PM2.5 mass contains rather a considerable amount of water; however, there are indications that the model may overestimate particle water (Fig. 6). Moreover, there is a considerable daily variability
of the difference between calculated PM2.5 water and PM2.5 unaccounted mass, which is probably due to random sam-pling artefacts affecting the fraction of unidentified PM mass. 4.3 Comparison of model calculated wet PM10 and PM2.5
with EMEP observations
PM10and PM2.5monitoring data from the EMEP data base
have been used in the evaluation of EMEP model perfor-mance. Within the EMEP network, gravimetric methods for determining PM mass are employed at all stations. There-fore, it is reasonable to assume that measured PM2.5 and
PM10concentrations include particle-bound water.
To derive “wet” PM concentrations, model calculated residual particle water has been added to the dry PM mass. PM10and PM2.5concentrations including particle water are
believed to be more consistent with PM10 and PM2.5
con-centrations determined gravimetrically (or with the equiv-alent methods). Model calculated annual mean PM10 and
PM2.5 concentrations have been compared with EMEP
ob-servations in 2000–2001. The bias in model calculated PM10
and PM2.5 concentrations, both dry and including particle
Fig. 6. Daily time-series of model calculated residual water in PM2.5mass (blue dashed line) and the unaccounted (*) PM2.5mass in measurements (red solid line) at AU01 and AU02 for the period 1 July 1999–1 June 2000. (*) OC is converted to OM and included in the identified part. Then, the unaccounted part is largely due to particle water.
As expected, accounting for residual water in calculated PM concentrations has decreased the model underestimation of measured PM10and PM2.5. It can be noted that the larger
negative bias in 2001 compared to 2000 is due to the consid-erable underestimation of PM10concentrations by the model
at Spanish sites, which were firstly reported in 2001. As it was explained above, the model not accounting for secondary organic aerosol and natural dust is a plausible reason for PM under-prediction in Spain.
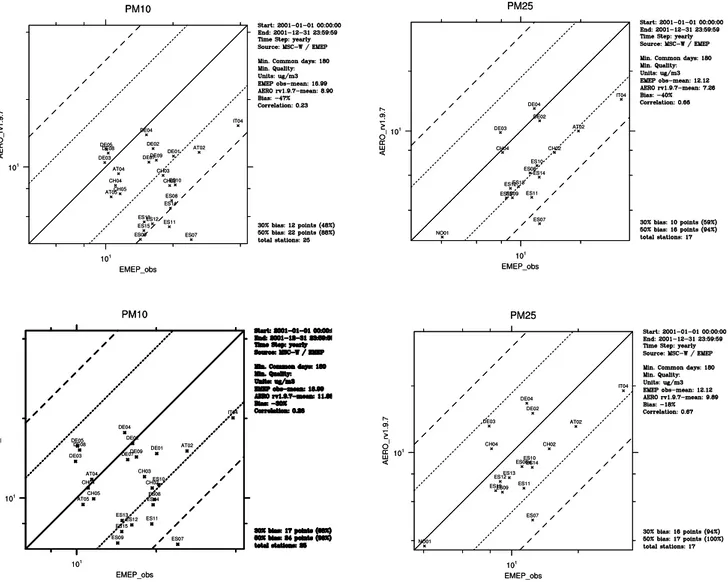
Scatter-plots of calculated versus measured PM10 and
PM2.5concentrations at EMEP sites are presented in Fig. 9.
The upper panels show results for modelled dry PM10 and
PM2.5 concentrations and the lower panels show
compar-isons for wet PM10and PM2.5, i.e. including aerosol water.
The scatter-plots show that calculated concentrations of PM including aerosol water agree better with the measured values, but the model still underestimates PM10 and PM2.5
at most of the sites. The underestimation is expected to be further reduced when all aerosol sources are included in the model. Overestimation by the model of annual mean PM10
and PM2.5 concentrations at several mountain sites (DE03,
DE05, DE08, CH04 and CH05) is due to its
overestima-Table 3. The annual mean bias of model calculated PM10 and PM2.5, dry and including particle water (wet), as compared to
EMEP measurements in 2000 and 2001.
Bias for 2000 (%) Bias for 2001 (%) Dry mass Wet mass Dry mass Wet mass
PM10 −33 −13 −49 −33
PM2.5 − − −43 −24
tion of winter aerosol concentrations at those sites, when they are in the free troposphere. The particle water content will be overestimated as a consequence of the overestima-tion of PM mass. Unfortunately, no appropriate measure-ments of PM individual components and water were avail-able for further checking of the results (the only relevant data was SO4 measurements at DE03 (Schauinsland,
Fig. 7. Time-series of daily concentrations of model calculated dry PM2.5 mass (blue dashed line), wet PM2.5(black dashed line) and measured PM2.5(red solid line) at AU01 and AU02 for the period 1 July 1999–1 June 2000.
As expected, accounting for aerosol water in the model has not improved the spatial correlation between calculated and measured PM10 and PM2.5.
Comparison of modelled daily PM10and PM2.5with
mea-surements at EMEP sites shows that accounting for particle-bound water in calculated PM mass has resulted in certain improvement of the model results (Tables A1 and A2 in Appendix). Calculated PM10 and PM2.5concentrations
in-cluding aerosol water are closer to the measured values and the correlation at most of the stations is somewhat better compared to that for calculated dry PM. However at some Spanish sites, the correlation between model and measured PM10 and PM2.5becomes slightly poorer when particle
wa-ter in PM is accounted for. This can feasibly result from the model’s inaccurate prediction of the daily variation of PM chemical composition and hence particle water content at those sites, which was impossible to check due to the lack of necessary measurements.
Another reason for worsened correlation between calcu-lated wet PM and observations can be that aerosol water is calculated using the same conditions (20◦C and 50%) for all
days and at all sites. Thus, the calculated aerosol water
con-tent is determined solely by PM chemical composition, while particle water mass on dust loaded filters will also be affected by the differences in sampling procedures or transportation, storing and weighing of filters.
Fig. 8. Time-series of daily concentrations of model calculated dry PM2.5mass (blue dashed line) and the identified PM2.5mass in mea-surements (red solid line) at AU01 and AU02 for the period 1 July 1999–1 June 2000.
5 Conclusions
In this work, we have addressed the issue of particle-bound water in gravimetrically measured PM mass. Available data on PM chemical analyses show that significant fractions of PM2.5 and PM10 mass remain unidentified. The EMEP
aerosol model has been used to estimate to what extent par-ticle water can explain the unaccounted PM mass. We also examine to what extend the particle water can explain dis-crepancies between modelled and gravimetrically measured PM10 and PM2.5. For this purpose, we attempt to account
for particle water in model calculated PM concentrations to assure their more consistent comparison with observations.
The mass of aerosol water in PM10and PM2.5
concentra-tions has been calculated with the aerosol model for filter cal-ibration conditions required by CEN standard (i.e. 50% RH and temperature 20◦C). The calculated annual mean fraction of water in PM10and PM2.5varies between 20 and 35% over
Europe, depending on the mass and the type of mixture of soluble PM components. At 6 stations in Austria, Norway and Spain, where data on PM10 or PM2.5chemical
compo-sition was available, the model estimates that particle water
can explain between 30 and 80% of the unaccounted mass in measured PM10and PM2.5concentrations. In this case, a part
of the unaccounted PM mass consists of non-C atoms associ-ated with organic aerosol, as measured organic carbon were not converted to organic matter because molecular-to-carbon mass ratios were unknown.
Model calculations have been tested with data at two Aus-trian stations in Vienna and Streithofen, where daily data on PM2.5 chemical composition was available for the period 1
June 1999–31 May 2000. The temporal correlation coef-ficients between calculated aerosol water and unaccounted PM2.5 mass are respectively 0.45 and 0.57 in 2000, what
suggests that aerosol water is responsible for a significant part of the unaccounted PM2.5mass at those sites. On the
other hand, during the measurement period in 1999, when factors other than particle water appear to determine the un-accounted PM2.5 mass, the correlation between calculated
aerosol water and undetermined mass is much lower (R=0.35 and 0.17).
According to our model estimates, particle water explains up to 75–80% of undermined PM2.5fraction at the Austrian
Fig. 9.Scatter-plots for PM10and PM2.5monitored at EMEP sites in 2001 versus model calculated: dry PM10and PM2.5(upper panel) and PM10and PM2.5with particle water accounted for (lower panel).
PM10 chemical composition
0 5 10 15 20 25 30
Chaumond mod
Chaumond obs
Monagrega mod
Monagrega obs
Illmitz mod
Illmitz obs
u
g
/m
3 ND
dust sea salt EC OC NH4 NO3 SO4
Fig. A2.Comparison of model calculated daily concentrations of secondary inorganic aerosols with observations at AU02 (Streithofen) for the period 1 June 1999–31 May 2000. Units:µg/m3.
mass, the calculated water exceeds unaccounted PM2.5 mass in some days. It can probably be due to overestimation of molecular-to-carbon mass ratio in those days. It is also pointed out that due to the assumption that aerosols exist in a liquid phase, the model may overestimate the aerosol wa-ter content in PM samples collected at low relative humidity conditions. On the other hand, the contribution from water associated with organic aerosols has not been included in the calculations. Unfortunately, the proper validation of model calculated PM water content was unfeasible as no measure-ments of particle water were available at those sites.
Furthermore, it is shown that at both of the Austrian sites calculated daily PM2.5concentrations agree better with
mea-surements when the model accounts for aerosol water in PM mass, both with respect to mean values and temporal corre-lations. These results suggest that particle water should be taken in to account when comparing model calculated PM with gravimetrically measured PM mass. It should also be pointed out that the calculated dry PM2.5 mass is found to
agree rather well with the PM2.5 identified mass measured
Table A1. Validation of model calculated daily PM10 concentrations (µg/m3) against measurements at EMEP stations in 2001: for dry PM10and wet PM10.
Sites Obs. Mod. mean Corr. (R) Mod. mean Corr. (R) Mean dry PM10 dry PM10 PM10+ water PM10+ water
DE01 Westerland 20.13 10.48 0.76 13.16 0.77
DE02 Langenbr¨ugge 16.30 11.41 0.66 15.02 0.68
DE03 Schauinsland 9.92 9.88 0.23 12.89 0.27
DE04 Deuselbach 15.21 11.22 0.51 14.58 0.55
DE05 Brotjacklriegel 10.08 11.74 0.19 15.29 0.21
DE07 Neuglobsow 15.62 9.82 0.69 12.95 0.71
DE08 Schm¨ucke 10.26 11.15 0.20 14.48 0.22
DE09 Zingst 16.86 9.99 0.77 12.96 0.81
CH02 Payerne 19.34 8.23 0.45 10.63 0.46
CH03 Taenikon 18.06 9.00 0.50 11.68 0.51
CH04 Chaumont 11.08 8.24 0.37 10.65 0.42
CH05 Rigi 11.61 7.48 0.46 9.61 0.50
AT02 Illmitz 26.21 11.05 0.59 14.30 0.59
AT04 St. Koloman 11.42 9.49 0.28 11.77 0.33
AT05 Vorhegg 10.60 7.08 0.40 8.95 0.48
IT04 Ispra 39.06 14.00 0.45 17.43 0.44
ES07 Viznar 24.17 5.44 0.41 6.76 0.35
ES08 Niembro 19.72 6.67 0.27 9.10 0.21
ES09 Campisabalos 14.20 4.85 0.15 6.67 0.17
ES10 Cabo de Creus 20.48 7.33 0.20 9.17 0.18
ES11 Barcarrota 19.15 5.67 0.42 7.65 0.36
ES12 Zarra 16.18 5.40 0.26 7.23 0.27
ES13 Penausende 14.59 5.73 0.31 7.90 0.30
ES14 Els Torms 19.48 6.45 0.39 8.66 0.41
ES15 Risco Llano 14.82 5.55 0.02 7.40 −0.01
NO01 Birkenes 6.08 3.38 0.50 4.38 0.51
Table A2. Validation of model calculated daily PM2.5concentrations (µg/m3)against measurements at EMEP stations in 2001: for dry
PM2.5and wet PM2.5.
Sites Obs. Mod. mean Corr. (R) Mod. mean Corr. (R) Mean dry PM2.5 dry PM2.5 PM2.5+ water PM2.5+ water
AT02 Illmitz 19.54 9.61 0.56 12.57 0.56
DE02 Langenbr¨ugge 12.46 10.69 0.68 14.25 0.69
DE03 Schauinsland 7.93 9.22 0.12 12.30 0.15
DE04 Deuselbach 11.71 10.77 0.56 14.17 0.59
CH02 Payerne 14.80 7.45 0.46 9.85 0.47
CH04 Chaumont 8.12 7.46 0.36 9.87 0.41
IT04 Ispra 32.01 12.91 0.43 16.32 0.42
ES07 Viznar 12.46 3.98 0.39 5.30 0.37
ES08 Niembro 11.16 5.82 0.41 8.18 0.34
ES09 Campisabalos 9.02 4.68 0.19 6.58 0.21
ES10 Cabo de Creus 12.09 5.93 0.33 7.78 0.29
ES11 Barcarrota 11.36 4.82 0.44 6.80 0.39
ES12 Zarra 8.89 4.97 0.38 6.82 0.40
ES13 Penausende 9.70 5.25 0.46 7.46 0.46
ES14 Els Torms 12.41 5.79 0.49 7.99 0.50
ES15 Risco Llano 8.46 4.87 0.08 6.67 0.05
Finally, model calculated PM10 and PM2.5concentrations
including aerosol water have been compared with PM mea-surements from the EMEP database. Accounting for aerosol water in calculated PM10 and PM2.5 has considerably
re-duced the model underestimation of measured PM10 and
PM2.5 concentrations, as compared with the previous
veri-fication results for model calculated dry PM concentrations. Compared with measurements at EMEP sites in 2000 and 2001, model underestimation of annual mean PM10 has
de-creased from 33–56 % to 13–42 %, and of annual mean PM2.5 from 43 to 24 %. Another important result is that
the model accounting for particle water has increased the temporal correlation between calculated and measured daily PM10 and PM2.5concentrations at most of the EMEP sites.
The exception is Spanish sites where the effect of wind blown dust would need to be accounted for in order to improve the model PM calculations.
Summing up, is has been shown that accounting for parti-cle water in modelled PM could explain a half of the model underestimation of PM10 and PM2.5 in comparison with
gravimetric measurements. However, there are caveats to the model estimates of particle-bound water as no verification of the calculated water content is presently available due to the lack of measurement data. Verification of particle water calculations in the EMEP aerosol model will be carried out as new measurements of PM chemical composition, parti-cle water and PM mass at different relative humidity become available.
Acknowledgements. We are grateful to S. Metzger for providing EMEP/MSC-W with the EQSAM model. Measurements on PM chemical composition were made available to us from the Austrian AUPHEP project and from database of the Spanish Ministry of En-vironment. The author particularly thanks L. Tarras´on, H. Fagerli and D. Simpson at the Norwegian Meteorological Institute for the constructive discussions during this work and for their comments on the draft version of the manuscript.
Edited by: J. Brandt
References
Andersson-Sk¨old, Y. and Simpson, D.: Secondary organic aerosol formation in Northern Europe: a model study, J. Geophys. Res., 106 (D7), 7357–7374, 2001.
Balasubramanian, R., Qian, W.-B., Decesari, S., Facchini, M. C., and Fuzzi, S.: Comprehensive characterisation of PM2.5
aerosols in Singapore, J. Geophys. Res., 108, D16, 4523, doi:10.1029/2002JD002517, 2003.
Berndt, T., B¨oge, O., Conrath, T., Stratmann, F., and Heintzenberg, J.: Formation of new particles in the system H2SO4(SO3)/H2O/(NH3) – first results from a flow-tube study, J. Aerosol Sci., 31, Suppl. 1, S554–S555, 2000.
Chang, C. T. and Tsai, C. J.: A model for the relative humidity effect on the reading of the PM10beta-gauge monitor, J. Aerosol Science, 34, 1685–1697, 2003.
Chang, C. T., Tsai, C. J., Lee, C. T., Chang, S. Y., Cheng, M. T., and Cheng, H. M.: Differences in PM10concentrations measured by beta-gauge monitor and hi-vol sampler, Atmos. Environ., 35, 5741–5748, 2001.
EC: Council Directive 1999/30/EC of April 1999 relating to limit values for sulphur dioxide, nitrogen dioxide and oxides of ni-trogen, particulate matter and lead in ambient air, available on: http://europa.eu.int/comm/environment/air/ambient.htm, Of-ficial Journal L 163, 0041–0060, 1999.
EMEP/CCC: EMEP Manual for Sampling and Analysis, EMEP/CCC Report 1/95, Revision, http://www.nilu.no/ projects/ccc/manual/index.html, 2001.
EN 12341: Air Quality – Determination of the PM10 fraction of suspended particular matter – Reference method and field test procedure to demonstrate equivalence of measurement methods, 1998.
Fitzgerald, J. W.: Dependence on the supersaturation spectrum of CCN on aerosol size distribution and composition, J. Atmos. Sci., 30, 628–634, 1973.
Matta, E., Facchini, M. c., Decesari, S., Mirce, M., Cavalli, F., Fuzzi, S., Putaud, J.-P., and Dell’Acqua, A.: Mass closure on the chemical species in size-seggregated atmospheric aerosol col-lected in an urban are of Po Valley, Italy, Atmos. Chem. Phys., 3, 623–637, 2003,
SRef-ID: 1680-7324/acp/2003-3-623.
Metzger, S.: Gas/Aerosol partitioning: a simplified method for global modelling, PhD thesis, University Utrecht, http://www. library.uu.nl/digiarchief/dip/diss/1930853/inhoud.htm, 2000. Metzger, S., Dentener, F., Pandis, S., and Lelieveld, J.: Gas/Aerosol
Partitioning 1: A computationally efficient model, J. Geophys. Res., 107 (D16), 10.1029/2001JD001102, 2002a.
Metzger, S., Dentener, F., Krol, M., Jeuken, A., and Lelieveld, J.: Gas/aerosol partitioning 2. Global modeling results, J. Geophys. Res., 107 (D16), 10.1029/2001JD001103, 2002b.
Monahan, E. C., Spiel, D. E., and Davidson, K. L.: A model of marine aerosol generation via white caps and wave disruption, in: Oceanic Whitecaps, edited by: Monahan, E. C. and Mac-niochaill, G., Dordrecht, Reidel, 167–193, 1986.
M˚artensson, E. M., Nilsson, E. D., de Leeuw, G., Cohen, L. H., and Hansson, H.-C.: Laboratory simulations and parameterisation of the primary marine aerosol production, J. Geophys. Res., 108 (D9), doi:10.1029/2002JD002263, 2003.
Neus¨uß, C., Wex, H., Birmili, W., Wiedensohler, A., Koziar, C., Busch, B., Br¨uggemann, E., Gnauk, T., Ebert, M., and Covert, D. S.: Characterization and parameterization of atmospheric aerosol number-, mass-, and chemical size distributions in central Eu-rope during LACE 98 and MINT, J. Geophys. Res., 107 (D21), 10.1029/2000JD000514, 2002.
Pirjola, L., Tsyro, S. G., Tarrason, L., and Kulmala, M.: A monodis-prse aerosol dynamics module, apromising candidate for use in long-range transport models: Box model tests, J. Geophys. Res., 108, D9, 4258, doi:10.1029/2002JD002867, 2003.
Querol, X., Rodriguez, S., Schneider, J., Spindler, G., ten Brink, H., Tørseth, K., and Wiedensohler, A.: A European Aerosol Phe-nomenology – 2: chemical characteristics of particulate matter at kerbside, urban, rural, and background sites in Europe, Atmos. Environ., 38, 2579–2595, 2004.
Puxbaum, H., Gomiˇs`eek, B., Kalina, M., Bauer, H., Salam, A., Stopper, S., Preining, O., and Hauck, H.: A dual site study of PM2.5 and PM10 aerosol chemistry in the larger region of Vi-enna, Austria, Atmos. Environ., 38, 3903–4089, 2004.
Rodr´ıguez, S., Querol, X., Alastuey, A., Kallos, G., and Kakaliagoi, O.: Saharan dust contributions to PM10and TSP levels in South-ern and EastSouth-ern Spain, Atmos. Environ., 35, 2433–2447, 2001. Rodr´ıguez, S., Querol, X., Alastuey, A., and Plana, F.: Sources
and processes affecting levels and composition of atmospheric aerosol the western Mediterranean, J. Geophys. Res., 107, D24, 4777, doi:10.1029/2001JD001488, 2002.
Schwela, D., Morawska, L., and Kotzias, D. (Eds): Guidelines for Concentrations and Exposure-Response Measurement of Fine and Ultra Fine Particulate Matter for use in Epidemiological Studies, EC JRC & WHO, EUR 20238 EN, 2002.
Simpson, D., Fagerli, H., Jonson, J. E., Tsyro, S. G., Wind, P., and Tuovinen, J.-P.: Transboundary Acidification, Eutrophica-tion and Ground Level Ozone in Europe, Part I. Unified EMEP Model Description. EMEP/MSC-W Status report 1/2003 Part I, Norwegian Meteorological Institute, Oslo, Norway, http://www. emep.int, 2003.
Simpson, D. and Makar, P.: Modelling SOA and OC in Europe, In: Transboundary Particulate Matter in Europe, edited by Torseth, K., EMEP Status Report 4/2004, Norwegian Institute for Air Re-seach, Kjeller, Norway, http://www.emep.int, 2004.
Stokes, R. H. and Robinson, R. A.: Interactions in aqueous nonelec-trolyte solutions, 1. Solute solvent equilibria, J. Phys. Chem., 70, 2126–2123, 1966.
TNO: The Co-ordinated European Programme on Particulate Mat-ter emission Inventories, Projections and Guidance (CEPMEIP) database (available at http://www.air.sk/tno/cepmeip/), 2001. Tsyro, S. G.: First estimates of the effect of aerosol dynamics in the
calculation of PM10 and PM2.5. EMEP/MSC-W Note 4/2002, Norwegian Meteorological Institute, Oslo, Norway, http://www. emep.int, 2002.
Tsyro, S. G.: Model performance for particulate matter. In: EMEP Status report 1/2003. Transboundary acidification, eutrophica-tion and ground ozone level, Part II: Unified EMEP model perfor-mance. EMEP/MSC-W Status report 1/2003 Part II, Norwegian Meteorological Institute, Oslo, Norway, http://www.emep.int, 2003.
Tsyro, S. G.: Model assessment of particulate matter in Europe in 2002, In: Transboundary Particulate Matter in Europe, edited by Torseth, K., EMEP Status Report 4/2004, Norwegian Institute for Air Reseach, Kjeller, Norway http://www.emep.int, 2004. Tsyro, S. G., Tarras´on, L., and Kahnert, M.: Physical
character-isation of particulate matter across Europe in 2000 and 2001. In: Kahnert and Tarrason (eds.) Transboundary particulate matter in Europe. EMEP Status report 4/2003, EMEP/CCC & MSC-W & CIAM Status Report 4/2003, Norwegian Institute for Air Re-search, Kjeller, Norway, http://www.emep.int, 2003.
Vestreng, V.: Review and revision, Emission data reported to CR-TAP. Oslo, Norwegian Meteorological Institute, EMEP Status Report 2003, Technical Report 2003, Meteorological Synthesiz-ing Centre – West, Norwegian Meteorological Institute, Oslo, Norway, http://www.emep.int, 2003.
Warneck, P.: Chemistry of the natural Atmosphere, Academic Press, USA, 2000.
Winkler, P. and Junge, C. E.: The growth of atmospheric aerosol particles as a function of the relative humidity, Part 1, Method and measurements at different locations, J. Rech. Technology, 12, 822–826, 1972.
Yttri, K. E.: PM10mass concentrations at Birkenes during 2002, In: Measurements of particulate matter, edited by Kahnert, M., Sta-tus report 2003, EMEP/CCC Report 5/2003, Norwegian Institute for Air Research, Kjeller, Norway, http://www.emep.int, 2003. Yttri, K. E. and Tørseth, K.: Chemical characterisation and mass
concentration of ambient aerosol at the EMEP site in Birkenes (Southern Norway) – A one-year study, EMEP/CCC Report 4/2002, Norwegian Institute for Air Research, Kjeller, Norway, http://www.emep.int, 2002.
Zappoli, S., Andracchio, A. Fuzzi, S., Facchini, M. C., Gelencser, A., Kiss, G., krivacsy, Z., Molnar, A., Meszaros, E., Hansson, H.-C., Rosman, K., and Zebuhr, Y.: Inorganic, organic and macro-molecular components of fine aerosol in different areas of Europe in relation to their water solubility, Atmos. Environ., 33, 2733– 2743, 1999.