www.ann-geophys.net/27/2799/2009/
© Author(s) 2009. This work is distributed under the Creative Commons Attribution 3.0 License.
Annales
Geophysicae
Phase-coded pulse aperiodic transmitter coding
I. I. Virtanen1, J. Vierinen2, and M. S. Lehtinen2
1Department of Physics, University of Oulu, P.O. Box 3000, 90014 Oulu, Finland 2Sodankyl¨a Geophysical Observatory, 99600, Sodankyl¨a, Finland
Received: 16 February 2009 – Accepted: 18 June 2009 – Published: 14 July 2009
Abstract. Both ionospheric and weather radar communities
have already adopted the method of transmitting radar pulses in an aperiodic manner when measuring moderately over-spread targets. Among the users of the ionospheric radars, this method is called Aperiodic Transmitter Coding (ATC), whereas the weather radar users have adopted the term Si-multaneous Multiple Pulse-Repetition Frequency (SMPRF). When probing the ionosphere at the carrier frequencies of the EISCAT Incoherent Scatter Radar facilities, the range extent of the detectable target is typically of the order of one thou-sand kilometers – about seven milliseconds – whereas the characteristic correlation time of the scattered signal varies from a few milliseconds in the D-region to only tens of mi-croseconds in the F-region. If one is interested in estimat-ing the scatterestimat-ing autocorrelation function (ACF) at time lags shorter than the F-region correlation time, the D-region must be considered as a moderately overspread target, whereas the F-region is a severely overspread one. Given the technical restrictions of the radar hardware, a combination of ATC and phase-coded long pulses is advantageous for this kind of target. We evaluate such an experiment under infinitely low signal-to-noise ratio (SNR) conditions using lag profile inversion. In addition, a qualitative evaluation under high-SNR conditions is performed by analysing simulated data. The results show that an acceptable estimation accuracy and a very good lag resolution in the D-region can be achieved with a pulse length long enough for simultaneous E- and F-region measurements with a reasonable lag extent. The new experiment design is tested with the EISCAT Tromsø VHF (224 MHz) radar. An example of a full D/E/F-region ACF from the test run is shown at the end of the paper.
Keywords. Ionosphere (Instruments and techniques) –
Ra-dio science (Ionospheric physics)
Correspondence to:I. I. Virtanen ([email protected])
1 Introduction
The simplest design of a radar experiment is to transmit short pulses at equal inter-pulse periods (IPP) between the pulses, i.e. to use a uniform pulse-repetition frequency (PRF). To cover the whole range extent of the target, the IPP must be larger than or equal to the roundtrip time of the signal to and from the furthermost target range. Thus, the range extent of the target sets an upper limit for the PRF. A radar target is called overspread if its scattering spectrum is wider than the largest possible uniform PRF.
Severely overspread radar targets, whose scattering spec-trum is much wider than the largest possible PRF, can be sufficiently sampled by only measuring lag values clearly shorter than the signal roundtrip time to and from the tar-get. They can be efficiently measured using long, possibly phase-coded pulses. Alternatively, a group of short pulses can be transmitted with short gaps between the pulses. Dif-ferent techniques for measuring the severely overspread tar-gets based on these ideas have been presented by several au-thors (e.g. Farley, 1969, 1972; Sulzer, 1986a,b; Lehtinen and H¨aggstr¨om, 1987; Sulzer, 1993).
An opposite to the severely overspread targets are the un-derspread ones. Their scattering spectrum is much narrower than the PRF and they can be sufficiently sampled with a lag resolution lower than the signal roundtrip time to and from the furthermost target range. Thus, the underspread targets can be measured with uniformly spaced pulses, in the sim-plest situation with a pulse length corresponding the desired range resolution.
A novel method for measuring moderately overspread radar targets has been presented by Uppala and Sahr (1994). The method, called Aperiodic Transmitter Coding (ATC), is based on transmitting the radar pulses in an aperiodic man-ner, which enables the estimation of the pulse-to-pulse corre-lations with a lag resolution higher than the target range ex-tent. The method has already been proven to be advantageous when studying the equatorial spread F (Hysell and Chau, 2004; Chau et al., 2004; Hysell et al., 2008a). The same method is in use with weather radars, where it is used as a so-lution for the so-called range-Doppler dilemma and is known under the name Simultaneous Multiple Pulse-Repetition Fre-quency (SMPRF) (Pirttil¨a et al., 2005). Furthermore, aperi-odic pulsing has been used for a long time in the so-called “Staggered PRF” method of Moving Target Identification (MTI) radars (e.g. Skolnik, 1990; Schleher, 1991), but with considerably different data analysis due to a totally different kind of a target than presented in this paper.
In the altitude interval from 50 km to 1000 km, which is roughly the interval routinely detectable with the EIS-CAT incoherent scatter radar facilities, the correlation time of the scattered signal has large variations. In the D-region altitudes, the signal correlates over several milliseconds, whereas the first zero of an F-region ACF is typically around one hundred microseconds when measured with the VHF radar. The time taken for an electromagnetic pulse to travel from the ground level to the 50 km range and back is less than half a millisecond, which is much less than the expected correlation time at the D-region altitudes. Thus, it is not pos-sible to measure the D-region with an experiment consisting of pulses longer than the correlation time of the scattered sig-nal.
If one is only interested in lag values longer than the longest correlation times in the F-region, the D-region can be considered as an underspread target and measured with an experiment consisting of pulses transmitted with short uni-form time intervals. With this kind of arrangements, a suf-ficient lag resolution of about one millisecond can be easily achieved. However, the experimenter is usually also inter-ested in measuring the short lags to obtain reliable estimates of the actual backscatter power. Thus, it would be desir-able to combine the aperiodic transmitter coding and the long phase-coded pulses in a way allowing the estimation of both the short F-region correlations and the long D-region corre-lations from the same data.
In a preliminary paper (Virtanen et al., 2008b), incoherent scatter radar experiments with phase-coded pulses transmit-ted in an aperiodic manner were introduced. The phase cod-ing allowed accurate measurements of the short intra-pulse lags, which are necessary for the E- and F-regions of the ionosphere. By using several different inter-pulse periods, it was possible to cover a continuous range interval larger than the longest IPP, but still measure also the pulse-to-pulse correlations needed for the D-region analysis with a suffi-cient lag resolution. The experiments were successful in the
sense that it was possible to analyse the data with lag pro-file inversion (Virtanen et al., 2008a; Damtie et al., 2002), but the actual estimation accuracies of the experiments were not evaluated at all. The IPPs were also chosen in a rather arbitrary way, leading to large differences in the experiment efficiencies at different ranges.
In this paper, experiments combining the simple differ-ence cover codes presented in Uppala and Sahr (1994) and long phase-coded pulses are introduced and evaluated. Some other ATC codes are better in a certain sense and published in both Uppala and Sahr (1994) and in Uppala and Sahr (1996), but we are willing to use the simple difference cover codes to be able to fill the large duty cycle (12.5%) of the EIS-CAT mainland radars. For a more detailed discussion of simple difference covers, see Clinger and Van Ness (1976). The simple difference cover codes also help us to get a uni-form lag resolution for the pulse-to-pulse lags and to keep the experiment efficiency about equal at all ranges. We will adopt the name Phase-coded Pulse Aperiodic Transmit-ter Coding (PPATC) for the new experiments to underline the differences between the basic ATC experiments without phase coding and the method of alternating the phases of the whole pulses as proposed by Chau et al. (2004). The PPATC method is also different from the combination of alternating codes and multipulse codes (Nygr´en et al., 1996), because our aim is to estimate all lag values, including the intra-pulse lags shorter than the pulse length and arbitrarily long pulse-to-pulse lags. The continuous cycle of the ATC coding, with several pulses inside the target at all instances of time, is also considerably different from the separated pulse groups of the multipulse codes used in Nygr´en et al. (1996).
We will demonstrate how ATC and phase-coded pulses may be combined to make the experiment approximately equally efficient at all target ranges. The problem of select-ing phase codes suitable for the PPATC experiments is also shortly discussed. Finally, a PPATC experiment is evaluated and compared to other experiments for both low and high SNR using lag profile inversion and simulated data. A test run of the experiment has also been performed with the EIS-CAT VHF (224 MHz) radar. A sample ACF from this experi-ment is shown at the end of the paper.
2 Filling the radar duty cycle
Table 1. Relative lengths of the N inter-pulse periods of simple difference covers of lengthN.
N relative IPPs
2 1:2
3 1:2:4
4 1:2:6:4 1:3:2:7
5 1:3:10:2:5
6 1:7:3:2:4:14 1:3:6:2:5:14 1:3:2:7:8:10 1:2:5:4:6:13 1:2:7:4:12:5
8 1:4:22:7:3:6:2:12 1:6:12:4:21:3:2:8 1:4:2:10:18:3:11:8 1:3:5:11:2:12:17:6 1:3:8:2:16:7:15:5 1:2:10:19:4:7:9:5
9 1:4:7:6:3:28:2:8:14 1:11:8:6:4:3:2:22:16 1:6:4:24:13:3:2:12:8 1:2:4:8:16:5:18:9:10
1. The high radar duty cycle and target range extent of sev-eral hundred kilometers would lead to largetp, i.e. long transmission pulses. For this reason, the leading edge of the pulse has already passed the lower ionosphere at the time when signal reception is started. Thus, the amount of echo samples with contribution from each range – the radar efficiency – is low in the D- and E-regions with re-spect to the high efficiency in the F-region.
2. The inter-pulse periodti, when calculated in this way, is usually larger than sufficient for the D-region pulse-to-pulse correlation measurements.
Due to the problems mentioned, the EISCAT experiments are usually roughly divided into F-region, E-region and D-region experiment groups. The F-region experiments are based on long pulses with long IPPs, and therefore rather inefficient in the D- and E-regions. In contrast, the D- and E-region exper-iments are using shorter pulses and shorter IPPs, assuming that the echoes from above the one-IPP range will either be insignificant or will have noise-like behaviour in the decod-ing process. The assumptions may be well justified in most cases but, if not carefully taken into account in experiment design, the F-region echoes still have the capability of bias-ing the decoded lag profiles.
A well-known and very beneficial way to avoid problems with unwanted echoes is to divide the transmissions into
sev-0.00 0.01 0.02 0.03 0.04 0.05 0.06 0.07
0
100
200
300
400
absolute radar efficiency
roundtrip time
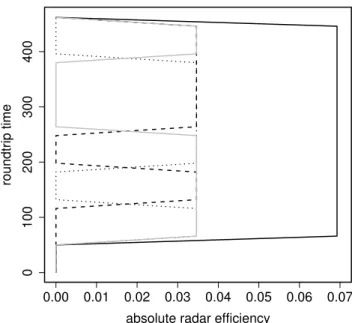
Fig. 1. The absolute radar efficiency of zero-lag of a PPATC ex-periment with a pulse length of 16 units and three different IPPs (66, 132 and 264 units). The dashed, dotted and grey lines are the efficiencies of the three individual pulses. The solid black line is the total efficiency of the experiment. A time period of 50 units, in addition to the pulse length, is assumed to be lost during each transmission.
eral frequency channels. This method definitely solves the problem in the cases of the severely overspread E- and F-regions but, simultaneously, removes the possibility of pulse-to-pulse correlation measurements in the moderately over-spread D-region, because the signals at different frequencies do not correlate. Recently, Raizada et al. (2008) have also used a method of subtracting the F-region contribution, mea-sured with a different experiment, from D-region IS spectra. In Virtanen et al. (2008b), we demonstrated the idea of transmitting rather short pulses in the same frequency with non-uniform IPPs. Data from such experiments was possible to analyse, but the experiment efficiency, the number of in-dependent lagged products collected, had large variations as a function of range. The pulse-to-pulse lags provided by the experiments were also rather arbitrarily spread over a large number of lag values, making the data unnecessarily compli-cated to use.
the pulse separations (IPPs), because it then follows more closely the notation used in Virtanen et al. (2008b).
When the IPP cycle of a simple difference cover is con-tinuously repeated, all integer-valued pulse separations from unity to arbitrarily long values are produced. When calculat-ing lagged products for autocorrelation function estimation, the co-located pulses producing correlating echoes are sepa-rated byN (N−1)+1 units in roundtrip time. The original idea behind ATC is to select large enoughNto guarantee that only the lowest co-located pulse pair is inside the detectable target. In this paper, the range correspondingN (N−1)+1 units in roundtrip time is called the “range coverage”, as it is both the first “blind” range of the experiment and usually also the range below which the whole detectable target is as-sumed to be located.
In PPATC the simple difference covers are used as follows. Let us mark the time unit of the ATC coding byT and the length of the ATC code (the number of different IPPs) byN. Now, ifT is larger than or equal to the time period lost while transmitting a pulse, the echoes from at leastN−1 pulses out of theN possible ones are collected at each range from T to(N (N−1)+1)T. This is demonstrated forN=3 in Fig. 1, where the smallest possibleT is chosen, leading to a constant radar efficiency as a function of range. Due to hardware limitations and ground clutter, echoes are lost from a much longer period of time than the actual pulse length during each transmission.
The simple difference covers also guarantee that the pulse-to-pulse lags are evenly distributed in the lag direction. At each range, at least N−1 pulse-to-pulse lags out of the N (N−1)possible ones can be measured from the interval [T ,N (N−1)T], but the lag values are not the same at all ranges. In addition, at each pulse-to-pulse lag from T to N (N−1)T, only one of the N possible pulse pairs is co-located. Thus the radar efficiency of these lags is smaller than the efficiency of the short intra-pulse lags. At the lag values k(N (N−1)+1)T ,k=1,2,3,..., the lag profiles are continu-ous and all ranges are again covered with at leastN−1 pulse pairs. An example of the radar efficiencies of both the intra-pulse and intra-pulse-to-intra-pulse lags for a PPATC experiment with 3 different IPPs can be found in the first panel of Fig. 2. In practical experiment design, the time unitT can be chosen to be large enough to allow the estimation of all possible pulse-to-pulse lags in the D-region ranges.
From a geophysicist’s point-of-view, covering large con-tinuous range intervals with a single experiment would be advantageous. For this reason, the present paper concen-trates in designing an experiment with pulses long enough for a reasonable E- and F-region analysis and an ATC coding allowing high enough a lag resolution for the D-region. Ex-periments mainly dedicated to the D-region, combining short (around 100 µs) pulses and a range coverage of about 400 km, can be easily designed with the same method. The latter kind of experiments are important in D-region studies, because they allow the estimation of the short lags without running
into problems with the F-region echoes, and also improve the lag resolution of the pulse-to-pulse lags, when compared with an experiment with the same pulse length and uniform IPPs.
3 Experiment radar efficiencies
In this section, the absolute radar efficiencies of different IS radar experiments are compared. By the term “absolute radar efficiency” we mean the fraction of the experiment total du-ration during which lagged products from a given range at a given lag value can be collected. The experiments are de-signed to have the same duty cycle and the same bit length (15 µs) in phase coding. An optimised code sequence (see Sect. 4) is used in the PPATC experiment. Other experiments used in the comparisons are based on strong type 1 alternat-ing codes (Lehtinen and H¨aggstr¨om, 1987; Markkanen and Nygr´en, 1997; Nygr´en and Markkanen, 1997).
To include the limitations due to the radar hardware and ground clutter, we assume 90 µs of echoes to be lost before each transmitted pulse, due to the limitations of the radar, and 330 µs of echoes to be lost after each pulse, due to ground clutter. Furthermore, we assume that the transmitter must be turned on 40 µs before the start of an actual pulse, as is the case with the EISCAT mainland radars. The last requirement makes the maximum RF duty cycle dependent on the pulse length.
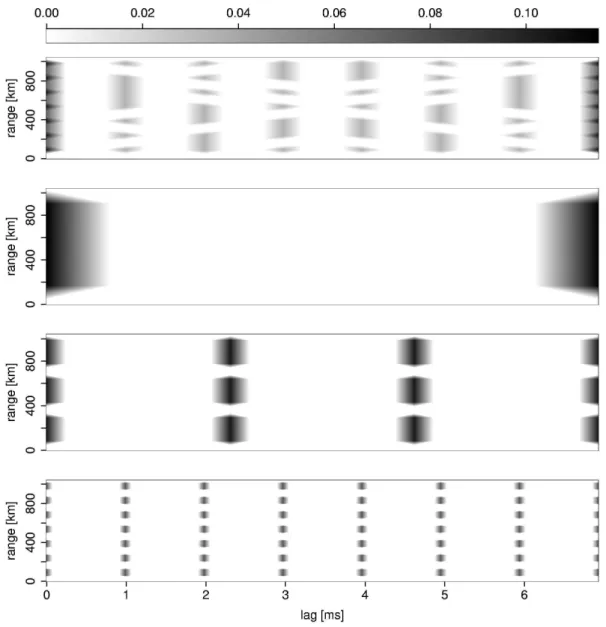
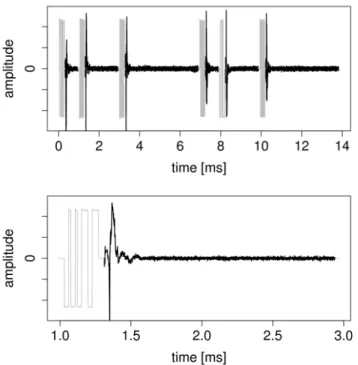
The PPATC experiment used in the comparison has a pulse length of 240 µs and the IPPs are 990, 1980 and 3960 µs. Thus, the experiment range coverage as defined in Sect. 2 is(990+1980+3960)µs×0.15km/µs≈1000km. All intra-pulse lags from 0 to 240 µs can be inverted from the exper-iment. In addition, pulse-to-pulse correlations can be mea-sured with a lag resolution of 990 µs, as seen in the first panel of Fig. 2. The time unitT of the ATC coding is selected to be large enough to allow the estimation of all pulse-to-pulse lags at the D-region altitudes. An example of raw voltage data recorded from a test run of the PPATC experiment is plotted in Fig. 3.
The PPATC experiment is compared to three uniform-IPP experiments, all of which have approximately the same duty cycle as the PPATC experiment. The first one (exp1) has the same continuous range coverage as the PPATC experiment. To fulfill the range coverage requirement, long pulses and long IPPs need to be used. This makes the experiment very inefficient in the D-region and practically prevents reason-able pulse-to-pulse correlation measurements, which would typically require a lag resolution of the order of 1 ms (second panel of Fig. 2).
Fig. 2.Absolute radar efficiencies as functions of range and lag for the experiments compared in this paper. Following the names in Table 2, the efficiency of the PPATC experiment is plotted in the top panel, exp1 in the upper middle panel, exp2 in the lower middle panel and exp3 in the bottom panel.
of the longest correlations of the D-region (third panel of Fig. 2).
The third uniform-IPP experiment (exp3) has the same lag resolution with the PPATC experiment for the pulse-to-pulse lags. In other words, the IPPs are very short, leading to a very small range coverage. In addition, the pulses need to be short, reducing the actual RF duty cycle due to the tech-nical limitations of the klystron radar. The absolute radar efficiency of exp3 is plotted in the lowest panel of Fig. 2. The pulse lengths, IPPs, range coverages and RF duty cycles of the experiments are listed in Table 2.
From Fig. 2 it is evident that the PPATC experiment com-bines the large coverage of exp1, the pulse length of exp2
and the short IPPs of exp3. This combination is achieved by sacrificing part of the radar efficiency of the short lags in the F-region and part of the lag coverage of exp1.
4 Experiment evaluation
Fig. 3. The real part of raw voltage data from the PPATC experi-ment. The data is from an experiment performed with the EISCAT Tromsø VHF radar on 28 November 2008. Upper panel: Trans-mission signal (grey) and the echoes (black) of two full cycles of the ATC coding. Lower panel: The second transmission pulse of the upper panel and the subsequent echoes. A strong ground clutter signal is seen immediately after the pulse. When analysed with-out clutter suppression, the useful incoherent scatter signal begins around 1.6 ms in the plot.
to confirm that we are able to remove the range ambiguities from the data accurately.
As proposed in Virtanen et al. (2008b), the PPATC exper-iments can be evaluated using lag profile inversion (Virtanen et al., 2008a). In lag profile inversion, the conventional de-coding filter based methods for removing range-ambiguities from ACF estimates are replaced by a statistical inversion based method. A range-profile of the ACF at a fixed time-lag is called a lag profile. The true lag values at each range-gate are unknowns and, using measured transmission envelopes, a set of linear equations relating the measured ambiguous lagged products to the unknown true lag values is produced. Statistical inverse methods (Orisp¨a¨a and Lehtinen, 2009) are then used to estimate the true lag profile. The procedure is repeated to all lag values necessary to properly sample the whole ACF.
In the experiment evaluation, fictitious measurements with the given phase codes and IPPs are created and the data is analysed with a unit variance given to the ambiguous lagged products. As described in Virtanen et al. (2008a), the in-version provides the full posteriori covariance matrix, from which only the variances are used in this evaluation. No
addi-Table 2.The experiments used in the comparisons. The listed ex-periments have approximately the same “beam duty cycle” (12%), the differences in the RF duty are mainly due to the requirement of starting the transmitter 40 µs before the actual pulse. All of the experiments use the same bit length (15 µs) in phase-coding. An optimised code sequence is used in the PPATC experiment and a strong type 1 alternating code in the other experiments. exp1 has the same range coverage, exp2 the same pulse length and exp3 the same pulse-to-pulse lag resolution as the PPATC experiment.
pulse length IPP max range RF duty [µs] [µs] [km] [%]
PPATC 240 990; 1980; 3960 1040 10.4 exp1 795 6930 1040 11.5 exp2 240 2310 347 10.4 exp3 75 990 149 7.6
tional information, i.e. regularisation, is included in the inver-sion process. The same range resolution, the phase-coding bit length, is used at all ranges. The posteriori variances achieved this way are equal to the actual variances of the in-verted lag profiles, if the signal-to-noise ratio of the received signal is infinitely low. In addition to this evaluation, a case study of the experiment behaviour for high-SNR is included in Sect. 5.
In the low-SNR evaluation, the variances presented in this paper are scaled very much in the same way as in Lehtinen et al. (2008), where a unit variance was given to an experi-ment with perfect decoding properties. To allow a compar-ison between any two experiments with the same bit length in the phase coding, we are this time scaling the variances by the total duration of the full transmission cycle of the ex-periment. In this scaling, an experiment with a perfect phase coding and 100% duty cycle in both transmission and recep-tion would have unit variance. For real experiments with a smaller duty cycle, the minimum scaled variance is equal to the inverse of the absolute radar efficiency at the given lag value.
200 400 600 800 1000
0
10
20
30
40
50
Lag 1
range [km]
variance
200 400 600 800 1000
0
10
20
30
40
50
Lag 6
range [km]
variance
200 400 600 800 1000
0
10
20
30
40
50
Lag 11
range [km]
variance
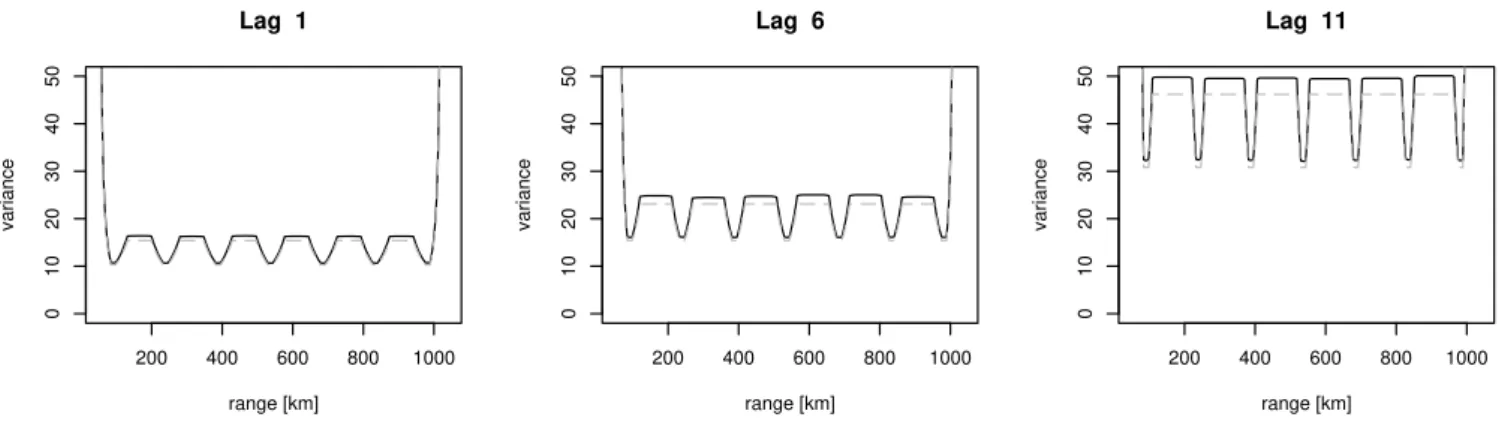
Fig. 4. Normalised variances of selected lags of the PPATC experiment with 48 phase-coded pulses and 3 different IPPs. The continuous black line is the actual posteriori variance of the lag profile and the grey dashed line is the smallest possible variance with the given IPPs and pulse lengths.
The evaluation process revealed that the PPATC experi-ments require much longer code sequences than the stan-dard experiments, which are decoded only up to the one-IPP range. For the experiment with 3 different IPPs, a sequence of 48 phase codes was selected for further evaluation. When analysed with the range and lag resolutions equal to the bit lengths of the codes, the average lag profile variances are found to be 6.8% larger than the theoretical minimum values. The evaluated variances and the theoretical optimal values of selected lag profiles are plotted in Fig. 4.
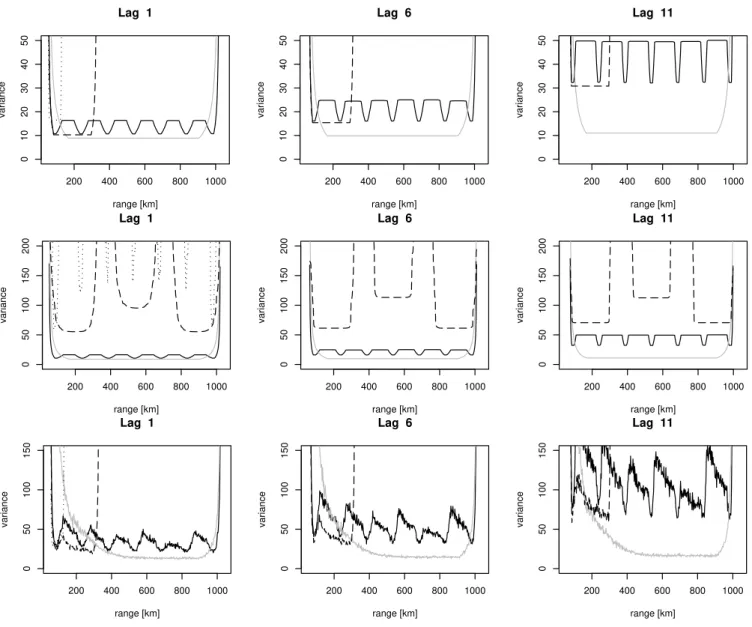
Normalised variances of selected lag profiles of the four experiments are plotted in the first two panels of Fig. 5. In the top panel, the experiments are analysed only up to the one-IPP range. In this case, the variances of exp1, exp2 and exp3 are equal to the theoretical minimum with the given pulse lengths and IPPs, because they are based on strong type-1 al-ternating codes, which are known to have perfect decoding properties. It is possible to extend the analysis of all four ex-periments to the same maximum range but, in that case, the experiments with uniform IPPs will have larger variances, as seen in the middle panel of Fig. 5. This is because the alternating codes are not designed for decoding above the one-IPP range. The problems with the large variances could be avoided by modifying the alternating codes in a way al-lowing perfect decoding above the one-IPP range. A method for generating this kind of codes is known, but the modified code sequences are longer than the standard type 1 alternat-ing codes. A more severe problem are the data gaps in the range direction, which cannot be avoided with the uniform IPPs (see the Figs. 2 and 5).
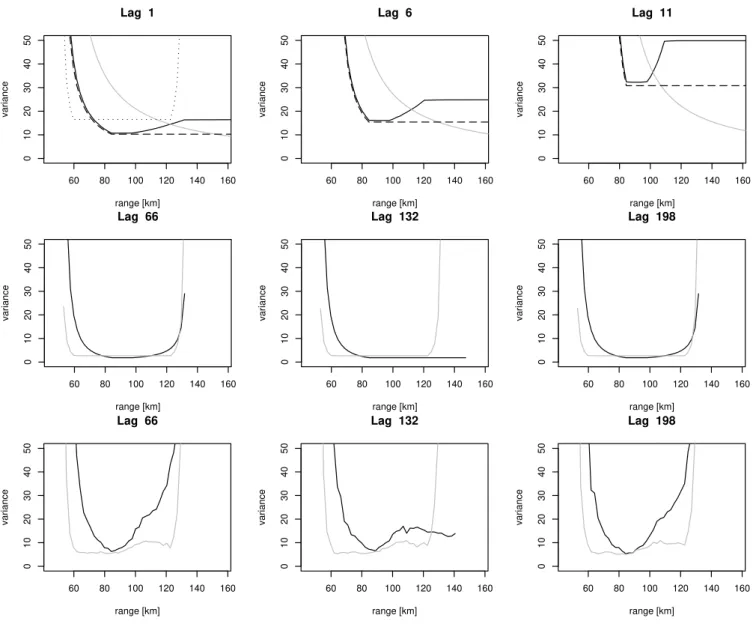
The long pulses of exp1 make it the most accurate in the F-region, while it has rather poor variances in the lowest ranges. A more detailed plot of the bottom part variances is found in the top panel of Fig. 6. At the first lag, the PPATC experiment has variances somewhat comparable to those of exp1 also in the largest ranges but, with increasing lag
num-bers, the long pulses of exp1 make it superior when com-pared with the other experiments. This analysis, as well as the variances presented in Fig. 4, reveal that it is possible to analyse the PPATC experiment with lag profile inversion over the whole large range interval without using any kind of regularisation. However, the pulse length should be carefully selected to keep the radar efficiency of the longest required intra-pulse lags at an acceptable level.
In the case of the pulse-to-pulse correlations, we assume that the signal from above 1 ms (150 km) does not correlate. We will limit our comparison to the two experiments with the best lag resolutions: the PPATC experiment and the uniform-IPP experiment with the shortest pulses (exp3). A remark-able property of the PPATC experiment is that the same lag resolution is achieved for the pulse-to-pulse lags with these two experiments, though the pulse length of the PPATC ex-periment is three times that of exp3 and both have the largest possible duty cycles. Simultaneously, the PPATC experiment has a range coverage seven times that of exp3 and its long pulses allow several intra-pulse lags to be measured from the severely overspread F-region.
200 400 600 800 1000
0
10
20
30
40
50
Lag 1
range [km]
variance
200 400 600 800 1000
0
10
20
30
40
50
Lag 6
range [km]
variance
200 400 600 800 1000
0
10
20
30
40
50
Lag 11
range [km]
variance
200 400 600 800 1000
0
50
100
150
200
Lag 1
range [km]
variance
200 400 600 800 1000
0
50
100
150
200
Lag 6
range [km]
variance
200 400 600 800 1000
0
50
100
150
200
Lag 11
range [km]
variance
200 400 600 800 1000
0
50
100
150
Lag 1
range [km]
variance
200 400 600 800 1000
0
50
100
150
Lag 6
range [km]
variance
200 400 600 800 1000
0
50
100
150
Lag 11
range [km]
variance
Fig. 5.Top panel: Normalised variances of selected lags under low SNR conditions in the compared experiments. The continuous black line is the variance of the PPATC experiment, the grey line is the variance of exp1, the dashed line the variance of exp2 and the dotted line is the variance of exp3. The experiments with uniform IPPs are analysed only up to the range of one IPP. Middle panel: Normalised variances of the compared experiments under low SNR conditions, when the analysis of all four experiments is extended to cover the target range interval of the PPATC experiment. It is clear that the strong type-1 alternating codes used in the experiments do not behave well when analysed this way. Bottom panel: sample variances of the inversion results of simulated data. In total 314 inversion results have been used for each variance estimate.
from the data by calculating separate lag profiles for all frac-tional lag values.
From the middle panel of the Fig. 6, we can see that both experiments are rather good in the D-region for low SNR. As expected, the uniform-IPP version is more efficient in the very lowest range gates, as it has shorter pulses and a higher pulse-repetition frequency on average. However, the PPATC experiment is equally good with exp3 already at the 75 km range and, due to its higher RF duty cycle, is even slightly better in the range interval from 80 to 100 km.
5 Analysis of simulated data
60 80 100 120 140 160
0
10
20
30
40
50
Lag 1
range [km]
variance
60 80 100 120 140 160
0
10
20
30
40
50
Lag 6
range [km]
variance
60 80 100 120 140 160
0
10
20
30
40
50
Lag 11
range [km]
variance
60 80 100 120 140 160
0
10
20
30
40
50
Lag 66
range [km]
variance
60 80 100 120 140 160
0
10
20
30
40
50
Lag 132
range [km]
variance
60 80 100 120 140 160
0
10
20
30
40
50
Lag 198
range [km]
variance
60 80 100 120 140 160
0
10
20
30
40
50
Lag 66
range [km]
variance
60 80 100 120 140 160
0
10
20
30
40
50
Lag 132
range [km]
variance
60 80 100 120 140 160
0
10
20
30
40
50
Lag 198
range [km]
variance
Fig. 6.Top panel: The bottom parts of the normalised lag profile variances in the compared experiments. The black, grey, dashed and dotted lines are variances in PPATC experiment, exp1, exp2 and exp3, respectively. The differences in the estimation accuracies at the lowest ranges are clearly visible. Middle panel: Normalised variances for the pulse-to-pulse lags of the PPATC experiment and exp3 for low SNR. All possible fractional lags around each main pulse-to-pulse lag are included in the same profiles. The lags are numbered as multiples of the bit length of the phase codes. Bottom panel: sample variances of the inversion results of simulated data for the pulse-to-pulse lags. In total 314 inversion results have been used for each variance estimate.
radar echoes with the given spectra. After the simulation, normally distributed random noise was added to the echoes. The simulation was performed with a 5 µs sampling interval, i.e. triple oversampling when compared to the bit length of the phase-coding. The power of the added noise was ad-justed to approximately equal the maximum power of the simulated “ionospheric” signal of exp1. In the analysis, the data was filtered using a low-pass filter, which still increases the signal-to-noise ratio. Thus, the evaluation is performed with data corresponding to good signal-to-noise conditions, making the self-noise effects clearly visible in the results.
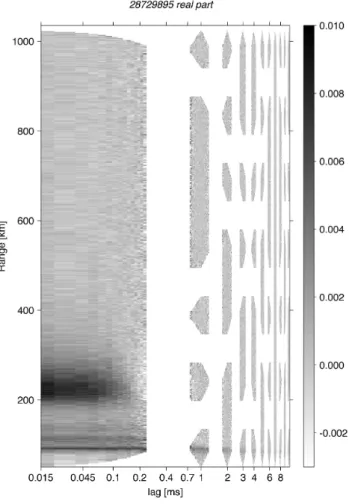
Fig. 7. The real part of the plasma scattering autocorrelation func-tion measured with the EISCAT Tromsø VHF radar on 28 Novem-ber 2008 (in arbitrary units). The ranges from 50 to 1000 km are continuously covered with the short (15 to 225 µs) lag profiles. In addition, several pulse-to-pulse lag profiles with a lag resolution of 990 µs are measured. To underline the possibility of measuring the pulse-to-pulse correlations from all ranges, the E- and F-regions are also contained in the to-pulse part. Neither are nearby pulse-to-pulse lags integrated in the same profiles to demonstrate that the whole lag coverage presented in Fig. 2 is really possible to achieve.
are still very close to the original one, except that the new one is expected to be much more filter-tolerant.
In the analysis, a time resolution of 0.88704 s was used. During this period of time, the full transmission cycle of the PPATC experiment is repeated exactly four times and the cy-cles of exp1, exp2, and exp3 are repeated once, 12 times and 56 times, respectively. Thus, none of the experiments will suffer from incomplete code sequences being included in the analysis. In total 314 integration periods were analysed for all four experiments and the mean values and the sample vari-ances of the resulting ACFs were calculated for each experi-ment separately. In this paper, only a qualitative comparison of the lag profile variances is included. A more detailed
eval-uation of the covariances between different range gates and lags, as well as code optimisation to minimise these covari-ances, may be the subject of a future study.
The sample variances of the inverted lag profiles are plot-ted in the bottom panels of Figs. 5 and 6. They should be compared with the low-SNR evaluation results in the mid-dle panels of the same figures. The variance of exp3 (dotted line in the lowest left panel of Fig. 5) is slightly misleading, because further investigation of the averaged lag profiles re-vealed that the profile was biased due to F-region echoes.
There is one clear difference between the self-noise effects in the experiments with uniform IPPs and the PPATC experi-ment. This is clearly visible when comparing the continuous grey (exp1) and black (PPATC) curves in the top and bot-tom panels of Fig. 5. The strongest echoes and the largest self-noise contamination in the data are known to be located between 100 km and 300 km. The bottom part of the grey curve (exp1) in the bottom panel of Fig. 5 is clearly higher than the corresponding curve in the middle panel of the same figure. However, the larger ranges are not much affected due to a much lower SNR. The behaviour of the continu-ous black curve (PPATC) is quite different: the curve has shifted upward at all ranges, and only small differences in the rate of increase are seen. The self-noise contamination of the PPATC experiment is spread over all ranges, because there are always several pulses inside the target ranges. Most of the time, one of the pulses is inside the strong ionisation, increasing the self-noise. On the other hand, the range inter-val where the strong ionisation is located has suffered much less in the PPATC experiment than in exp1.
In the case of pulse-to-pulse lags, the PPATC experiment seems to suffer more from the self-noise than exp3. This is due to its long pulses which spread the self-noise contamina-tion from the E-region down to the upper D-region ranges.
6 Test run of the PPATC experiment
The PPATC experiment introduced in this paper was tested with the EISCAT VHF radar on 28 November 2008. Both attenuated transmitter samples and the ionospheric echoes were recorded as raw voltage data, which were analysed us-ing lag profile inversion. In the analysis, the data was filtered and decimated to a final 15 µs sampling interval. All pos-sible lag values from 15 µs to 10 ms were analysed with a five-second time resolution. The possibilities of integrating several pulse-to-pulse lags into one profile and limiting the pulse-to-pulse analysis below some maximum range smaller than the total coverage of the experiment were not used, to point out that the analysis works well also without these op-tions.
equipment. The plotted ACF is an average of 60 inversion re-sults, i.e. five minutes in time. A few ACFs clearly containing coherent echoes from hard targets were removed before the averaging. The ACF reveals ionisation in E- and F-regions. The altitude profile of the ionisation is in good agreement with the simultaneous results of the Tromsø dynasonde. A D-region is also observed with the IS radar, the long corre-lations in the D-region signal are clearly visible over several milliseconds in the lowest parts of the pulse-to-pulse lag pro-files.
7 Discussion
The benefit of the PPATC method is the possibility of mea-suring also the pulse-to-pulse correlations from the same data, which provides the E- and F-region autocorrelation functions. In addition to the D-region analysis, the pulse-to-pulse coherence is beneficial for the analysis of weak coher-ent echoes, e.g. from space debris and meteors. The possi-bility of measuring these secondary data products also makes the experiment truly multipurpose. Debris and meteor detec-tions can also improve the plasma parameter estimation, be-cause these coherent echoes can then be removed from the data already before the lag profile inversion step. The atmo-spheric echoes from low altitudes, well below the D-region, are also an interesting long-correlating target, though we do not yet have methods for separating the atmospheric signal from the very strong ground-clutter signal.
The analysis of space debris is more feasible with non-uniform IPPs, because the achievable continuous range is much larger than that achievable with uniform IPPs (Vieri-nen et al., 2009). Space debris is typically detected between 200 and 2500 km, but sometimes space objects can be ob-served at ranges up to tens of thousands of kilometers. While the PPATC experiment described in this study can provide a continuous range coverage up to 1000 km, it can be eas-ily increased up to tens of thousands of kilometers, e.g. us-ing longer simple difference covers, arithmetic modulus type aperiodic transmission sequences (Uppala and Sahr, 1994), or with a ramped IPP scheme (Vierinen et al., 2009).
If only the severely overspread targets are of interest, ex-actly the same range and lag coverages can be achieved by transmitting the N pulses in the ATC code in N separate fre-quency channels, which in addition leads to the simple situa-tion of a constant pulse-repetisitua-tion frequency in each channel. Experiments very similar to this have been in routine use at least in the EISCAT Svalbard radar for several years. We did not fully investigate the self-noise effects, but it is obvious that an experiment using several frequency channels does not suffer from the self-noise as much as the true PPATC version. In this paper the rather complicated range ambiguities pro-duced by the PPATC method were removed with lag profile inversion (Virtanen et al., 2008a). The analysis should be possible, at least with minor changes to the actual software,
with any other method independent of any special decoding properties of the applied codes. These methods include lag profile deconvolution methods similar to the one used in this paper (Nikoukar et al., 2008), as well as the so-called full-profile analysis (Lehtinen et al., 1996; Hysell et al., 2008b).
Despite the possibility of measuring both intra-pulse and pulse-to-pulse lags with a large range coverage, the PPATC experiment evaluated in this paper still contains gaps in the lag coverage. The most troublesome gap is evidently the transition from the longest intra-pulse lag to the shortest pulse-to-pulse lag in the E-region. The shortest IPP cannot be made short enough for two reasons: the reception cannot be started immediately after the end of a pulse because of hardware limitations plus ground clutter and, secondly, the present radar system does not allow the pulses to be trans-mitted closer than we are already doing. If the gap causes se-rious problems, the experiment could possibly be improved by combining pulses of different lengths in the same experi-ment, as done in Virtanen et al. (2008b). This kind of further fine-tuning of the experiments is not included in this paper, as the present goal is only to demonstrate the basic idea of the method and to show that good estimation accuracies can be achieved.
The true purpose of incoherent scatter measurements is es-timating ionospheric plasma parameters, a part of the analy-sis which was not included in this paper. However, the ac-curacy of the ACF estimation was carefully studied, and the PPATC method was shown to be capable of producing ACF estimates with an accuracy near to the theoretical optimum at all lag values. Thus, the question is only about designing an experiment providing sufficient lags with high enough radar efficiency from each range. According to Vallinkoski (1989), the longest lag required for a proper parameter fit is approxi-mately the second zero-crossing of the ACF. A natural choice would be to use long enough pulses to get the necessary lag coverage for F-region from the intra-pulse lags. As seen from Fig. 7, this requirement is hardly fulfilled with the tested ex-periment, and somewhat longer pulses should most probably be used in future experiments.
The ultimate goal of experiment optimisation is to find an experiment, which can be shown to be impossible to improve for all the lag profiles necessary at all the different layers of the ionosphere. As a conclusion, the PPATC is very close to this goal and one has good reasons to think that no other experiments are ever necessary, unless only a limited range interval sufficiently far away from the radar is of interest. However, one must remember that two reservations still re-main, 1) the first one about theoretical understanding of ac-curacy limits to experiment variances with good SNR and 2) the second one dealing with the optimal bit length being de-termined by the desired range resolution. We discuss these below.
cases where the receiver thermal noise background is the dominant noise contribution, i.e. the SNR is low. If this is not the case, the self-noise causes complicated ef-fects, including correlations between different lag pro-file estimates, which may lead into rather surprising re-sults. Experiment optimisation remains an open ques-tion in this case and for example the numerical case studies in Huuskonen and Lehtinen (1996) and Lehtinen et al. (1997) show that taking these correlations into ac-count may significantly affect the lag profile and conse-quently ionospheric parameter estimation variances. In some cases the variances may actually be smaller, and in some cases larger, than simple approximations would imply. Thus, in cases of good or high SNR some other experiment might be better than the PPATC. However, the simulations shown in this paper for high SNR show that no catastrophic increase of variance seem to result by use of the PPATC method. Thus at least as long as no concrete alternatives have been found, we recommend use of PPATC even in the case of better SNR.
2. We have also taken a certain range resolution as granted. In Lehtinen (1989) it is shown that in a situation with a low SNR, the desired target model resolution deter-mines the optimal bit length of an alternating code or any other code close to the theoretical optimum in such a way that the best bit length is approximately 1.5 times the range resolution of the analysis model. As typical range resolutions in different ionospheric layers are dif-ferent, this is another fact which makes it impossible to design an experiment which is simultaneously optimal for all possible purposes. If the resolution requirement for the different layers were the same, our considera-tions here would show that the PPATC is very close to a general-purpose optimal experiment for moderate or low SNR, but now, as different resolution requirements for different layers dictate, one needs to choose the bit length to be compatible with the resolution requirement of the most important layer and then be satisfied with the penalty caused by non-matching resolution require-ments for the other layers. This fact can actually be shown to be a mathematical law, which no further code development can be expected to eliminate.
8 Conclusions
The utilisation of aperiodic transmitter coding for incoher-ent scatter radar experimincoher-ents using long phase-coded pulses was demonstrated. A PPATC experiment was designed and evaluated, revealing that estimation accuracies near the theo-retical optimum can be achieved when optimised phase-code sequences are used in a PPATC experiment. The designed experiment was also tested with a real radar and the data was successfully analysed with lag profile inversion.
The method can be beneficial especially in D-region stud-ies or as a flexible all-around experiment, as it provides a method for combining a high pulse-to-pulse lag resolution with a large continuous range coverage. These kinds of ex-periments can also be used for space debris and meteor stud-ies, making them truly multipurpose. This capability also significantly improves outlier removal due to these kinds of non-IS targets.
We have also shown that at least for low SNR cases, a col-lection of such experiments with different baud lengths might be regarded as the ultimate suite of experiments for measur-ing all ionospheric layers simultaneously. The question of experiment optimisation is then reduced to just the question of choosing the baud length which best corresponds to the desired resolution. While proven for low SNR only, our sim-ulation results show that the behaviour is at least decent for good SNR, too.
Acknowledgements. This work was supported by the Academy of Finland (application number 213476, Finnish Programme for Cen-tres of Excellence in Research 2006–2011). Ilkka Virtanen is funded by the Finnish Graduate School in Astronomy and Space Physics. The EISCAT measurements were made with special pro-gramme time granted to Finland. EISCAT is an international associ-ation supported by China (CRIRP), Finland (SA), Germany (DFG), Japan (STEL and NIPR), Norway (NFR), Sweden (VR) and United Kingdom (STFC). The authors are grateful for M. Vallinkoski for his help in preparing the manuscript, especially for his advice con-cerning the English language.
Topical Editor M. Pinnock thanks one anonymous referee for her/his help in evaluating this paper.
References
Chau, J. L., Hysell, D. L., Reyes, P. M., and Milla, M. A.: Improved spectral observations of equatorial spread F echoes at Jicamarca using aperiodic transmitter coding, J. Atmos. Solar-Terr. Phys., 66, 1543–1548, doi:10.1016/j.jastp.2004.07.002, 2004. Clinger, W. and Van Ness, J. W.: On unequally spaced time points
in time series, The Annals of Statistics, 4, 736–745, 1976. Damtie, B., Nygr´en, T., Lehtinen, M. S., and Huuskonen, A.: High
resolution observations of sporadic-E layers within the polar cap ionosphere using a new incoherent scatter radar experiment, Ann. Geophys., 20, 1429–1438, 2002,
http://www.ann-geophys.net/20/1429/2002/.
Farley, D. T.: Incoherent scatter correlation function measurements, Radio Sci., 4, 935–953, 1969.
Farley, D. T.: Multiple-pulse incoherent-scatter correlation function measurements, Radio Sci., 7, 661–666, 1972.
Huuskonen, A. and Lehtinen, M. S.: The accuracy of incoherent scatter measurements: error estimates valid for high signal lev-els, J. Atmos. Terr. Phys., 58, 453-463, 1996.
Hysell, D. L. and Chau, J. L.: Interpreting the Doppler spectrum of coherent scatter from topside equatorial spread F, J. Atmos. Solar-Terr. Phys., 66, 1549–1557, doi:10.1016/j.jastp.2004.07. 003, 2004.
and Bayesian inversion, Radio Sci., 43, RS2010, doi:10.1029/ 2007RS003790, 2008a.
Hysell, D. L., Rodrigues, F. S., Chau, J. L., and Huba, J. D.: Full profile incoherent scatter analysis at Jicamarca, Ann. Geophys., 26, 59–75, 2008b,
http://www.ann-geophys.net/26/59/2008/.
Lehtinen, M. S., Huuskonen, A., and Markkanen, M.: Randomiza-tion of alternating codes: Improving incoherent scatter measure-ments by reducing correlations of gated autocorrelation function estimates, Radio Sci., 32, 2271–2282, doi:10.1029/97RS02556, 1997.
Lehtinen, M. S.: On optimization of incoherent scatter mea-surements, Adv. Space Res., 9, 133–141, doi:10.1016/0273-1177(89)90351-7, 1989.
Lehtinen, M. S. and H¨aggstr¨om, I.: A new modulation principle for incoherent scatter measurements, Radio Sci., 22, 625–634, 1987. Lehtinen, M. S., Huuskonen, A., and Pirttil¨a, J.: First experiences of full-profile analysis with GUISDAP, Ann. Geophys., 14, 1487– 1495, 1996,
http://www.ann-geophys.net/14/1487/1996/.
Lehtinen, M. S., Virtanen, I. I., and Vierinen, J.: Fast comparison of IS radar code sequences for lag profile inversion, Ann. Geophys., 26, 2291–2301, 2008,
http://www.ann-geophys.net/26/2291/2008/.
Markkanen, M. and Nygr´en, T.: Long alternating codes 2. Practical search method, Radio Sci., 32, 9–18, doi:10.1029/96RS03117, 1997.
Nikoukar, R., Farzad, K., and Kudeki, E.: An efficient near-optimal approach to incoherent scatter radar parameter estimation, Radio Sci., 43, RS5007, doi:10.1029/2007RS003724, 2008.
Nygr´en, T. and Markkanen, M.: Long alternating codes 1. Search by playing dominoes, Radio Sci., 32, 1–8, doi:10.1029/96RS03118, 1997.
Nygr´en, T., Huuskonen, A., and Pollari, P.: Alternating-coded mul-tipulse codes for incoherent scatter experiments, J. Atmos. Terr. Phys., 58, 465–477, 1996.
Orisp¨a¨a, M. and Lehtinen, M. S.: Fortran Linear Inverse Problem Solver (FLIPS), Inverse Problems and Imaging, in review, 2009. Pirttil¨a, J., Lehtinen, M. S., Huuskonen, A., and Markkanen, M.: A Proposed Solution to the Range-Doppler Dilemma of Weather Radar Measurements by Using the SMPRF Codes, Practical Results, and a Comparison with Operational Measurements, J. Appl. Meteor., 44, 1375–1390, 2005.
Raizada, S., Sulzer, M. P., Tepley, C. A., Gonzalez, S. A., and Nicolls, M. J.: Inferring D region parameters using improved incoherent scatter radar techniques at Arecibo, J. Geophys. Res. (Space Physics), 113, A12302, doi:10.1029/2007JA012882, 2008.
Schleher, D. C.: MTI and Pulsed Doppler Radar, Artech House, Inc., 1991.
Skolnik, M. I. (Ed.): Radar Handbook, McGraw-Hill Publishing Company, 2nd edn., 1990.
Sulzer, M. P.: A phase modulation technique for a sevenfold statis-tical improvement in incoherent scatter data-taking, Radio Sci., 21, 737–744, 1986a.
Sulzer, M. P.: A radar technique for high range resolution incoher-ent scatter autocorrelation function measuremincoher-ents utilizing the full average power of klystron radars, Radio Sci., 21, 1033–1040, 1986b.
Sulzer, M. P.: Recent incoherent scatter techniques, Adv. Space Res., 9, 153–162, doi:10.1016/0273-1177(89)90353-0, 1989. Sulzer, M. P.: A new type of alternating code for incoherent scatter
measurements, Radio Sci., 28, 995–1002, 1993.
Uppala, S. V. and Sahr, J. D.: Spectrum estimation of moderately overspread radar targets using aperiodic transmitter coding, Ra-dio Sci., 29, 611–623, 1994.
Uppala, S. V. and Sahr, J. D.: Aperiodic transmitter waveforms for spectrum estimation of moderately overspread targets: new codes and a design rule, IEEE Trans. Geosci. Rem. Sens., 34, 1285–1287, doi:10.1109/36.536545, 1996.
Vallinkoski, M.: Error Analysis of Incoherent Scatter Radar Mea-surements, PhD thesis, University of Helsinki, 1989.
Vierinen, J., Lehtinen, M. S., Orisp¨a¨a, M., and Virtanen, I. I.: Trans-mission code optimization method for incoherent scatter radar, Ann. Geophys., 26, 2923–2927, 2008,
http://www.ann-geophys.net/26/2923/2008/.
Vierinen, J., Lehtinen, M. S., Markkanen, J., and Virtanen, I. I.: Measuring space debris with phase coded aperiodic transmission sequences, in: Proceedings of the Fifth European Conference on Space Debris, Darmstadt, Germany, 30 March–2 April 2009, ESA/ESOC, 2009.
Virtanen, I. I., Lehtinen, M. S., Nygr´en, T., Orisp¨a¨a, M., and Vieri-nen, J.: Lag profile inversion method for EISCAT data analysis, Ann. Geophys., 26, 571–581, 2008a,
http://www.ann-geophys.net/26/571/2008/.