THE ANALYSIS OF PERFORMANCES OF THE ENTREPRISE THROUGH INDICATORS OF THE VOLUME OF ACTIVITY
Pop Fănuța, Făt Codruța
1Department of Finance, Faculty of Economics and Business Administration, Babes-Bolyay University, Cluj-Napoca, Romania
2Department of Finance, Faculty of Economics and Business Administration, Babes-Bolyay University, Cluj-Napoca, Romania
[email protected] [email protected]
Abstract: The activity of any economic entity is aimed at providing objects, works and services meant to fulfill certain social needs, as well as at achieving a certain level of profit which would enable the entreprise to maintain and/or develop in business. In order to reach these objectives, the offer of the entreprise should meet the demand of the market whithin which it activates in terms of: volume (how much it is demanded?), structure (what brands are demanded and what is their share in the total production?), rhythmicity (during what span of time?) and level of quality (does the offer of the entity meet the qualitative level demanded by clients?). The entreprise develops interconditioning relations with its external factors, namely clients, suppliers, the state, employees, shareholders, banks, the government and budgetary institutions; the degree to which their expectations are met reflects the efficiency of the activity undertaken. Among the main indicators of performance, one could cite the turnover and the added value that reflect the economic raise of the entity, conditions its strategic position and defines its place in relation to other competitors, within the branch of activity concerned. A high level of turnover and added value guarantees that the economic entity develops a profitable activity, that it is expanding and developing, a fact with consequences upon the main economic-financial indicators but also upon the efficiency of the activity of the economic entity. The main objectives of the present paper are to point out the dynamics of the indicators of volume of activity, of factors of influence and of their strategies of growth. In addition to that, the study tries to ground and analyse theoretical aspects by providing some practical examples based on real data obtained from an economic entity during the period 2008-2011, but also data published by the INSSE for the same period, in order to observe its evolution in relation to other evolutions from the sector concerned.
Keywords: turnover; volume indicators; methods of analysis; dynamics structure; strategies of growth; factors of influence.
JEL classification: L25 M11 O12
1. The system of value indicators reflecting the volume of the activity of production and marketing
activity also influences the financial results of the economic entity. The entire activity of an economic entity can be assessed through a system of volume indicators. The economic entity develops in a current and repeated manner operations of purchase, production and marketing which give content to its exploiting activity, an activity which, after all, is the basic activity of the economic entity. The efficiency of the exploiting activity and of the economic-financial performances that define the activity of the entreprise can be assessed mainly by indicators, both of volume, or physical, and of value. (Mironiuc, M., 2006). Physical indicators reflect in a real way the own effort of the entreprise in what regards the volume of its activity and they are not affected by price inflation. However, they can only be applied to entities with homogenuous production and don’t allow other activities to be included in the physical production (the production in course, semifinished products, industrial works) (Păvăloaia, W., 2002).
These shortcomings are surpassed through value units (costs, current and/or comparable prices), which also offer the possibility to obtain indicators aggregated through succesive additions, regardless of the nature of production. The economic theory and practice offers a system of value indicators in order to assess the results of the activity of production and marketing of an entreprise, as well as the effects of the dimension of economic activity (Vâlceanu, Ghe. et. al., 2004. Some data sources useful to analyze these indicators are: The Profit and Loss Account, the table of intermediary balance accounts and data from the operative records of the entreprise. The table 1 presents the step-by-step formation of intermediary balance accounts, based on real data from the level of an economic entity and their evolution in time during the years 2008-2011.
Table 1: The system of volume indicators. Formation and evolution
Indicators Absolute values (thousands lei) Chain-based indices (%)
2008 2009 2010 2011
Sold production (Qv) 82831 79075 88323 102116
- 95,47 111,7 115,6
Income from the sale of goods (VVM) 7019 7746 10099 12224
- 110,4 130,4 121
Iicome from exploitation subventions associated with the .net .turnover (VS)
0 0 0 0
- - -
-Commercial discounts alloted (Ra)
0 0 2493 3449
- - 0 138,3
Net turnover (CAN=QV+VVM+VS-Ra)
89850 86821 95929 110891
- 96,6 110,5 115,6
Variation of stockedproduction (ΔQs) (Balance account C)
4704 213 1857 737
- 4,5 871,8 39,7
Production obtained intended for delivery
(Qf = Qv ± ΔQs)
87535 79288 90180 102853
- 90,6 113,7 114
Immobilized production (Qi)
0 0 0 197
- - - 100
Production of exercice
Indicators Absolute values (thousands lei) Chain-based indices (%)
2008 2009 2010 2011
Expenses with goods (Ca)
5775 5218 6125 7550
- 90,3 117,4 123,3
Commercial margin (MC = VVM- Ca)
1244 2528 3974 4674
- 203,2 157,2 117,6
Total material expenses (CM)
36567 26018 28018 31603
- 71,2 107,7 112,8
Expenses with external provisions (Lt)
15767 17781 23842 28684
- 112,8 134 120,3
Intermediary consumption (Ci)
52334 43799 51860 60287
- 83,7 118,4 116,2
Industrial margin (MI = Qex - Ci)
35201 35489 38320 42763
- 100,8 108 111,6
Added value (VA = MC + MI)
36445 38017 42294 47437
- 104,3 111,3 112,2
Exploitation income (VExpl)
97571 87879 98120 112197
- 90,1 111,7 114,3
Exploitation expenses (CExpl) 86376 78980 91381 102342
- 91,4 115,7 112
Exploitation result (RExpl) 11195 8899 6739 9855
- 79,5 60,2 146,2
Source: Real data at the level of an economic entity from the Account of Profit and Loss
The net turnover (CAN)highlights the dimension of the business log achieved by an economic entity in its relations with other partners. As an indicator of volume of the activity of an entreprise, the net turnover includes „sums obtained from sale of goods and service provision that fall into the category of current activities of the legal entity, after deduction of commercial discounts, of the added value tax, of other rates and taxes associated” (acc. to OMFP 3055/29.10.2009, M Of. al României nr.766/10.11.2009).
At the level of economic entities with an industrial profile, an increased share from the total of the net turnover belongs to the production sold (QV), whereas a smaller share can be attributed to income obtained from the sale of goods (VVM), if the given entities own a chain of stores to market part of their products.. In the case of economic entities that function in the domain of distribution and marketing of goods, the greatest share (100%, if there are no discounts) from the total of the net turnover belongs to the income obtained from the sale of goods. Income from exploitation subventions associated with the net turnover (VS) and commercial discounts alloted (R) generally have unsignificant shares and depend upon the capacity of the entity to attract subventions for investments (from the state or from various European institutions), while allotment of commercial discounts depends on the ability of negotiating with clients), but also on concrete conditions of market circumstances (in periods of crisis the purchasing power and the demand fall off, hence these discounts could exert a bigger influence on the turnover).
analyzed is concerned, we could observe that the share of sold production within the total of turnover is dominant, due to the object of activity of the entreprise, which is the activity of production. So that, on composing elements, the production sold follows approximately the same evolution as the turnover (a fact which is, in fact, normal, because the production sold holds the greatest share within the turnover), while income from the sale of goods through the own chain of stores follows and ascending trend all along the period in view, with significant increases as compared to the preceding period. The economic entity analyzed grants discounts, unsignificant in 2010 and 2011, but does not record income from exploitation subventions.
The production obtained intented for delivery (Qf) or the production of manufactured goods represents the direct and useful result of the producing industrial activity, expressing the value of products manufactured, of works executed and services provided during a certain period of time and which are to be sold. The production of manufactured goods can be calculated by using information from the accounting inventory. Although not included among indicators from the Account of Profit and Loss, neither among indicators presented in the table of intermediary balance accounts, the production obtained intended for delivery is an indicator useful to estimate the potential result of exploitation (profit or loss), because it offers better correlation with effort indicators in order to calculate the efficiency of the activity of the economic entity”. (Vâlceanu, Ghe., et. al., 2004: 46-47). At the level of the entity analyzed, we can observe that this indicator follows the same trend as the sold production. Even if stocked production records a significant increase in 2010 compared to 2009 (by 771%), the period stockage on each year analyzed is still unsignificant compared to the value of sold production, a favourable aspect since the interest of the entity is to sell, not to stock products.
The production of exerciceorglobal production (Qex)highlights the dimension of the commercial activity of a productive entreprise both in its relation with third parties (clients) through sold production and variation of stocked production, on the one hand, and in its relation to itself throughimmobilized production, on the other hand. The production of exercice is an indicator specific to industrial units, measuring the global volume of the activity developed. It includes the value of goods and services ”realized” by the entreprise in order to be sold, stocked or used for own needs. In the case of industrial entreprises, the production of exercice consists of the turnover to which adds the stocked, respectively the immobilized production. If industrial entreprises record great discrepancies between the moment of fabrication and of facturing, as well as significant values of the stocked and immobilized production, then the production of exercice provides a more faithful image of the activity of the entreprise than the turnover.
During 2008-2010 the production of exercice is identical to the production obtained intended for delivery, since there is no immobilized production recorded. This immobilized production is recorded only in 2011, but in an unsignificant sum (197 thousands lei), the trend of the evolution of production deriving still from the sold production.
has to be dealt with gradually, according to the type of sales policy promoted by the entreprise and the type of the commercial activity.. From the Table 1, we can observe that the commercial margin follows an ascending evolution during the period in view, a significant increase being recorded in 2009 as compared to 2008, when the commercial margin doubles, due to increase of income from the sale of goods by 10% and decrease of expenses with goods by the same percent. One should also consider the fact that consequences of crisis could be felt in 2009, which either made a part of the population orient towards products purchased directly from the producer due to their purchasing power falling off, or it made income increase due to the appearance of a new brand of quality products (Gerovital, Aslavital). In the following years the commercial margin grows from one year to another, but against the background of greater increase of income from the sale of goods as compared to the rhythm of increase of expenses with goods.
The industrial margin (MI) represents the value newly created in the activity of production developed by an economic entity during a given period of time.. At the level of the productive entity the industrial margin contributes significantly in the formation of added value. From the Table 1 we can observe that the industrial margin maintains relatively constant in 2009 compared to 2008 (the index being 100,8%). This maintaining within parameters of the previous year took place against the background of decrease of the production of exercice (by 9,4%) through the sold production, but especially of intermediary consumptions (which decreased in a higher degree, by 16,3%). The industrial margin increases in the following two years (by 8% in 2010 compared to 2009 and by 11,6% in 2011 compared to 2010), due to the increase, approximately in the same degree, both of the production of exercice and of intermediary consumptions.
The added value (VA) expresses the increase or the plus value achieved by the entity by using factors of production in a transaction period. This increase in value, over the value of goods and services provided by third parties, is generated by activities of sale and marketing and consists of either the sum of the two margins, or the sum of earnings of factors directly or indirectly involved in the activity of the economic entity (employees and social organisms, the state, debtees, shareholders etc.). During the entire period analyzed, the added value formed by summing up the two margins, with greater share of contribution of the industrial margin compared to the commercial margin, follows an ascending evolution from one year to another, in relatively steady proportions in the last two years (by 11,3% in 2010 compared to 2009 and by 12,2% in 2011 compared to 2010).
The result of exploitation (RExpl) appears as a result of rolling of flows of exploitation, including economic operations with specific, common and repetitive character. During the entire period analyzed, the result of exploitation takes the form of profit. However, this records a decrease in 2009 compared to 2008 against the background of greater decrease of the exploitation income (by 9,9%) as compared to the decrease of exploitation expenses (by 8,6%). In 2010, as compared to 2009, the exploitation profit decreases due to the higher rhythm of increase of exploitation expenses as compared to the exploitation income. The year 2011 brings a sudden change in the situation of the evolution of profit: it grows by 46,2% due to the greater rhythm of increase of exploitation income, as compared to exploitation expenses.
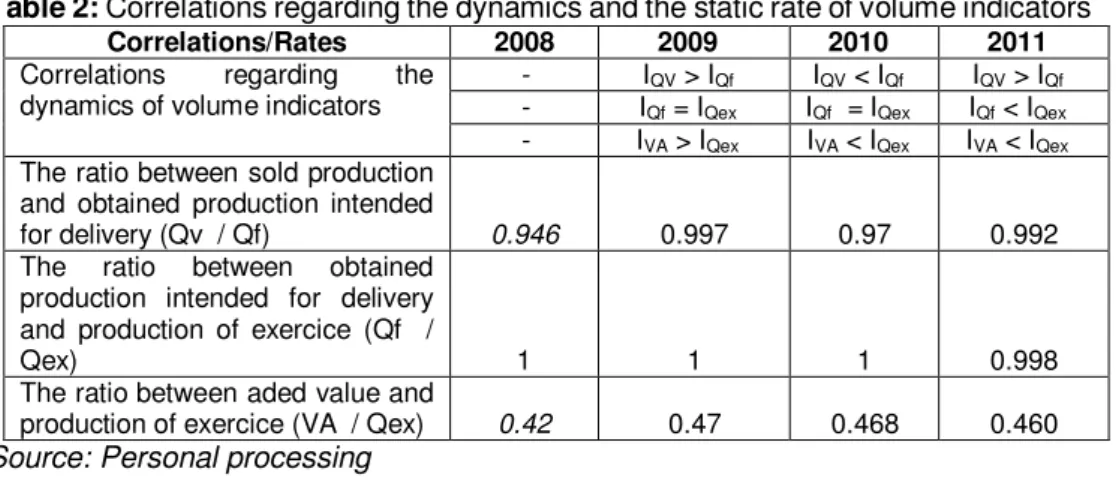
If we highlight correlations between the dynamics of the main indicators we can observe the way programs of production and marketing are grounded and also the way in which they are realized, as compared to programmed levels or to achievements from previous periods. On this basis, we can assess deviations (in absolute or in relative measures), their causes, but also provide measures to be taken in order to correct unfavourable situations. At the theoretical level, we can admit equality between all indicators presented, which shows the fact that, as related to a comparative base, there are steady proportions between elements that distinguish the given indicators, but such a situation cannot be met and it is not desirable, because, from one period to another, both quantitative and qualitative changes can be recorded between the elements that distinguish value volume indicators. The table 2 presents the main correlations between the dynamics of volume indicators
Table 2:Correlations regarding the dynamics and the static rate of volume indicators Correlations/Rates 2008 2009 2010 2011 Correlations regarding the
dynamics of volume indicators
- IQV> IQf IQV< IQf IQV> IQf - IQf= IQex IQf = IQex IQf< IQex - IVA> IQex IVA< IQex IVA< IQex The ratio between sold production
and obtained production intended
for delivery (Qv / Qf) 0.946 0.997 0.97 0.992
The ratio between obtained production intended for delivery and production of exercice (Qf /
Qex) 1 1 1 0.998
The ratio between aded value and
production of exercice (VA / Qex) 0.42 0.47 0.468 0.460
Source: Personal processing
On analyzing correlations between value indicators of the volume of activity, we can observe that the years 2009 and 2011 recorded an increase of the degree of valorification of production (IQV > IQf) against the background of reduction of the stocked production. The year 2010 records a reduction of the degree of valorification, because in this year stocked production records a superior rhythm of increase as compared to 2009. The fact doesn’t have strong negative consequences because, even if growing very much in relation to the pervious years, stocked production records unsignificant values compared to the sold production. Resources in order to improve performances could be find by analyzing the correlation between the index of added value and the index of the production of exercice, which fall into the ratio of IVA < IQex in 2010 and 2011, meaning that in these years intermediary consumptions from third parties recorded higher increases than the production of exercice. Only the year 2009 records a favourable correlation, as in that year intermediary consumptions decreased more strongly. However, a closer analysis of the static ratio proves that the degree of valorification of production is rather high (close to 100%), while the added value is by about 50% over the value of intermediary consumptions from third parties.
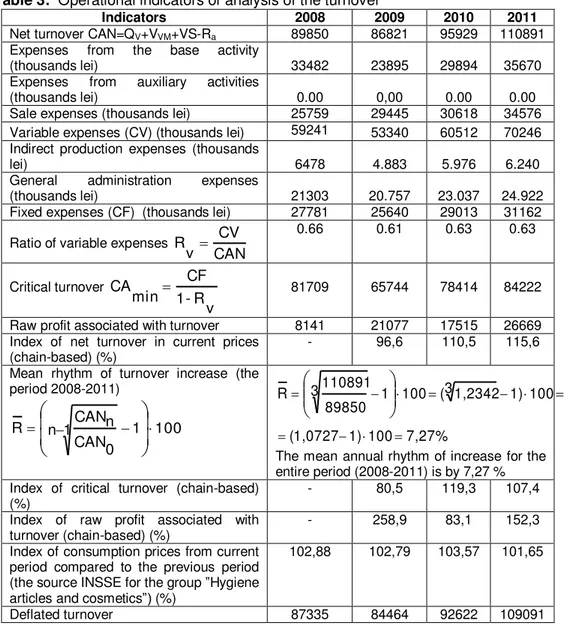
The net turnover represents the total income obtained from the commercial activity (through sale of goods manufactured) of an entreprise during a certain period of time. Certain authors assert that the turnover should represent about 85% of the exploitation income and at least 75% of the total income of the economic entity, whereas in what concerns the dynamics, it should present a tendency of real increase in order to ensure development and consolidation of the strategic position of the entreprise (Mironiuc, M., 2006: 59). These indicators reflecting the level of the turnover are also called operational indicators (Niculescu, M., 1997: 229), and are presented and calculated in the Table 3.
Table 3: Operational indicators of analysis of the turnover
Indicators 2008 2009 2010 2011
Net turnover CAN=QV+VVM+VS-Ra 89850 86821 95929 110891
Expenses from the base activity
(thousands lei) 33482 23895 29894 35670
Expenses from auxiliary activities
(thousands lei) 0.00 0,00 0.00 0.00
Sale expenses (thousands lei) 25759 29445 30618 34576
Variable expenses (CV) (thousands lei) 59241 53340 60512 70246 Indirect production expenses (thousands
lei) 6478 4.883 5.976 6.240
General administration expenses
(thousands lei) 21303 20.757 23.037 24.922
Fixed expenses (CF) (thousands lei) 27781 25640 29013 31162
Ratio of variable expenses
CAN CV v R
0.66 0.61 0.63 0.63
Critical turnover v R -1 CF min
CA 81709 65744 78414 84222
Raw profit associated with turnover 8141 21077 17515 26669 Index of net turnover in current prices
(chain-based) (%)
- 96,6 110,5 115,6
Mean rhythm of turnover increase (the period 2008-2011) 100 1 1 n 0 CAN n CAN
R
7,27% 100 1) (1,0727 100 1) 3 1,2342 ( 100 1 3 89850 110891 R
The mean annual rhythm of increase for the entire period (2008-2011) is by 7,27 % Index of critical turnover (chain-based)
(%)
- 80,5 119,3 107,4
Index of raw profit associated with turnover (chain-based) (%)
- 258,9 83,1 152,3
Index of consumption prices from current period compared to the previous period (the source INSSE for the group”Hygiene articles and cosmetics”)(%)
102,88 102,79 103,57 101,65
CANR n-m = 100
0 m pn I
m n crt CAN
Real rate of increase of turnover (%)
100 1 p I CAN I
Real CAN
ΔI
- - 6,02 6,7 13,72
Indices of value of turnover in industry (the source INSSE domain ”Fabrication of
chemical substances and products”(%)
116,9 93,7 106,8 111,3
Source: Personal processing of data from the Account of Profit and Loss,
Explanatory Note ”Analysis of the exploitation result”, of the economic entity
analyzed and monthly Statistic Bulletins of the INSSE
By analyzing the evolution of the net turnover in current prices, we can observe it records a slow decrease in 2009 compared to 2008 (by 3,4%), but in the following years the situation improves and the turnover records increases by 10,5% in 2010 compared to 2009 and by 15,6% in 2011 compared to 2010. The dynamics of the turnover of the entity analyzed should be compared with the market dynamics, respectively to the dynamics of the sector of activity, in order to be relevant to establishing a strategy of development of the economic entity. If the sector is more dynamic than the economic entity, one can observe that the given entreprise will lose market interest, either due to the increase in superior rhythm of the volume of sales of the already existing competition, or due to the apparition of new competitors, or due to both causes combined. By comparing the index of the net turnover of the entity analyzed with the index of the value of turnover from the sector of activity in which it functions, we can observe that the situation is favourable, because even in the year when the turnover of the entreprise decreases, the sector records a stronger decrease (by an index of 93,7%), while in the other years the increase of the turnover of the entreprise is bigger than the sector increase, the entity being able to expand its business log.
the raw profit associated with turnover recording significant increases compared to the previous year (by 52,3%), against the background of steady maintaining of the mean ratio of variable expenses.
Since the turnover is expressed in current prices, a correct assessement of facts requires the adjustement of nominative indicators (current values) to the inflation rate corresponding to the sector of activity in which the economic entity functions, so that later in time the own effort of the economic entity could be pointed out. The data can be compared in time by deflating the indicator (deflated turnover). At the level of the entity analyzed, we can observe that the index of consumption prices for the category of goods marketed by the entreprise (hygiene articles and cosmetics), doesn’t record significant increases from one year to another, this is why the real turnover is very close to the level of nominative turnover, which reflects the fact that the economic entity has obtained an increase of turnover from one year to another based on its efforts to improve quality and diversify the choice of brands, while the sale price grows rather for economic reasons than due to inflation. The only year when the entity recorded a real decrease (of - 6,02%) of the turnover was 2009, due to the reduction of the nominative value of turnover, as well as to the growth of consumption prices for the group of specific products, however, as we already pointed out, the entire sector in which the economic entity analyzed activates was affected in that year. The next two years record a real increase of 6,7% in 2010 and of 13,7 % in 2011, for the entire period analyzed (2008-2011) the mean rhythm of increase of the turnover being of 7,27%.
4.Strategies of increase of the performance of the entreprise
The ways to improve the performance of the entreprise should come from two directions: minimizing efforts and maximizing effects, or surpassing of the rhythm of increase of expenses (efforts) by the rhythm of increase of the income (effects). Considering the observations displayed above, we can highlight the following possibilities of increasing the economic-financial performance of the entreprise: Reduction (optimisation) of costsbased on diminishing material and live labour
expenses by: use, as complet and efficient as possible, of existing capacity of production; introduction of new equipment and technology, superior in output; increase of the fund of time effectively used by elimination of time losses of any kind;; provision on schedule with raw materials and materials in quantity and quality adjusted to the process of production; optimum dimensioning of stocks of raw materials, products in course of execution and finished products; increase of the level of qualification of the working force;, through measures of enhancing the productivity of work;
The increase of the volume of productionrepresents an indirect way of enhancing the performance of activity, because it acts indirectly, by reducing costs, as fixed and slowly variable costs do not grow or grow in a rhythm which is inferior to the increase of the volume of production;
The acceleration of the speed of rotationof resources, respectively the shortening of the duration of a circuit also has positive effects upon profitability, due to the fact that we obtain a bigger volume of profit, without needing to increase also the volume of resources.
The use of the price indicator stimulates enterprises in order to ensure and increase profitability, but this can only be achieved in correlation with the increase of the qualitative level and of the complexity/diversity of products.
5. Conclusions
For any manager, the level of results obtained represents the measure of efficiency of the activity developed, and a part of this measure stands in reflecting the volume of activity and following its tendencies in time and in relation to other partners from the respective market. The production exerts a decisive influence upon all sides of the economic activity; this segment of activity influences to a great extent the financial results of the economic entity. Starting from the importance of the objectives of the activity of production, these should be followed both on the total of the economic entity and on its subdivisions. The program of production has to be followed not only in long intervals (year, semester), but also in shorter periods: trimester, month, decade, days. One should also never ignore the achievement of production tasks in terms of brands and structure, but mostly in terms of quality, so that the offer should meet the market demand.
The entity analyzed in this paper managed to obtain favourable and increasing results even in the period of economic recession, due to the strategy of development implemented. This strategy consisted in the accent placed on production (by diversifying the range of brands and improving the quality of existing products, by involvement in the activity of innovation through launching of new products, by making investments in machinery and equipment), but also on distribution (by opening agencies, purchasing fabrication licence for products acknowledged on the market, advertising by sustained marketing activity, notoriety given by the quality of products and the accessibility of prices, attracting of new retail contracts both in the country and abroad, the growth of quality and qualification of employees).
References
Buşe, L. (2005)Analiză economico-financiară,Editura Economică, Bucureşti Mironiuc, M., (2006) Analiza economico-financiară. Elemente teoretico
-metodologice şi aplicaţii,Editura Sedcom Libris, Iaşi
Niculescu, M. (1997) Diagnostic global strategic, vol. 1, Editura Economică, Bucureşti
Păvăloaia, W. (2003) Analiza economico-financiară. Concepte, studii de caz,
aplicaţii,Editura Moldavia, Bacău
Vâlceanu, Ghe.. Robu, V. Georgescu, N. (2004) Analiza economico-financiară, Editura Economică, Bucureşti
INSSE Buletine statistice lunare nr. 12/2008, nr.12/2009, nr. 12/2010, nr. 12/2011, http://www.insse.ro/cms/rw/pages/buletinelunare.ro.do