Roles of the 5
9
Flanking and Intron 1 Sequences
Yi Wang1., Tingting Guo1., Shuyong Zhao1., Zhixin Li1
, Yiqing Mao1, Hui Li1, Xi Wang1, Rong Wang1, Wei Xu1, Rongjing Song1, Ling Jin1, Xiuli Li2, David M. Irwin1,3*, Gang Niu4, Huanran Tan1*
1Department of Pharmacology, Peking University, Health Science Center, Beijing, China,2Department of Pharmacology, Chifeng College, Chifeng, China,3Department of Laboratory Medicine and Pathobiology, University of Toronto, Toronto, Ontario, Canada,4Beijing N&N Genetech Company, Beijing, China
Abstract
Background:Glucokinase plays important tissue-specific roles in human physiology, where it acts as a sensor of blood glucose levels in the pancreas, and a few other cells of the gut and brain, and as the rate-limiting step in glucose metabolism in the liver. Liver-specific expression is driven by one of the two tissue-specific promoters, and has an absolute requirement for insulin. The sequences that mediate regulation by insulin are incompletely understood.
Methodology/Principal Findings:To better understand the liver-specific expression of the human glucokinase gene we compared the structures of this gene from diverse mammals. Much of the sequence located between the 59pancreatic beta-cell-specific and downstream liver-specific promoters of the glucokinase genes is composed of repetitive DNA elements that were inserted in parallel on different mammalian lineages. The transcriptional activity of the liver-specific promoter 59 flanking sequences were tested with and without downstream intronic sequences in two human liver cells lines, HepG2 and L-02. While glucokinase liver-specific 59 flanking sequences support expression in liver cell lines, a sequence located about 2000 bases 39to the liver-specific mRNA start site represses gene expression. Enhanced reporter gene expression was observed in both cell lines when cells were treated with fetal calf serum, but only in the L-02 cells was expression enhanced by insulin.
Conclusions/Significance:Our results suggest that the normal liver L-02 cell line may be a better model to understand the regulation of the liver-specific expression of the human glucokinase gene. Our results also suggest that sequences downstream of the liver-specific mRNA start site have important roles in the regulation of liver-specific glucokinase gene expression.
Citation:Wang Y, Guo T, Zhao S, Li Z, Mao Y, et al. (2012) Expression of the Human Glucokinase Gene: Important Roles of the 59Flanking and Intron 1 Sequences. PLoS ONE 7(9): e45824. doi:10.1371/journal.pone.0045824
Editor:Srinivas Mummidi, University of Texas Health Science Center/South Texas Veterans Health Care System, United States of America
ReceivedMay 28, 2012;AcceptedAugust 24, 2012;PublishedSeptember 20, 2012
Copyright:ß2012 Wang et al. This is an open-access article distributed under the terms of the Creative Commons Attribution License, which permits unrestricted use, distribution, and reproduction in any medium, provided the original author and source are credited.
Funding:This study was supported by grants from the National Natural Science Foundation of China (NSFC) Grant Number 30772603, National Key Technologies R&D Program (Grant Numbers 2006BAF07B01, 2009BAK61B01, and 2009BAK61B04), and a grant from the National Science Foundation of China – Canadian Institutes of Health Research China-Canada Joint Health Research Initiative (Grant Numbers 81061120525 and CCI-109605). The funders had no role in study design, data collection and analysis, decision to publish, or preparation of the manuscript.
Competing Interests:Gang Nui is president and CEO of Beijing N&N Genetech Co. This does not alter the authors’ adherence to all the PLOS ONE policies on sharing data and materials.
* E-mail: [email protected] (HT); [email protected] (DMI)
.These authors contributed equally to this work.
Introduction
Mutations in the human glucokinase (GCK) gene can lead to the MODY2 form of diabetes [1] and to persistent hyperinsulin-emic hypoglycemia of infancy (PHHI) [2]. Inactivating mutations cause MODY2 while activating mutations result in PHHI [1,2]. Glucokinase, the enzyme encoded by the GCK gene, catalyzes the reaction ATP+D-glucoseRADP+D-glucose-6-phosphate, the first and obligatory step for glucose utilization after glucose is transported into a cell, and allows the storage of excess glucose as glycogen in liver cells [3]. Phosphorylation of glucose not only is a key step in the metabolism of glucose but also involved in the sensing of blood glucose levels, thereby regulating the release of insulin by pancreatic beta cells [3,4]. Glucokinase, thus, has important roles both in regulating insulin release from pancreatic beta-cells and metabolism of glucose in liver cells, both of which
have significant impact on blood glucose levels. Deficiency of glucokinase from either the pancreas or the liver has been shown to have important roles in the development of MODY2 [5].
The structure of the glucokinase genes has been characterized in human, mouse and rat [6–8] where it has been shown to have two promoters that are expressed in a tissue-specific pattern [4,9]. The 59promoter is used by pancreatic beta-cells, as well as a few cells from the gut and central nervous system, and in human and rodent glucokinase genes is located 25–30 kb upstream of a 39
more than 7.5 kb of liver-specific glucokinase promoter 59flanking sequence are required for liver-specific expression [7,12]. Trans-genic mice bearing 83 kb of the human glucokinase locus do show both specific and beta-cell specific expression, with the liver-specific expression regulated by insulin, thus appearing to contain the entire glucokinase locus [12]. Liver-specific expression of glucokinase is absolutely dependent upon insulin [4,9,13]. While the PI3-kinase and Protein kinase B (PKB, also called Akt) are known to be necessary for the regulation of liver-specific glucokinase expression [14], the specific factors that interact with the glucokinase gene remain elusive [4]. Some studies have suggested a role for SREBF (SREBP-1c) [15,16] however other experiments have failed to show a direct role of SREBF including the failure to find SREBF binding to the glucokinase liver-specific promoter [17,18]. Similarly, contradictory evidence has been advanced for a role by FOXO1, where little change in glucokinase levels was seen in the livers of Foxo1 knockout mice [19] but in vitro studies suggest that Foxo1 inhibits HNF4-potentiated expression [20]. Most functional studies have focused on the promoter and 59flanking regions of the liver-specific glucokinase promoter. Early DNase I hypersensitive site mapping studies indicated that hypersensitive sites, which are potential regulatory regions, exist not only in the 59flanking sequence, but also exist in the 1st intron downstream of the liver-specific 1st exon of the glucokinase gene [7,21,22]. Here we examined sequences near the human liver-specific glucokinase promoter and demonstrate that intron 1 sequence play a role in the expression of the human glucokinase gene in human liver cells.
Materials and Methods
Bioinformatic Analysis
The genomic sequence encoding the human glucokinase gene was downloaded from Release 65 of the Ensembl database (http://www. ensembl.org) in December 2011. Additional mammalian glucokinase gene sequences were identified from the Ensembl database, release 65, either due to their annotation as orthologs of the human GCK gene or by searching the genome sequences using BLAST with the human glucokinase protein sequence. Repetitive DNA elements in the genomic sequences were identified using RepeatMasker [23] (http://www.repeatmasker.org). Genomic sequences were aligned using the program MultiPipMaker [24,25]. Potential transcription factor binding sites in the human glucokinase genomic sequences were identified using Matinspector (http://www.genomatix.de) and TFSEARCH (http://www.cbrc.jp/research/db/TFSEARCH. html).
Plasmid Constructs
Human glucokinase genomic sequences were amplified using the polymerase chain reaction from human genomic DNA purchased from Clontech (Palo Alto, USA). Primers used to make the reporter gene constructs (see Fig. S1) are listed in Table S1. Glucokinase liver-specific 59 flanking sequences spanning bases
23,815 to +135 and base21,049 to+135, relative to the liver-specific mRNA start site, were amplified from genomic DNA with primers that had HindIII and SacI restriction endonuclease digestion sites added, to the 59and 39primers, respectively, to aid in directional cloning. Genomic fragments were cloned into pMD18-T (Takara, Japan) generating plasmids pGK-3815T and pGK-1049T and the sequences were verified by sequencing. These clones were then used to construct the reporter gene plasmids. The 3950 bp and 1,184 bp HindIII-SacI genomic fragments, containing the liver-specific promoter, were cloned into the luciferase reporter plasmid pGL2 Basic (Promega, USA)
to generate pGK-3815Luc and pGK-1049Luc plasmids, respec-tively. Glucokinase intron 1 sequence, representing bases+211 to +4,868, relative to the mRNA start site, was amplified from genomic DNA with primers that included BamHI and SalI recognition sites at the 59and 39ends, respectively. Plasmid pGK-intr1Luc was constructed by inserting the 4,658-bp BamHI-SalI intron 1 genomic fragment into the corresponding sites of pGL2 Basic, downstream of the luciferase reporter gene transcription termination site. To generate glucokinase promoter-reporter constructs that contained intron sequences, plasmids pGK-3815T and pGK-1049T were digested with SacI and the respective 4 kb and 1 kb SacI-SacI fragments were ligated into the corresponding site of pGK-intr1Luc in the sense orientation. These ligations yielded plasmids 3815intr1Luc and pGK-1049intr1Luc, reporter plasmids that contain both human glucokinase promoter and intron sequences, with the intron sequences located 39to the reporter gene transcription termination site, and thus they were not included in the luciferase mRNA transcript. Plasmids pGK-38Luc, pGK-161Luc, pGK-345Luc, pGK-571Luc pGK-753Luc and pGK-969Luc (see Fig. S1) were constructed by inserting 38-bp, 161-bp, 345-bp, 571-bp, 753-bp, 969-bp of liver-specific glucokinase promoter DNA together with 135 bp of exon 1 sequence, amplified by PCR, and cloned into the HindIII and SacI in pGL2 Basic. To test the activity of fragments of intron 1, 500–1000 base long sections of intron 1 (segments I-1– I-6, Fig. S1) were amplified by PCR and inserted into the BamHI-SalI sites 39to the luciferase reporter gene in the pGK-1049Luc reporter plasmid (see Table S1 for primers). Smaller portions of segment I-3 (a – e, see Fig. S1) were also amplified and cloned into the BamHI-SalI site downstream of the luciferase reporter gene in pGK-1049Luc reporter plasmid vector.
Cell Culture and Transfection
and a capacitance of 960 mF and voltage of 220 V was found to yield transfection efficiency of 54% and 48% for HepG2 and L-02 cells, respectively. Cuvettes were returned to ice for 10 min and the cells were then transferred to tubes containing 1.2 ml of DMEM plus antibiotics and 10% fetal calf serum and 200ml aliquots of the cell suspension were pipetted into wells of 96-well culture plates (Corning, USA). After 3 h of culture in a CO2 incubator the medium was replaced. Glucokinase promoter reporter gene constructs were transfected in cells cultured in DMEM, for HepG2, or RPMI-1640, for L-02, media under three different conditions: (1) with insulin (100 nM), (2) with 10% fetal calf serum, and (3) with neither insulin nor serum. Cell culture was continued for 20 h and then cells were cell harvested for the measurement of firefly and Renilla luciferase activities.
Reporter Enzyme Assays
Reporter gene assays of the transfected cells were performed using the Dual-Luciferase Reporter Assay kit (Promega, USA) and luminescence was measured using a GloMax 96 Microplate Luminometer (Promega, USA). Results were expressed as the ratio of luciferase luminescence to Renilla luminescence, thereby normalizing the results to the internal control.
RT-PCR
Endogenous expression of GCK (glucokinase), GCKR (gluco-kinase regulatory protein), PCK1 (phosphoenol pyruvate (gluco-kinase), GYS2 (glycogen synthase 2), PYGL (glycogen phosphorylase), G6PC (glucose-6 phosphotase) INSR (insulin receptor), SREBF (sterol response element-binding protein-1c), HNF4A (hepatic nuclear factor-4), FOXO1 (forkhead box protein 01), PPARG (peroxisome proliferator-activated receptor gamma), FASN (fatty acid synthase), IRS1 (insulin receptor substrate 1), IRS2 (insulin receptor substrate 2), PKLR (pyruvate kinase, liver and red blood cell), ChREBP (carbohydrate response element binding protein), GAPDH (glyceraldehyde phosphate dehydrogenase) and b-actin mRNAs in HepG2 and L-02 cells was examined by RT-PCR. GAPDH and beta-actin were used as controls. Primers for RT-PCR are listed in Table S2 and were synthesized by Takara (Japan). Cells were plated in 24-well plates and total RNA was extracted using Trizol (Life Technologies, USA). 2mg of RNA was then applied to a reverse transcription reaction using High-Capacity cDNA Reverse Transcription kits (Applied Biosystems, USA) to synthesize cDNA. The PCR protocol to amplify each gene consisted of incubation at 95uC for 5 min, followed by amplification for 40 cycles of three steps at 95uC for 4 min, annealing temperature for 45 sec and 72uC for 45 sec, and then a final extension at 72uC for 10 min. Annealing temperate for the PCR for each gene is listed in Table S2.
Statistical Analysis
Results are presented as mean 6 SD from at least three independent experiments. All luciferase assays were performed in triplicate. Data were analyzed by ANOVA followed by paired Student’s t-tests using the Windows SPSS 13.0 computer software. Differences were considered statistically significant if P,0.05.
Results
Conservation of the Structure of Mammalian Glucokinase Genes
Our understanding of the sequences required for the regulation of liver-specific expression of the human glucokinase gene is incomplete [4]. As a first step we compared the structures of glucokinase genes from diverse species. A limited number of
glucokinase genes have previously been characterized, where it was found that a pancreatic beta-cell promoter is located 25–30 kb 59 to a liver-specific promoter [6,7,9]. Genomic sequences encoding glucokinase genes were identified and downloaded from all 43 mammalian genomes available in the Ensembl and PreEnsembl genome databases (http://www.ensembl.org) in December 2011 (Table 1). Of the 43 genomes examined, only 19 predict complete glucokinase genes (see Tables 1 and S3) composed of 9 exons that are shared (exons 2–10) by the two transcripts and two alternative initiating 1st exons (beta-cell and liver-specific). Genomes with complete genes spanned the diversity of mammals and included a marsupial and diverse placental mammalian orders (see Fig. 1 and Table 1). Most of the incomplete genes were obtained from genomes that are of draft quality and are composed of short contigs or contigs with gaps, thus missing exons may fall within gaps or beyond the ends of contigs, or may be miss-assembled. An example of a potential miss-assembly is the chimpanzee glucokinase gene, where the beta-cell-specific 1stexon is placed 39(instead of 59) to the coding exons. A potential exception to the conserved structure of the mammalian glucokinase genes is the little brown bat (Myotis lucifugus, called Microbat in Ensembl) (Table 1). The genomic sequence encoding the little brown bat glucokinase gene fails to predict a liver-specific 1stexon (Table S3), despite having a contiguous sequence between the beta-cell-specific 1stexon and exon 2, the location where the liver-specific exon is expected to be located. Whether this reflects an incorrect assembly, or the loss of this exon in this bat species requires further study. Intriguingly, bats are one of the few species of mammals that were reported to be deficient in liver glucokinase activity [31].
To further examine the conservation of the structure of glucokinase genes in mammals the sizes of the introns in the glucokinase genes were determined for all 43 species (Table S3). Exon sizes showed minimal size variation (results not shown), as they are largely composed of coding sequence. When present, the intron between the beta-cell-specific 1st exon and exon 2 was always the largest intron, with the intron between the liver-specific 1stexon and exon 2 being the next largest (Table S3). The beta-cell intron was more than 20 kb long in most species, with only four species having an intron length shorter than 10 kb (sloth, 4.6 kb; little brown bat, 6.9 kb; flying fox bat, 8.7 kb; platypus, 9.8 kb – Table S3). For all four of these species the liver-specific exon was not found (Table S3), however for three of these, a gap in the genome assembly exists between the beta-cell exon and exon 2 raising the possibility of having a larger intron (with a liver-specific exon) or miss-assembly. The intron between the liver-specific 1st exon and exon 2 was the second largest (or largest if the beta-cell exon was missing) and ranged in size from 3 to 8.5 kb (Table S3). The remaining glucokinase gene introns (introns 2–9) in all species were much shorter, with most being less than 2 kb and only a few greater than 3 kb (Table S3). A conserved pattern of intron sizes was generally observed with smaller introns (i.e., introns 2, 4, 5, 8, and 9) being smaller in most species, and the larger introns (i.e., beta-cell and liver-specific exon 1, and exons 3, 6, and 7) being larger (Table S3). Introns with the greatest variation in size were the largest introns.
master sequence (in Fig. 1 the master is the human sequence, with the annotation of the human gene and repetitive DNA content shown on the top line) with the similarity of the compared sequence, between 50–100%, indicated for each species. The sequence from the marsupial Tasmanian devil sequence showed limited similarity to the human genomic sequence (Fig. 1), with similar results found when other genomic sequences were used as
the master sequence (see Fig. S2 as an example), with similar sequences confined largely to the coding exons, consistent with most intron and flanking sequence having limited biological function and thus not strongly conserved. When comparisons are limited to between genes from placental mammalian species, many of the intron sequences, especially those of introns 2 through 9, show identities greater than 50%, with exon sequences showing Figure 1. Alignment of glucokinase gene sequences from diverse mammals. A genomic sequence alignment was generated by MultiPipMaker [24,25]. The sequence is numbered (in kilobases, k) from the 59end of the liver-specific transcript, with 59flanking sequence numbered backwards. Exons are represented as tall boxes, and are numbered from the 59end of the transcripts. The arrow, labeled GCK, represents the liver-specific glucokinase transcript. Beta refers to the 1stexon of the beta-cell-specific GCK transcript, which is spliced to join exon 2. Tissue-specific first exons are labeled as 1B, for the pancreatic beta-cell-specific 1stexon, and 1L, for the liver-cell-specific 1stexon. Filled tall boxes are coding exon sequences, while shaded boxes are untranslated sequences. The percentage sequence identity (if above 50%) of the mouse, cow, horse, hyrax, and Tasmanian devil GCK genomic sequences to the human genomic sequence is shown for each species below the human genomic region schematic. Repetitive DNA elements, and sequence shown high GC content are also identified using the symbols shown in box at the lower right.
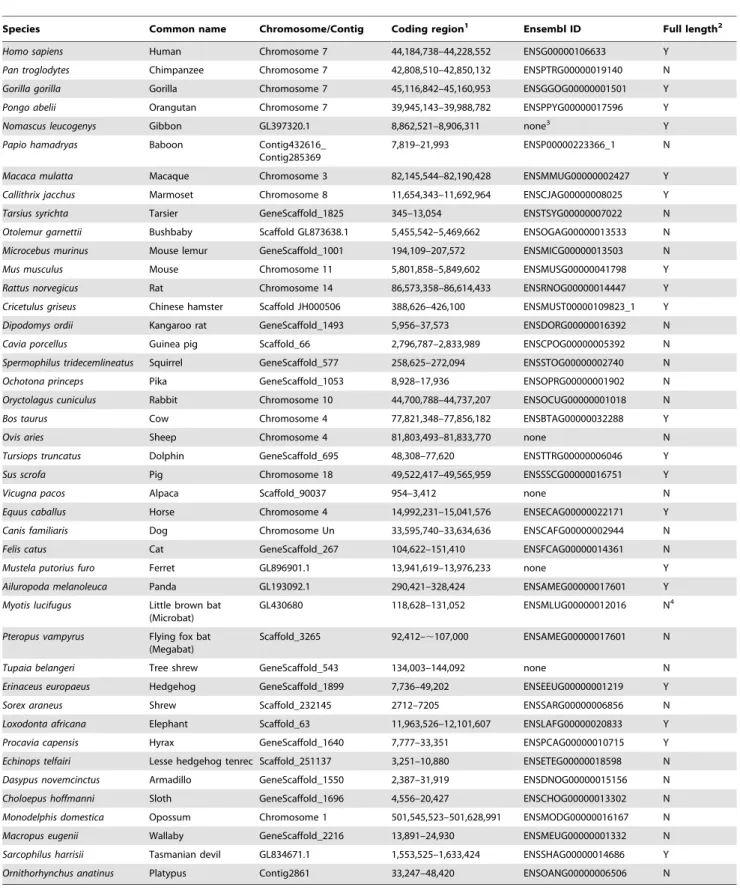
Table 1.Genomic locations of glucokinase genes in diverse mammalian genomes.
Species Common name Chromosome/Contig Coding region1 Ensembl ID Full length2
Homo sapiens Human Chromosome 7 44,184,738–44,228,552 ENSG00000106633 Y
Pan troglodytes Chimpanzee Chromosome 7 42,808,510–42,850,132 ENSPTRG00000019140 N
Gorilla gorilla Gorilla Chromosome 7 45,116,842–45,160,953 ENSGGOG00000001501 Y
Pongo abelii Orangutan Chromosome 7 39,945,143–39,988,782 ENSPPYG00000017596 Y
Nomascus leucogenys Gibbon GL397320.1 8,862,521–8,906,311 none3 Y
Papio hamadryas Baboon Contig432616_ Contig285369
7,819–21,993 ENSP00000223366_1 N
Macaca mulatta Macaque Chromosome 3 82,145,544–82,190,428 ENSMMUG00000002427 Y
Callithrix jacchus Marmoset Chromosome 8 11,654,343–11,692,964 ENSCJAG00000008025 Y
Tarsius syrichta Tarsier GeneScaffold_1825 345–13,054 ENSTSYG00000007022 N
Otolemur garnettii Bushbaby Scaffold GL873638.1 5,455,542–5,469,662 ENSOGAG00000013533 N
Microcebus murinus Mouse lemur GeneScaffold_1001 194,109–207,572 ENSMICG00000013503 N
Mus musculus Mouse Chromosome 11 5,801,858–5,849,602 ENSMUSG00000041798 Y
Rattus norvegicus Rat Chromosome 14 86,573,358–86,614,433 ENSRNOG00000014447 Y
Cricetulus griseus Chinese hamster Scaffold JH000506 388,626–426,100 ENSMUST00000109823_1 Y
Dipodomys ordii Kangaroo rat GeneScaffold_1493 5,956–37,573 ENSDORG00000016392 N
Cavia porcellus Guinea pig Scaffold_66 2,796,787–2,833,989 ENSCPOG00000005392 N
Spermophilus tridecemlineatus Squirrel GeneScaffold_577 258,625–272,094 ENSSTOG00000002740 N
Ochotona princeps Pika GeneScaffold_1053 8,928–17,936 ENSOPRG00000001902 N
Oryctolagus cuniculus Rabbit Chromosome 10 44,700,788–44,737,207 ENSOCUG00000001018 N
Bos taurus Cow Chromosome 4 77,821,348–77,856,182 ENSBTAG00000032288 Y
Ovis aries Sheep Chromosome 4 81,803,493–81,833,770 none N
Tursiops truncatus Dolphin GeneScaffold_695 48,308–77,620 ENSTTRG00000006046 Y
Sus scrofa Pig Chromosome 18 49,522,417–49,565,959 ENSSSCG00000016751 Y
Vicugna pacos Alpaca Scaffold_90037 954–3,412 none N
Equus caballus Horse Chromosome 4 14,992,231–15,041,576 ENSECAG00000022171 Y
Canis familiaris Dog Chromosome Un 33,595,740–33,634,636 ENSCAFG00000002944 N
Felis catus Cat GeneScaffold_267 104,622–151,410 ENSFCAG00000014361 N
Mustela putorius furo Ferret GL896901.1 13,941,619–13,976,233 none Y
Ailuropoda melanoleuca Panda GL193092.1 290,421–328,424 ENSAMEG00000017601 Y
Myotis lucifugus Little brown bat (Microbat)
GL430680 118,628–131,052 ENSMLUG00000012016 N4
Pteropus vampyrus Flying fox bat (Megabat)
Scaffold_3265 92,412–,107,000 ENSAMEG00000017601 N
Tupaia belangeri Tree shrew GeneScaffold_543 134,003–144,092 none N
Erinaceus europaeus Hedgehog GeneScaffold_1899 7,736–49,202 ENSEEUG00000001219 Y
Sorex araneus Shrew Scaffold_232145 2712–7205 ENSSARG00000006856 N
Loxodonta africana Elephant Scaffold_63 11,963,526–12,101,607 ENSLAFG00000020833 Y
Procavia capensis Hyrax GeneScaffold_1640 7,777–33,351 ENSPCAG00000010715 Y
Echinops telfairi Lesse hedgehog tenrec Scaffold_251137 3,251–10,880 ENSETEG00000018598 N
Dasypus novemcinctus Armadillo GeneScaffold_1550 2,387–31,919 ENSDNOG00000015156 N
Choloepus hoffmanni Sloth GeneScaffold_1696 4,556–20,427 ENSCHOG00000013302 N
Monodelphis domestica Opossum Chromosome 1 501,545,523–501,628,991 ENSMODG00000016167 N
Macropus eugenii Wallaby GeneScaffold_2216 13,891–24,930 ENSMEUG00000001332 N
Sarcophilus harrisii Tasmanian devil GL834671.1 1,553,525–1,633,424 ENSSHAG00000014686 Y
Ornithorhynchus anatinus Platypus Contig2861 33,247–48,420 ENSOANG00000006506 N
1Bases spanning the N-terminus to C-terminus of the encoded protein.
2Y, indicates that all 11 exons (2 tissue specific and 9 shared) could be predicted from the genomic sequence. N, indicates that at least one exon could not be predicted. 3None indicates that a gene was not annotated in the genome assembly.
even higher levels of identity (Figs. 1 and S2). Some areas failed to show a similarity above 50%; however, most of these correspond-ed to gaps in the genomic sequences (and thus have no sequence similarity). In contrast to the 39 introns, the intronic sequence between the beta-cell specific exon and the liver cell-specific, but not the intron between the liver-specific exon and exon 2, possessed less sequence that had a similarity of 50–100% with the human genomic sequence (Fig. 1). The majority of the low similarity seen at the 59end of the gene sequence was not due to gaps in the sequences. Similar results were seen if the mouse, cow, horse or hyrax gene sequence was used as the master sequence (Fig. S2 and results not shown). Similarity of the flanking sequence 59 to the liver-specific exon was limited to the first 4 kb of the 30 kb sequence between the human liver-specific and beta-cell-specific exons (Fig. 1). The 4 kb of human liver-beta-cell-specific 59flanking sequence corresponded to about 6 kb of mouse liver-specific 59
flanking sequence and about 4 kb of 59flanking sequence in the cow, horse, and hyrax (Fig. S2 and data not shown). The more extended mouse 59flanking sequence was due to the presence of repetitive DNA elements that had inserted within the 6 kb 59
flanking sequence that were not orthologous to sequences in the other mammalian gene sequences (Fig. S2).
The presence of repetitive DNA elements explains much of the non-orthology of the sequence between the beta-cell and liver-specific 1stexons. As seen in the MultiPipMaker plots (Figs. 1 and S2) much of the human genomic sequence located between the beta-cell and liver-specific exons is annotated as repetitive DNA. More than 60% of the sequence between these two exons in the human glucokinase gene is derived from repetitive elements, with similar high percentages found for the other mammalian genes examined (Table 2). Among placental mammals, the proportion of the intronic sequence composed of repetitive DNA was much higher between the two tissue-specific exons (37–71%) than between the liver-specific exon and exon 2 (1–23%) or within introns 2–9 (11–21%) (Table 2). Only in the Tasmanian devil, a marsupial, does the sequence between the beta-cell and liver-specific exons have a lower percentage of repetitive DNA (49.7%) than for any other portion of the gene (e.g., 51.1% for the liver-specific exon to exon 2), although this gene has a very high proportion of repetitive DNA across its entire sequence as even introns 2–9 are largely composed (39.8%) of repetitive DNA (Table 2). The high proportion of repetitive DNA in the Tasmanian devil glucokinase gene may in part explain the larger sizes of introns in the gene in this species (Table S3) and for the limited similarity seen in the MultiPipMaker plots (Figs. 1 and S2, and results not shown). A diverse variety and variable number of repetitive DNA elements were found in the genomic sequences between the two tissue-specific 1stexons (Table S4) consistent with most of these elements being inserted into the genes since the radiation of placental mammals. These results suggest that only about 4 kb of sequence 59 to the liver-specific exon is shared among mammals and only these sequence may contribute to the regulation of gene expression. Most of the sequences between these two tissue-specific 1stexons, especially those more than 4 kb 59to the liver-specific mRNA start site is of relatively recent origin from repetitive DNA elements, and thus likely has no role in the regulation of glucokinase gene expression. In contrast to the liver-specific 59flanking sequence, most of the sequence downstream of the liver-specific 1stexon is shared among mammals, raising the possibility that these sequences have a role in regulating glucokinase gene expression.
Regulatory Activity of the Human Glucokinase Liver-specific 59Flanking and Intron 1 Sequences
Since only 4 kb of liver-specific exon 59flanking sequence and intron 1 sequences are conserved among mammals, and DNase I hypersensitive sites have been mapped to both of these regions [7,21,22] we tested the ability of these sequences to regulate luciferase reporter gene expression in two human liver cell lines. In addition to testing the reporter genes in the well-established HepG2 cell line that has been used in a number of experiments studying the expression of the glucokinase gene promoter [13,20,32–34], we also tested the constructs in a second human liver cell line, the normal liver cell line L-02 [27]. To examine whether the L-02 cells would be suitable for studying the regulation of glucokinase gene expression we first determined whether L-02 and HepG2 cells express similar profiles of metabolic genes. Expression of GCK, GCKR, components of the insulin signaling pathway (INSR, IRS1, and IRS2), other metabolic enzymes (IPK, PCK1, PYGL, GYS2, and FASN), as well as selected DNA binding proteins involved in the regulation of metabolism (ChREBP, SREBF, NHF4A, PPARG, and FOXO1) were assessed by RT-PCR for cells grown in culture in the presence or absence of insulin or fetal calf serum (Fig. S3). As is typically seen for hepatic cell lines [5], significant expression of the glucokinase gene was not detected in either L-02 or HepG2 cells. Comparing the gene expression profiles of L-02 to HepG2 showed that both cell lines usually express similar levels for most of the genes examined, although slightly higher levels of GCKR and lower levels of SREBF were detected in L-02 (Fig. S3). The increased level of GCRK expression observed by RT-PCR in L-02 cells was confirmed by quantitative real-time RT-PCR (results not shown). RT-PCR experiments showed that there was little change in the expression of the genes due to the presence or absence of insulin or serum for either HepG2 or L-02 cells, except for GCKR in HepG2 (confirmed by quantitative real time RT-PCR, results not shown). It appears that L-02 should be an appropriate cell model system for understanding liver-specific expression of the human glucokinase gene.
Reporter genes were constructed that contained 1,049 or 3,815 bases of human liver-specific 1st exon 59 flanking sequence and 135 bases of this exon placed upstream of a luciferase reporter gene (plasmids 1049Luc and pGK-3815Luc, respectively). These two 59 flanking regions were also placed in vectors that contained 4,658 bases of liver-specific intron 1, plasmids pGK-1049intr1Luc and pGK-3815intr1Luc, with the intronic sequence placed 39 to the luciferase reporter, thus in a similar position to that found in the endogenous gene.
Table 2.Repetitive DNA content of introns within mammalian glucokinase genes.
Beta – Liver1 Liver - Intron 22 Introns 2–93
Species Size % Rep Size % Rep Size % Rep
Human 29,229 60.7 5,609 15.1 12,584 17.0
Mouse 34,421 59.2 3,942 1.3 11,944 18.4 Cow 22,081 37.5 3,949 11.8 11,152 11.4
Horse 36,391 50.3 4,932 22.7 11,417 14.9
Hyrax 8,372 51.8 7,649 22.9 15,606 20.8
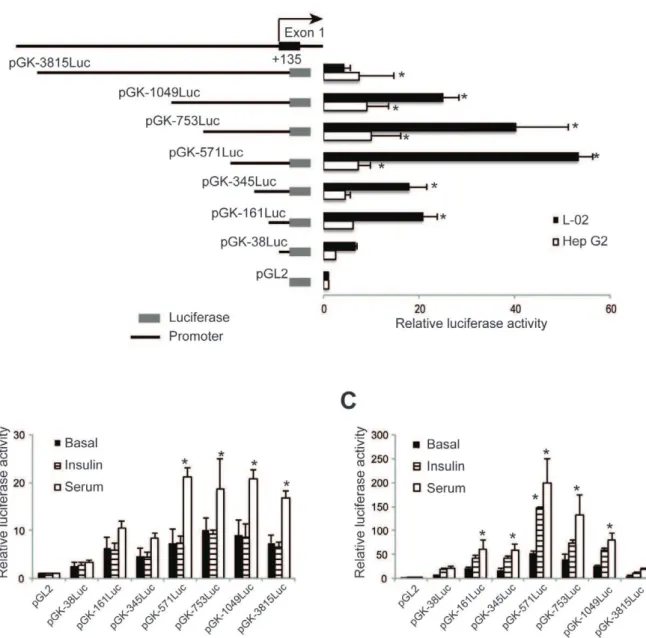
The intron sequences were cloned downstream of the luciferase transcription unit, thus do not need to be spliced from the reporter mRNA to allow translation of the luciferase enzyme. The four reporter gene constructs, along with a construct that contained only the intron sequence cloned downstream of the luciferase reporter (pGKIntr1Luc), were transfected into two human liver cell lines (HepG2 and L-02), a hamster pancreatic beta-cell line (HIT) and a human intestinal cell line (HCT-8) (Fig. 2A). As shown in Fig. 2A significant reporter gene activity was only detected in the two human liver cell lines, indicating that the activity of the reporter constructs was tissue-specific and that the liver-specific promoters do not function in a cell line that represents the beta-cell-specific site of expression (HIT) nor in a cell line derived from a tissue where the glucokinase gene is not normally expressed (HCT-8). Strongest expression of the reporter gene was observed for the construct that contained only the 1049 bases of glucokinase 59 flanking sequence, however the construct with 3,815 bases of 59 flanking sequence also supported significant levels of reporter expression in HepG2 cells (Fig. 2A). The lower levels of expression with 3,815 base of 59 flanking sequence may suggest that negative regulatory elements reside in the sequence between bases 21049 and
23815. Intriguingly, addition of intron 1 sequence to either 1049 or 3815 bases of 59 flanking sequence (pGK-1049intr1Luc and pGK-3815intr1Luc, respectively) resulted in significantly reduced levels of reporter gene expression in HepG2 cells (Fig. 2A). For the L-02 cells, a similar significant repression was observed with the reporter construct with 1049 bases of 59
flanking sequence, but since the 3815 base construct by itself did not generate a significant increase over background the observed reduction for the plasmid with the intron sequences was not significant (Fig. 2A). As the intron sequences are not part of the reporter gene transcript, these results suggest that the sequences within intron 1 act to repress expression of the liver-specific glucokinase promoter.
Regulation of Liver-specific Glucokinase Promoters by Insulin and Fetal Calf Serum
Expression of the glucokinase gene in the liver is absolutely dependent upon the presence of insulin [4,9]. We tested the activity of our 59 flanking region and intron containing reporter gene constructs under basal conditions and after exposure to 100 nM insulin or 10% fetal calf serum for 20 hours (Figs. 2B and 2C). As has been previously reported [9], glucokinase reporter gene constructs in HepG2 cells were unresponsive insulin, but did show a statistically significant increase (P,0.05) in the presence of fetal calf serum for the plasmids 3815Luc and pGK-1049Luc (Fig. 2B). A small increase with fetal calf serum was seen in the pGK-1049Intr1Luc intron-containing construct, but it did not reach statistical significance and the intron containing construct with the longest 59flanking region, pGK-3815Intr1Luc had minimal activity under all treatments (Fig. 2B). In contrast to HepG2, a significant (P,0.05) increase in reporter gene activity was observed with the pGK-1049Luc promoter construct in response to insulin (Fig. 2C). Small increases were also observed with the pGK-3815Luc and pGK-1049Intr1Luc constructs, but they were not statistically significant. When the constructs were treated with fetal calf serum in the L-02 cells, significant increases in reporter gene activity were seen with the 1049Luc, pGK-3815Luc, and pGK-1049Intr1Luc constructs (Fig. 2C). Since the introduced human liver-specific glucokinase promoter could be induced by insulin, these results suggest that the L-02 cell line might be a better model for understanding the mechanisms by
which insulin regulates liver-specific glucokinase promoter func-tion.
Regulatory Elements in the 59Flanking Sequence of the Human Liver-specific Glucokinase Promoter
To better define the sequences in the 59 flanking sequence of the human liver-specific glucokinase promoter necessary for expression and for regulation by insulin and fetal calf serum a series of reporter constructs were generated that have differing lengths of 59 flanking sequence. The activities of the promoter deletion constructs were tested in human liver HepG2 and L-02 cell lines (Fig. 3). Since 1,049 bases of 59 flanking sequence generated more reporter gene activity than plasmids with 3,815 bases (Fig. 2A), implying the presence of negative regulatory sequences upstream of base 21049, we focused on deletions starting from base 21049. Greater activity was observed in L-02 cells than in HepG2 cells, except for the longest construct pGK-3815Luc (Fig. 3A). Reporter gene constructs with as little as 161 bases and as much as 1049 bases of 59flanking sequence supported significant reporter gene activity in L-02, but only constructs with 2571 bases or more, including the construct with 3815 bases, supported significant reporter activity in HepG2 cells (Fig. 2A). These results suggest that there are two areas in the liver-specific glucokinase 59 flanking sequence that provide positive activity: 1, the sequence between bases
238 and2161, which supports activity in L-02 cells; and 2, the sequence between bases 2345 and 2571, which is required by HepG2 cells. The region between bases2345 and 2571 likely also contributes to the greater activity of the pGK-571Luc construct, compared to the pGK-345Luc construct, in L-02 cells (Fig. 3A). Evidence for several negatively acting regions located upstream of base 2571 was also found (Fig. 3A). Maximum reporter gene activity was observed with the pGK-571Luc construct in L-02 cells with lower activity observed with the pGK-753Luc, pGK-1049Luc, and pGK-3815Luc constructs in L-02, with the pGK-3815Luc construct having a level of reporter activity that was not significantly greater than that of a vector without a promoter (pGL2) (Fig. 3A). These results suggests that negative acting sequences exist in the human glucokinase liver-specific 59 flanking sequence.
We also tested the ability of the shorter promoters to be regulated by insulin and fetal calf serum (Figs. 3B and 3C). In HepG2 cells, addition of insulin did not change the level of reporter gene expression of any of the glucokinase promoter constructs (Fig. 3B). Treatment with fetal calf serum, on the other hand, resulted in a significant enhancement of reporter gene expression in promoter constructs that had at least 571 bases of 59 flanking sequence (Fig. 3B). These results suggest that sequences responsive to a factor in fetal calf serum are located between bases2345 and 2571. In contrast to HepG2, insulin increased the expression of glucokinase promoters in the L-02 cell line (Fig. 3C). A significant increase in reporter gene activity was observed in the presence of insulin with the pGK-571Luc construct, indicating that an insulin responsive element is located between bases 2345 and 2571 of the human glucokinase liver-specific promoter. Increases in reporter activity were also seen with the 2753 and 21049 base reporter constructs, but the increase did not reach statistical significance in this experiment (Fig. 3C). Similarly, increases in reporter activity were seen with glucokinase promoter constructs when L-02 cells were treated with fetal calf serum (Fig. 3C). A significant increase was seen with as little as 161 bases of 59
promoter constructs (Fig. 3C). These results suggest that an element response to a factor found in serum resides between bases 238 and 2161 in the human liver-specific glucokinase promoter, and that potentially a second site, which may respond to a different factor present in serum, is located between bases
2345 and 2571. In addition, these results suggest that sequences upstream of base 2571 have a negative effect on both the insulin and serum responsiveness of the promoter constructs in the L-02 cell line.
Regulatory Elements in the Liver-specific Intron 1 of the Human Glucokinase Gene
When sequences from intron 1 are placed downstream of the luciferase coding sequence lower reporter gene activity was observed for both the 1049 and 3815 base liver-specific glucokinase promoter constructs (Fig. 2A). To determine which portion of the intron confers this negative activity we subcloned 6 fragments of the intron (I-1 to I-6, see Fig. S1) and placed them downstream of the luciferase reporter gene in pGK-1049Luc. The reporter gene activity of these constructs are shown in Fig. 4A. In Figure 2. Intron 1 sequences regulate expression of the human glucokinase promoter.A. Schematic illustrations of reporter gene constructs with 1049 or 3815 bases of liver-specific glucokinase 59flanking sequence with or without intron 1 are shown on the left. Solid boxes are the luciferase-coding regions. Thin lines represent glucokinase 59flanking sequences (1049 or 3815 bases) while the broken lines represent intron 1 sequences. See Fig. S1 for the locations of genomic fragments within the gene. To the right are the luciferase reporter activities detected in two human liver cell lines (L-02 and HepG2), a hamster pancreatic beta-cell line (HIT) and a human intestinal cell line (HCT8). Data are the Mean6S.D. of three independent experiments. Asterisk (*) indicates reporter gene activity that is significantly greater than that from pGL2 basic. Significant differences in the activity of constructs that differed due to the presence or absence of intronic sequences are indicated by the pound symbol (#), with the comparison shown by the lines (P,0.05). B and C, Responsiveness of the human glucokinase reporter constructs to insulin and fetal calf serum (serum) in HepG2 (B) and L-02 (C) cells. Basal refers to culture without insulin or serum. Constructs from part A were incubated in the presence of absence of 100 nM insulin or 10% fetal calf serum for 20 hours. Data are the Mean6SD of three independent experiments. Asterisk (*) indicates conditions that have significantly greater activity than the basal level for that construct (P,0.05).
HepG2, 5 of the 6 fragments show reporter activity levels similar to that of pGK-1049Luc, with only one fragment, fragment I-3, showing significantly lower reporter gene activity, and yielding reporter activity levels that are similar to those of the pGK-1049intr1Luc construct (Fig. 4A). Similarly, in L-02, fragment I-3, yielded significantly lower reporter gene activity, but in contrast to HepG2, fragment I-4 also had significantly lower reporter gene activity (Fig. 4A). These results suggest that sequences in intron 1 between bases 1951 and 2722 of the human glucokinase gene function to repress gene expression, with the possibility that a second sequence between bases 2720 and 3527 (fragment I-4) also have some activity, at least in some types of liver cells (e.g., L-02, Fig. 4A).
To better define the sequences that confer the negative regulatory activity in both liver cell lines, we subcloned smaller sections of intron fragment I-3 (fragments a–e, Fig. S1) and placed them downstream of the luciferase reporter gene in pGK-1049Luc (Fig. 4B). In both L-02 and HepG2 only one of the DNA subfragments, fragment 3a containing bases between 1951 and 2111, yields significantly lower reporter gene activity than the pGK-1049Luc vector, and this fragment generates a level of reporter activity that is similar to that of constructs containing all of the intron 1 sequences (pGK-1049Int1Luc) or fragment I-3 (pGKInt-3Luc) (Fig. 4B). These results suggest that sequences between bases 1951 and 2111, relative to the liver-specific mRNA start site, negatively regulate liver-specific glucokinase gene expression.
Figure 3. Transcriptional activity of deletions of the human glucokinase 59flanking sequence.A. Schematic illustrations of the human glucokinase promoter deletion constructs used to test promoter activity are shown on the left. See Fig. S1 for the locations of genomic fragments within the gene. Reporter gene activity in two human cell lines, HepG2 and L-02 is shown on the right. Asterisk (*) indicates reporter gene activity that is significantly greater than that from pGL2 basic. Data are the Mean6SD of three independent experiments. B and C. Responsiveness of the human glucokinase promoter constructs to insulin and fetal calf serum (serum) in HepG2 (B) and L-02 (C) cells. Basal refers to culture without insulin or serum. Constructs from part A were incubated in the presence of absence of 100 nM insulin or 10% fetal calf serum for 20 hours. Data are the Mean6SD of three independent experiments. Asterisk (*) indicates conditions that have significantly greater activity than the basal level for that construct (P,0.05).
Discussion
Human and rodent glucokinase genes possess two promoters that are utilized in a tissue-specific manner [6–8] with the 59most promoter used by pancreatic beta-cells, and a few cells in the gut and central nervous system, and a 39 promoter that is used exclusively by liver cells [4,9]. As little as 294 bases of
beta-cell-specific promoter 59 flanking sequence directs tissue-specific expression [10,11], however, the minimal sequences required for liver-specific expression have not been identified [4]. The only transgenic construct that achieved liver-specific glucokinase expression contains 83 kb of the human glucokinase locus [12] and transgenic mice with only 7.5 kb of human glucokinase liver-specific 59flanking sequence did not express the reporter gene in Figure 4. Analysis of the transcriptional activity of fragments of intron 1 of the human GCK gene.A. Activity of large fragments spanning most of intron 1. B Activates of subfragments of intronic fragment Int-3 (I-3). Schematics on the left indicate the relative positions of fragments of intron 1 inserted downstream of a luciferase reporter gene in the pGK-1049Luc reporter plasmid. See Fig. S1 for the locations of genomic fragments within the gene. Reporter gene activities of the constructs in human L-02 and HepG2 cells are shown on the right. Data are the Mean6SD of three independent experiments. Asterisk (*) indicates constructs that have significantly different activity than the21049 construct (P,0.05).
the liver. These observations suggest that sequences either further 59than27.5 kb or downstream of the liver-specific mRNA start site are required for liver-specific expression [7].
To address the question concerning what sequence might be necessary for liver-specific expression we choose to better understand the structure of glucokinase genes in diverse mammals. Understanding the conservation of genomic sequenc-es should allow us to determine whether sequencsequenc-es upstream or downstream of the liver-specific 1st exon contribute to liver-specific gene expression. We identified 19 complete glucokinase gene sequences from the 43 mammalian species with available genome sequences (from www.ensembl.org, Table 1). From these genomic sequences we found that all, except possibly the little brown bat, had identifiable beta-cell and liver-specific 1st exons (Tables 1 and S3) suggesting that tissue-specific promoters exist in most if not all mammals. The distance between the beta-cell and liver-specific 1st exons in the 20 genes is fairly large, and similar to the previously reported sizes, of about 30 kb, for the human and rodent genes [6–8] (Table S3). Intriguingly, when the genomic sequences were aligned (see Figs. 1 and S2) little sequence similarity is seen in the genomic sequences between the two tissue-specific 1st exons, in contrast to the remainder of the gene sequences where considerable similarity is observed between the genomic sequences encoding glucokinase from diverse placental mammals. A more careful examination of the genomic sequences demonstrated that most of the sequence between the two tissue-specific 1st exons is composed of repetitive DNA elements (Tables S3 and S4), and that these elements were likely inserted into the genomic sequences independently in the divergent orders of mammals. The discovery that most of the sequence between the tissue-specific exons is recently inserted repetitive DNA suggests that
any regulatory sequence in this region should be in the non-repetitive regions. Examination of the genomic sequence alignments indicates that only about 4 kb of the human genomic sequence 59 to the liver-specific exon is non-repetitive (Fig. 1). Since the 4 kb region was included in the previously tested transgenic mouse (which had 7.5 kb of liver-specific 59
flanking region) that did not express the reporter gene in the liver [7], suggests that the sequences necessary for liver-specific expression must be located 39 to the mRNA start site of the liver-specific glucokinase transcript.
Alignments of the glucokinase genomic sequences demonstrates that sequences downstream of the liver-specific 1stexon are similar in diverse mammals, except in the comparisons with the Tasmanian devil, a marsupial species that has had the most time to allow sequence divergence (Figs. 1 and S2). DNase I hypertensive sites have been mapped to locations both 59and 39
to the liver-specific 1stexon [7,21,22]. DNase I hypertensive sites are often associated with sequences that regulate gene expression, however, the 39 site has not been tested in previous analyses of liver-specific glucokinase gene expression [35,36]. The conserva-tion of the intronic sequences downstream of the liver-specific 1st exon and the presence of a DNase I hypersensitive site within this region suggests these sequences may play a role in the liver-specific expression of the glucokinase gene.
To test whether intron sequences downstream of the liver-specific 1st exons have a role in the expression of the glucokinase gene we generated reporter gene constructs containing liver-specific 59 flanking sequences with or without intron sequences (see Fig. S1). Our in vitro transfection experiments show that reporter gene plasmids that contain either 3815 or 1049 bases of liver-specific 59 flanking sequence generate lower levels of reporter gene expression if intron 1 Table 3.Potential transcription factor binding sites near the human glucokinase liver-specific 1stexon.
Position1 Transcription factor2
Promoter (2345 to2571)
2561 to2537 HNF4, hepatic nuclear factor-4
2520 to2496 HNF4, hepatic nuclear factor-4
2476 to2460 HFH, forkhead domain factor
2411 to2395 HNF-6, onecut, hepatic nuclear factor-6
2361 to2345 ChREBP, carbohydrate repose element binding protein
2360 to2334 CTCF, CCCTC-binding factor
Promoter (238 to2161)
2163 to2125 TFIID, transcription factor II D
2156 to2136 YY, yin-yang 1
2153 to2137 HFH, forkhead domain factor
2101 to279 PPAR_RXR, peroxisome proliferator-activated receptor retinoid X receptor
268 to244 PPAR_RXR, peroxisome proliferator-activated receptor retinoid X receptor Intron (1951 to 2111)
1969 to 1995 CTCF, CCCTC-binding factor
1981 to 1997 ChREBP, carbohydrate response factor binding protein
2012 to 2022 SMAD, Sma and Mad (Mothers against decapentaplegic)
2016 to 2034 STAT, Signal transducer and activator of transcription 2068 to 2090 PPARG, peroxisome proliferator-activated receptor gamma
1Location of the binding site relative to liver-specific mRNA start site.
sequences were included in the reporter constructs (Fig. 2). These results suggest that sequences in the intron downstream of the liver-specific 1stexon contribute to the downregulation of expression of the glucokinase gene. Hormones regulate the expression of the glucokinase gene [4,9], thus we tested the ability of insulin and fetal calf serum to modify expression of our reporter gene constructs. In previous studies, insulin failed to induce expression of the endogenous glucokinase gene, or introduced glucokinase promoter reporter genes in HepG2 cells [4,9], and with these cells we observed similar results (Fig. 2B). Fetal calf serum, however increased expression of our reporter gene constructs containing 59flanking, but not intron, sequences suggesting that a factor(s) present in serum induced expression (Fig. 2B). Similar results were seen with fetal calf serum using these constructs in L-02 cells (Fig. 2C). Fetal calf serum is a complex mixture and includes many factors such as growth factors and hormones that could induce gene expression. For example, estrogen has been found to regulate the rat glucokinase gene expression via sequences near the mRNA star site [37]. In contrast to HepG2, induction of reporter gene expression by insulin was observed in the normal liver cell line L-02, although this was only seen with some of the 59 flanking sequence-containing constructs (Figs. 2C and 3C). Constructs that contained additional 59 flanking sequence (e.g., pGK-3815Luc) or intron sequences (e.g., pGK-1049Intr1Luc) were not induced by insulin suggesting that sequences further 59 or within intron 1 may modulate the activity of insulin. This report, however, is the first to demonstrate that an introduced glucokinase promoter construct can be regulated by insulin in a liver cell line, the L-02 cell line [27], thus the use of this cell line should increase our ability to understand the factors responsible for insulin regulated liver-specific glucokinase gene expression.
To better characterize the sequences necessary for both expression of the reporter constructs in liver cells and it’s down regulation, deletions of the 59 flanking and intron regions were made. Differing results were observed with the HepG2 and L-02 liver cell lines for the deletions of 59 flanking sequence (Fig. 3A). HepG2 cells require at least 571 bases of 59 flanking sequence to generate significant reporter gene expression, while L-02 cells only needed 161 bases (Fig. 3A). As glucokinase reporter gene construct expression in L-02 cells is responsive to insulin (Figs. 2 and 3), and hepatic glucokinase gene expression is absolutely dependent on the presence of insulin [4,9], we suggest that the results derived from the L-02 cell line may be more representative of endogenous gene expression in the liver. The minimal sequence necessary for reporter gene expression in L-02 cells is similar to length (180 bases) of rat glucokinase liver-specific promoter required for expression in rat hepatocytes [36]. Insulin induced expression of reporter gene constructs only in the L-02 cells, however only the construct with 571 bases of 59 flanking sequence were significantly stimulated by insulin (Fig. 3C). Reporter constructs with 753 and 1049 bases of 59
flanking sequence, while having increased reporter gene expression in L-02 cells when exposed to insulin, did not have increases that were statistically significant (Fig. 3C). These observations may suggest that sequences upstream of2571 may modulate the function of the insulin responsive element, and thus multiple sequences may act to negatively regulate glucokinase gene expression. In addition to the negative regulatory sequences, these results suggest that sequences at two locations are involved in positively enhancing the expression of the glucokinase promoter, one between bases238 and2161 necessary for basal expression and one between 2345 and
2571 that can be regulated by insulin. Searches for potential transcription factor-binding sites between bases2345 and2571 identified a number of potential factors (Table 3) and these regions show conservation in sequence, and potential transcrip-tion factor binding sites, between diverse mammalian species (Fig. 1). Among the candidate sites are several that have been identified to have roles in the liver-specific expression of glucokinase including hepatic nuclear factors-4 (HNF-4) and -6 (HNF-6) [20,38,39]. A site that potentially interacts with forkhead factors, such as FKHR and Foxo1 [20,40] that also regulate glucokinase was also found (Table 3). In the proximal region, between bases238 and2161, in addition to a forkhead factor-binding site, potential binding sites for PPAR and RXR, factors that are important in hepatic lipid metabolism [41], were found (Table 3). In addition, the proximal sequence contains a binding site for the core transcription factor TFIID [42] (Table 3).
A 160-base-long sequence about 2000 bases downstream of the liver-specific transcription start site was found to repress expression driven by the 59flanking sequence of the glucokinase liver-specific 1st exon (Fig. 4). A conserved sequence was also found in the genomic sequences of diverse mammals, except the mouse (Fig. 1). Intron 1 sequences repressed activity of both the 1049 and 3815 base long glucokinase liver-specific 59flanking sequence, although it had its greatest effect on the most strongly expressed flanking sequence (Fig. 2). The large and short intron sequences had repressor activity in both HepG2 and L-02 cells, and a single sequence may explain the complete activity (Figs. 2 and 4). Within the 160-base-long minimal element several potential transcription factor-binding sites were identified (Table 3), with many of these sites showing conservation between diverse mammals. Among these are sites for ChREBP and PPARG, factors important in liver metabolism [16,43], sites for signaling proteins SMAD and STAT [44] and the insulator protein CTCF [45]. These sites give the potential that this region could integrate signals to regulate glucokinase gene expression.
Supporting Information
Figure S1 Genomic fragments used to test liver-specific glucokinase promoters. Schematic illustrations of genomic fragments amplified to test glucokinase promoters. The top line illustrates the genomic organization of the 59end of human liver-specific glucokinase gene region. Exons are shown as boxes, with coding region as a filled box and untranslated region as an open box. Intron and flanking sequence are indicates as a thin line. The relative sizes and locations of amplified fragments are shown (see Table S1 for primers used for their construction). 59 flanking fragments are labeled with the 59 base. Intron fragments are labeled I, with subfragments of I-3 labeled 1 a–e.
(TIF)
The percentage sequence identity (if above 50%) of the human, cow, horse, hyrax, and Tasmanian devil GCK genomic sequences to the mouse genomic sequence are shown for each species below the mouse genomic region schematic. Repetitive DNA elements, and sequence shown high GC content are also identified using the symbols shown in box at the lower right.
(TIF)
Figure S3 Characterization of the human L-02 normal liver cell line. Expression of genes involved in glucose metabolism in HepG2 and L-02 cell lines was assed by RT-PCR (primers listed in Table S2). Cells were tested under basal conditions or after stimulation by 100 mM insulin or 10% fetal calf serum for 20 hours. Beta-actin and GAPDH were used as controls.
(TIF)
Table S1 Primers used to generate human glucokinase reporter gene constructs.
(DOCX)
Table S2 Primers used for the RT-PCR analysis of gene expression in HepG2 and L-02 cell lines.
(DOCX)
Table S3 Sizes of introns (in bp) in mammalian glucokinase genes.
(DOCX)
Table S4 Number and amount of repetitive DNA elements located between the beta-cell and liver-specific exons of mammalian glucokinase gene.
(DOCX)
Author Contributions
Conceived and designed the experiments: YW TG SZ DMI HT. Performed the experiments: YW TG SZ. Analyzed the data: YW TG SZ DMI HT. Contributed reagents/materials/analysis tools: ZL YM HL XW RW WX DS LJ XL GN RS. Wrote the paper: YW TG SZ DMI HT.
References
1. Steck AK, Winter WE (2011) Cur Opin Endo Diabetes Obes 18: 252–258. 2. Osbak KK, Colclough K, Saint-Martin C, Beer NL, Bellanne´-Chantelot C, et
al. (2009) Hum Mutat 30: 1512–1526. 3. Agius L (2008) Biochem J 414: 1–18.
4. Iynedjian PB (2009) Cell Mol. Life Sci. 66, 27–42.
5. Postic C, Shiota M, Magnuson MA (2001) Recent Prog Horm Res 56: 195–217. 6. Tanizawa Y, Matsutani A, Chiu KC, Permutt MA (1992) Mol Endocrinol 6:
1070–1081.
7. Postic C, Niswender KD, Decaux JF, Parsa R, Shelton KD, et al. (1995) Genomics 29: 740–750.
8. Magnuson MA, Andreone TL, Printz RL, Koch S, Granner DK (1989) Proc Natl Acad Sci USA 86: 4838–4842.
9. Iynedjian PB (1993) Biochem J 293: 1–13.
10. Shelton KD, Franklin AJ, Khoor A, Beechem J, Magnuson MA (1992) Mol Cell Biol 12: 4578–4589.
11. Jetton TL, Liang Y, Pettepher CC, Zimmerman EC, Cox FG, et al. (1994) J Biol Chem 269: 3641–3654.
12. Niswender KD, Postic C, Jetton TL, Bennett BD, Piston DW, et al. (1997) J Biol Chem 272: 22564–22569.
13. Iynedjian PB, Jotterand D, Nouspikel T, Asfari M, Pilot PR (1989) J Biol Chem 264: 21824–21829.
14. Iynedjian PB, Roth RA, Fleischmann M, Gjinovci A (2000) Biochem J 351: 621–627.
15. Foretz M, Guichard C, Ferre´ P, Foufelle F (1999) Proc Natl Acad Sci USA 96: 12737–12742.
16. Kim SY, Kim HI, Kim TH, Im SS, Park SK, et al. (2004) J Biol Chem 279: 30823–30829.
17. Gregori C, Guillet-Deniau I, Girard J, Decaux JF, Pichard AL (2006) FEBS Lett 580: 410–414.
18. Hansmannel F. Mordier S, Iynedjian PB (2006) Biochem J 399: 275–283. 19. Matsumoto M, Pocai A, Rossetti L, Depinho RA, Accili D (2007) Cell Metab 6:
208–216.
20. Hirota K, Sakamaki J, Ishida J, Shimamoto Y, Nishihara S, et al. (2008) J Biol Chem 283: 32432–342441.
21. Bossard P, Parsa R, Decaux JF, Iynedjian P, Girard J (1993) Eur J Biochem 215: 883–892.
22. Parsa R, Decaux JF, Bossard P, Robey BR, Magnuson MA, et al. (1996) Eur J Biochem 236: 214–221.
23. Smit AFA, Hubley R, Green P (1996) RepeatMasker Open-3.0.,http://www. repeatmasker.org..
24. Schwartz S, Zhang Z, Frazer KA, Smit A, Riemer C, et al. (2000) Genome Res 10: 577–586.
25. Schwartz S, Elnitski L, Li M, Weirauch M, Riemer C, et al. (2003) Nucleic Acids Res 31: 3518–3524.
26. Knowles BB, Howe CC, Aden DP (1980) Science 209: 497–499. 27. Yeh HJ, Chu TH, Shen TW (1980) Acta Biol Exp Sinica 13: 361–364. 28. Santerre RF, Cook RA, Crisel RM, Sharp JD, Schmidt RJ, et al. (1981) Proc
Natl Acad Sci USA 78: 4339–4343.
29. Guo T, Wang W, Zhang H, Liu Y, Chen P, et al. (2011) PLoS ONE 6: e22387. 30. Tompkins WA, Watrach AM, Schmale JD, Schultz RM, Harris JA (1974) J Natl
Cancer Inst 52: 1101–1110.
31. Ureta T, Radojkovic´ J, Zepeda S, Guixe´ V (1981) Comp Biochem Physiol 70B: 225–236.
32. Sawka-Verhelle D, Tartare-Deckert S, Decaux JF, Girard J, Van Obberghen E (2000) Endocrinology 141: 1977–1988.
33. Hirota K, Daitoku H, Matsuzaki H, Araya N, Yamagata K, et al. (2003) J Biol Chem 278: 13056–13060.
34. Cha JY, Kim HI, Im SS, Li TZ, Ahn YH (2001) Exp Mol Med 33: 59–63. 35. Iynedjian PB, Marie S, Wang H, Gjinovci A, Nazaryan K (1996) J Biol Chem
271: 29113–29120.
36. Iynedjian PB (1998) Biochem J 333: 705–712.
37. ZhuLL, Liu Y, Cui AF, Sho D, Liang JC, et al. (2010) Am J Physiol 298: E1210– E1218.
38. Roth U, Jungermann K, Kietzmann T (2002) Biochem J 365: 223–228. 39. Lannoy VJ, Decaux JF, Pierreux CE, Lemaigre FP, Rousseau GG (2002)
Diabetologia 45: 1136–1141.
40. Hirota K, Daitoku H, Matsuzaki H, Araya N, Yamagata K, et al. (2003) J Biol Chem 278: 13056–13060.
41. Berrougui H, Khalil A (2012) Rejuvenation Res 12: 117–126.
42. D’Alessio JA, Ng R, Willenbring H, Tjian R (2011) Proc Natl Acad Sci USA 108: 3906–3911.