www.hydrol-earth-syst-sci.net/20/4881/2016/ doi:10.5194/hess-20-4881-2016
© Author(s) 2016. CC Attribution 3.0 License.
Sediment and nutrient budgets are inherently dynamic:
evidence from a long-term study of two subtropical reservoirs
Katherine R. O’Brien1, Tony R. Weber2, Catherine Leigh3,4,5, and Michele A. Burford3
1School of Chemical Engineering, The University of Queensland, St Lucia, Queensland 4072, Australia
2Integrated Catchment Assessment and Management Unit, ANU College of Medicine, Biology and Environment, Australian National University, Canberra, ACT 0200 Australia
3Australian Rivers Institute, Griffith University, Nathan, Queensland 4111, Australia
4The Griffith School of Environment, Griffith University, Nathan, Queensland 4111, Australia 5IRSTEA, UR-MALY, 5 rue de la Doua, CS70077 69626 Villeurbanne, CEDEX, France Correspondence to:Katherine R. O’Brien (k.obrien@uq.edu.au)
Received: 22 February 2016 – Published in Hydrol. Earth Syst. Sci. Discuss.: 15 April 2016 Revised: 20 September 2016 – Accepted: 1 November 2016 – Published: 13 December 2016
Abstract. Accurate reservoir budgets are important for un-derstanding regional fluxes of sediment and nutrients. Here we present a comprehensive budget of sediment (based on total suspended solids, TSS), total nitrogen (TN) and total phosphorus (TP) for two subtropical reservoirs on rivers with highly intermittent flow regimes. The budget is completed from July 1997 to June 2011 on the Somerset and Wiven-hoe reservoirs in southeast Queensland, Australia, using a combination of monitoring data and catchment model pre-dictions. A major flood in January 2011 accounted for more than half of the water entering and leaving both reservoirs in that year, and approximately 30 % of water delivered to and released from Wivenhoe over the 14-year study period. The flood accounted for an even larger proportion of total TSS and nutrient loads: in Wivenhoe more than one-third of TSS inputs and two-thirds of TSS outputs between 1997 and 2011 occurred during January 2011. During non-flood years, mean historical concentrations provided reasonable estimates of TSS and nutrient loads leaving the reservoirs. Calculating loads from historical mean TSS and TP concen-trations during January 2011, however, would have substan-tially underestimated outputs over the entire study period, by up to a factor of 10. The results have important implica-tions for sediment and nutrient budgets in catchments with highly episodic flow. First, quantifying inputs and outputs during major floods is essential for producing reliable long-term budgets. Second, sediment and nutrient budgets are dy-namic, not static. Characterizing uncertainty and variability
is therefore just as important for meaningful reservoir bud-gets as accurate quantification of loads.
1 Introduction
Over the past century, human activities have caused unprece-dented changes in water, sediment and nutrient movement between the atmosphere, lithosphere, hydrosphere and bio-sphere (Rockström et al., 2009). Modification of these natu-ral biogeochemical cycles on a range of scales has the poten-tial to alter fundamental Earth system processes and under-mine the ecosystem services on which human societies de-pend (Vörösmarty and Sahagian, 2000; Steffen et al., 2015). For example, artificial fixation of atmospheric nitrogen by humans exceeds fixation rates by all natural processes com-bined, contributing to a range of environmental problems including acidification, eutrophication and climate change (Gruber and Galloway, 2008; de Vries et al., 2013). The rate of application of phosphorus (P) to erodible soil is un-sustainable in many parts of the world (Carpenter and Ben-nett, 2011) and may threaten future food security (Cordell et al., 2009; Van Vuuren et al., 2010).
rates relative to free-flowing rivers (Sherman et al., 2001; Friedl and Wüest, 2002; Bosch and Allan, 2008; Kunz et al., 2011). Reservoirs are also more effective than lakes at re-taining both P and nitrogen (N) (Harrison et al., 2009; Kõiv et al., 2011). Globally, reservoirs are estimated to trap 26 % of the modern export of sediment to the coastal zone, and billions of tonnes of sediment have been impounded within reservoirs since the mid-20th century (Syvitski et al., 2005). While quantifying sediment and nutrient loads is essen-tial for closing local and regional nutrient budgets (Metson et al., 2012; Walling and Collins, 2008), estimating uncertainty in these loads is a major challenge (Walling and Collins, 2008; Parsons, 2012; Carpenter et al., 2015). Sediment and nutrient retention in reservoirs depends on many factors, in-cluding delivery (which is related to catchment size, land use and geology and river discharge volumes), sediment particle size, storage capacity and water release practices (Mahmood, 1987; Graf et al., 2010; Leigh et al., 2010; Issa et al., 2015). In tropical and subtropical river systems, large and episodic fluctuations in discharge due to seasonal and inter-decadal cycles in rainfall patterns mean that large sediment and nu-trient inputs can be delivered in relatively short time frames (Kennard et al., 2010; Lewis et al., 2013). For example, in one reservoir in subtropical Australia, net phosphorus reten-tion over a 6-year drought period was driven by moderate-flow events over just 12 days (Burford et al., 2012). Thus, reservoir budgets can vary across different time periods (Par-sons, 2012). The greater the climatic variability in the catch-ment, the longer the budget time frame required to capture representative data.
This study aims to complete budgets of sediment and nu-trients (N and P) for two large subtropical reservoirs. The catchments of both reservoirs are characterized by high-intensity episodic rainfall and runoff events; therefore, the budgets are conducted over more than a decade to capture a wide range of climatic conditions. More specifically, the study assesses the effect of variability in flow on both the magnitude and uncertainty in sediment and nutrient loads en-tering, leaving and retained within the reservoirs.
2 Materials and methods
Sediment and nutrient budgets were completed for the Som-erset and Wivenhoe reservoirs over 14 years from July 1997 to June 2011. For this study, sediment is defined as the mix-ture of inorganic and organic matter, measured by dry weight of filtered solids, i.e. total suspended solids (TSS). Inputs and outputs of water, TSS, total nitrogen (TN) and total phospho-rus (TP) were estimated using a combination of catchment model predictions and monitoring data, measured at inter-vals ranging from hourly to monthly. Output loads of TSS, TN and TP were estimated using four different methods to deal with missing data.
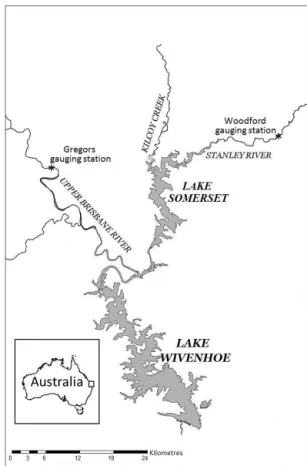
Figure 1.The Somerset and Wivenhoe reservoirs in subtropical
Australia. The major tributaries are the Stanley River and Upper Brisbane River (UBR), respectively. Flow gauging stations are indi-cated.
2.1 Study area
Somerset and Wivenhoe reservoirs are major drinking wa-ter and flood mitigation reservoirs in southeast Queensland, Australia (27◦7′S, 152◦33′E and 27◦24′S, 152◦36′E, re-spectively), linked by the Stanley River. The Stanley River was dammed to form the Somerset reservoir in 1959, and the Wivenhoe dam wall was constructed further down-stream below the confluence of the Stanley River and Up-per Brisbane River (UBR) in 1984 (Fig. 1). The catch-ment areas of the Somerset and Wivenhoe reservoirs are 1340 and 5680 km2, respectively. At full supply capacity, Somerset holds 0.380 km3 (380 000 ML), with a mean wa-ter depth of 9.3 m and a surface area of 42 km2. Wivenhoe holds 1.165 km3 (1 165 000 ML) with a mean water depth of 10.5 m, and surface area of 107 km2(Leigh et al., 2015). Both reservoirs are eutrophic and warm monomictic, with overturn in the austral autumn and stratification in the aus-tral summer, which results in anoxic bottom waters (Burford and O’Donohue, 2006). Water is released continuously from Wivenhoe reservoir for water treatment downstream.
reservoir primarily from the Stanley River. Controlled re-leases from the Somerset reservoir combine with inflows from the UBR and lateral inflows to supply the Wiven-hoe reservoir (Fig. 1). The Stanley River and UBR have highly unpredictable and intermittent flow regimes (Kennard et al., 2010), although major discharge events tend to occur in summer (the “wet season”). Therefore, “water years” were defined from July to June in all analyses to capture the entire austral summer wet season within each water year.
During the study period, there were three above-average flow events of note: in February 1999 (water year 1998), February 2008 (water year 2007) and January 2011 (water year 2010). From 9 to 16 January 2011, a large flood with extreme rainfall occurred within the Wivenhoe and Somer-set catchments (Seqwater, 2011). It was the second highest flood recorded in the lower Brisbane River over the past cen-tury (the highest was in 1974), and water from the Wiven-hoe catchment contributed to significant flood damage down-stream (van den Honert and McAneney, 2011). The Febru-ary 1999 and 2008 events were small by comparison (e.g. as indicated by rainfall volumes in Fig. 2; see also van den Honert and McAneney, 2011). Therefore, water year 2010 (July 2010–June 2011) is referred to hereafter as the “flood year” and all other water years during the study period are de-noted as “non-flood years”. The non-flood years (July 1997 to June 2010) comprised a range of hydrological conditions, including the 1999 and 2008 flow events and the 2001– 2009 drought (Dijk et al., 2013), which was characterized by low rainfall and low inflows to both reservoirs (Leigh et al., 2015).
2.2 Catchment inputs: flows, loads and uncertainty Daily flow and TSS, TN and TP loads from the catchments into the Somerset and Wivenhoe reservoirs were estimated using the eWater Source Catchments (SC) model (formerly called WaterCAST) (Weber et al., 2009). The model was parameterized for hydrology and stream routing using one stream gauge in the Somerset catchment, and four stream gauges in the Wivenhoe catchment. The model used global, land-use-based event-mean concentrations (EMCs) and dry weather concentrations (DWCs), estimated from water qual-ity information collected across the southeast Queensland re-gion, with a particular focus on those event monitoring sites that adequately characterized the pollutant export from land uses and soil types typical of the regions being modelled. Calibration and validation were undertaken using a combi-nation of manual and automated techniques.
The EMCs were derived from event monitoring and con-tinuous sampling within the catchments of interest (Thomson et al., 2013), and thus implicitly represent the range of sed-iment and nutrient generation processes present within the catchment. The EMCs are attributed to land uses rather than specific generation processes. This attribution is relatively consistent with the spatial characterization of sediment
gen-Figure 2.Annual rainfall (millimetre per water year) measured at
a rainfall station near the Wivenhoe and Somerset reservoirs (Bu-reau of Meteorology, bom.com.au). Horizontal line shows long-term mean rainfall.
eration within the catchment, as quite often the generation processes are strongly tied to the land management of partic-ular land activities (unpublished data). For channel erosion, denuded areas within the river reaches are aligned to land uses such as horticulture and grazing where land clearing activities have been conducted to the channel edge. Further improvements in the model would require better data repre-senting individual processes, which currently do not exist for many parts of the catchment studied.
Uncertainty in the SC model was estimated by comparing SC predictions with flow and loads measured at two gauging stations: Woodford Weir on the Stanley River and Gregors Creek on the UBR (Fig. 1). Flow volume recorded for the gauging stations spanned many orders of magnitude, making it difficult to distinguish between zero flow and missing data. Therefore, model predictions were only compared with non-zero recorded flows. When plotted against flows measured at the gauging stations, SC predictions in both the Stanley River and UBR were scattered around the 1:1 line on the log–log scale (Fig. S1 in Supplement). Variability between gauged and predicted water input was the highest at low flow, and the lowest when predictions and data were integrated to a yearly time step (Fig. S1). The adjustedR2for log-annual flow (SC) vs. log-annual flow (gauged) was 0.96 for the Stanley River and 0.95 for the UBR, and the 95 % confidence interval for the slope contained 1.0 for both rivers. Root mean square error of the difference between measured and predicted flows was 70 % of the mean annual flow, when averaged across the Stanley and UBR gauging stations for available data during the study period.
high-flow event, the concentrations of TSS, TN and TP were mea-sured by the local water authority, Seqwater, at the gauging stations. Water samples were automatically collected using a refrigerated autosampler triggered by the change in height of the depth gauge above a base-flow threshold. For TN and TP, whole samples were kept on ice until frozen in the lab-oratory. They were later analysed using the persulfate diges-tion method and run through an AutoAnalyzer (APHA, 1995; Burford and O’Donohue, 2006). For TSS samples, a known volume was filtered onto a pre-weighed and combusted glass fibre filter, then dried and reweighed (APHA, 1995).
Loads were determined using the linear-interpolation method, with at least 10 measurements per event, and sam-pling on both rising and falling limbs of the hydrographs (Olley et al., 2015). TSS, TN and TP loads predicted by SC were well correlated with the loads estimated from the event-sampling data collected for both gauging stations (Fig. S2). Total loads across all measured events differed from SC pre-dictions by 24 % for TSS, 45 % for TN and 26 % for TP (and 42 % for flow) when averaged across the two sites, verifying that the SC predictions were consistent with flows and loads in the major tributaries during high-flow events. However, this information did not provide a measure of uncertainty in annual predicted loads to the two reservoirs.
To estimate uncertainty in annual inputs, an empirical model was used to predict TN and TP loads at each gaug-ing station based on measured daily flow (Kerr, 2009; Bur-ford et al., 2012). The model was validated against the event loads (Fig. S2) and then compared with SC predictions at daily, monthly and annual time steps using gauged flow data (Fig. S1). Unfortunately, an empirical model was not avail-able for TSS.
During high-flow events, the empirical model predictions agreed with the SC predictions and the measured TN and TP event loads (Fig. S2). Daily, monthly and annual predic-tions of both TN and TP from the empirical model agreed with SC predictions (Fig. S1). Difference between the two models was the lowest for the Stanley River site (Woodford Weir), even though the empirical model was developed for the UBR. Variation between the models was the lowest when information was integrated to an annual time step (Fig. S1). Over the entire study period, the root mean square difference between the two models as a proportion of mean annual loads was 60 % for TN and 45 % for TP, when averaged across the Stanley and UBR gauging stations. Uncertainty could not be estimated for TSS, and flow was the only variable for which SC predictions could be directly compared with data. Uncer-tainty in loads is unlikely to be lower than uncerUncer-tainty in flow, which was estimated as 70 %, as outlined above. Therefore, we assumed an uncertainty of 70% in annual SC model pre-dictions of flow, TSS, TN and TP inputs to both reservoirs (Table S1 in Supplement).
2.3 Reservoir outputs
Loads of TSS, TN and TP exported from the reservoirs each month were calculated by multiplying concentrations ([TSS], [TN] and [TP]; in mg L−1) measured at the dam walls by the volumes of water released. The volume of monthly wa-ter released from each reservoir was dewa-termined by summing daily release values, except during the period 1 July 1997 to 30 June 2001 for the Wivenhoe reservoir, for which monthly release data were directly available.
2.3.1 Data sources: [TSS], [TN] and [TP] at dam walls Concentrations of TSS, TN and TP in water released from the reservoirs were determined from routine monthly monitoring and sub-daily turbidity profiles collected near the dam walls. Monthly monitoring data collected by Seqwater were available for surface and bottom concentrations of TSS, TN, TP, ammonium (NH4), nitrite plus nitrate (NO2+NO3) and dissolved inorganic P (DIP) at the dam wall of each reser-voir from July 1997 to June 2011. Surface samples were taken using a 3 m depth-integrated sampler and bottom ples were taken using a van Dorn sampler. TN and TP sam-ples were kept on ice until frozen in the laboratory. They were later analysed using the persulfate digestion method and run through an AutoAnalyzer (APHA, 1995; Burford and O’Donohue, 2006). For dissolved nutrients, samples were filtered through 0.45 µm membrane filters in situ, and kept on ice until frozen in the laboratory. Samples were analysed using standard colorimetric methods with an AutoAnalyzer (APHA, 1995; Burford and O’Donohue, 2006). For TSS samples, a known volume was filtered onto a pre-weighed and combusted glass fibre filter, then dried and reweighed (APHA, 1995).
Depth profiles of turbidity (NTU, Nephelometric Turbidity Unit) were also measured at the dam wall in each reservoir, recorded by a calibrated nephelometer deployed on a fixed buoy. Turbidity profiles at 1 m intervals through the water column were available approximately every hour for water years 2009–2010 in the Somerset reservoir and water years 2008–2010 in the Wivenhoe reservoir.
2.3.2 Estimating sediment and nutrient loads from turbidity profiles
Monthly monitoring data were available for the entire 14-year study period, but data were missing for December 2010 and January 2011, when release volumes and turbidity were both unusually high (Grinham et al., 2012). Turbidity profiles were available for December 2010 and January 2011, but were only available for a short portion of the entire study pe-riod (2 water years in Somerset and 3 water years in Wiven-hoe). Hence, the data sets needed to be combined in some way to complete a long-term budget for the reservoirs.
The turbidity profile data could only be used to estimate loads released from the reservoirs if a meaningful relation-ship could be established between turbidity and sediment and nutrient concentrations ([TSS], [TP], and [TN]). It is quite common to develop local relationships between [TSS] and turbidity. Since P is strongly associated with sediment parti-cles, a relationship between turbidity and [TP] might also be expected. Because dissolved compounds typically make up a large component of [TN], the relationship with turbidity was not expected to be as strong for [TN] as for [TSS] and [TP].
Routine monthly surface and bottom measurements of [TSS], [TN] and [TP] were correlated with mean daily sur-face and bottom turbidity measured on the same day, where data from both sources were available. Daily surface and bot-tom turbidity were determined from readings in the top 3 m and the bottom 2 m, respectively, averaged across each day. Since the objective was to determine concentrations during turbid floodwaters when routine monitoring was unavailable, [TN] and [TP] were only used where NTU>15. Turbidity data were cleaned prior to analysis: spikes associated with calibration were removed by inspection. Where gaps in the record were no greater than 2 days, missing data were re-placed with the average turbidity of the preceding and subse-quent day.
Linear regression in MATLAB was used to determine the correlation coefficients for the relationship described by
[y] =a+bNTU, (1)
where [y] is [TSS], [TN] or [TP], anda andb are the cor-responding intercept and slope (Table S2). Equation (1) was then used to calculate daily estimates for [TSS], [TN] and [TP] from surface and bottom mean daily turbidity.
2.3.3 Reservoir outputs calculated from multiple data sources
There were a number of ways in which the monthly moni-toring and turbidity profile data could be combined to calcu-late sediment and nutrient outputs from Somerset and Wiven-hoe reservoirs over the study period. We compared four such methods of estimating output loads:
– Method 1: mean historical concentration, where surface and bottom concentrations ([TSS], [TN] and [TP]) at
dam wall sites in each reservoir were estimated from the mean concentration of monthly monitoring data 1997– 2011 (Table S3). This had the advantage of a consis-tent data source for the full time frame of the study, and was justified because variation in release volume is or-ders of magnitude above variation in [TSS], [TN] and [TP] at the dam wall. However, this method may un-derestimate the output loads of TSS, TN and TP during very large floods, when water leaving the reservoir has unusually high TSS and nutrient concentrations (e.g. Lewis et al., 2013). Note that mean [TSS] was deter-mined from log-transformed data, due to a small num-ber of very high values.
– Method 2: monthly measured concentration, with miss-ing data replaced by mean historical concentration (as defined in method 1). This makes better use of the in-formation available, but will not provide much advan-tage over method 1 in dealing with the flood year, since monitoring data were unavailable for December 2010 and January 2011, when large volumes of water were released and turbidity at the dam wall was very high (Grinham et al., 2012).
– Method 3: monthly measured concentration, with miss-ing data replaced by information from turbidity profiles where available, and by mean historical concentration otherwise. This enables better estimation of [TSS], [TN] and [TP] during January 2011, and does not rely on tur-bidity correlations where direct measurements of those concentrations are available.
– Method 4: concentration calculated from turbidity pro-files, with missing data replaced by monthly measured concentrations where available, and by mean histori-cal concentration otherwise. This makes best use of the high-resolution turbidity profile information, but relies strongly on the correlation between turbidity and [TSS], [TN] and [TP].
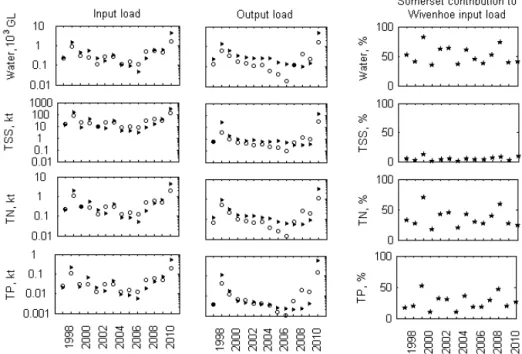
Figure 3.Annual input and output loads of water (103GL), TSS and nutrients (kt) for the Somerset (o) and Wivenhoe (◮) reservoirs for
water years 1997–2010, and the percentage contribution of Somerset to Wivenhoe input loads.
2.4 Reservoir budgets: inter-annual comparisons and propagation of error
Annual accumulation of TSS, TN and TP in each reservoir was calculated as the sum of catchment inputs (SC model predications) and loads from the upstream reservoir (in the case of Wivenhoe), minus reservoir outputs. Where data were combined (e.g. Wivenhoe input loads were the sum of SC model predictions and Somerset output loads), uncertainty was determined using the law of propagation of errors, as-suming that errors were independent (Ku, 1966). Thus, errors in total loads over a given time frame (1Pni=1Xi) were cal-culated from the square root of the sum of squares of errors in individual loads (1Xi):
1Xn i=1Xi
=
r Xn
i=11X 2 i
. (2)
Relative error in mean load was assumed to equal relative error in total load. Annual retention of TSS, TN and TP for each reservoir was compared against hydraulic retention time (reservoir volume at full supply divided by annual inflow vol-ume). Trapping efficiency (TE) was calculated from input and output loads as follows:
TE=Input−Output
Input . (3)
In accordance with the law of propagation of errors, again assuming errors in input and output loads are independent (Ku, 1966), the uncertainty in trapping efficiency1TE was calculated from the relative errors in input and output loads
(1Input/Input and1Output/Output respectively) as follows:
1TE=(1−TE) s
1Input Input
2 +
1Output Output
2
. (4)
3 Results
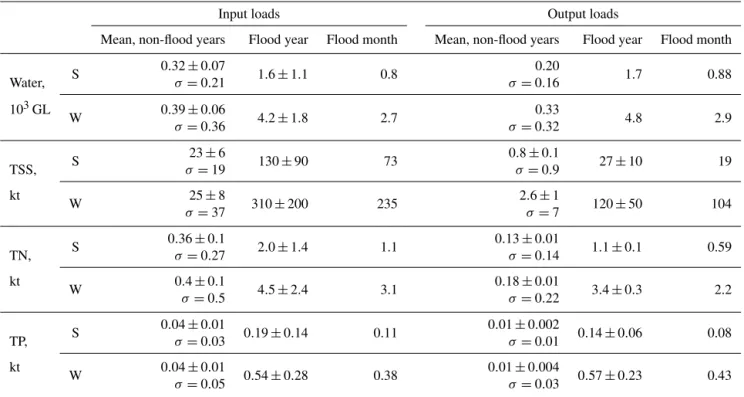
The flood year (water year 2010: July 2010–June 2011) dom-inated inputs and outputs of water, sediment and nutrients for both reservoirs. Inputs of water, TSS, TN and TP to Som-erset and Wivenhoe were 5–10 times higher in 2010 than on average during the 13 non-flood years (Fig. 3, Table 1). Reservoir outputs were approximately 10–50 times higher than during the non-flood years (Fig. 3, Table 1). The biggest effect of the flood year was on output of TSS, which was 30–50 times higher in the flood year than on average during the non-flood years. Wivenhoe inflows were particularly im-pacted: whereas the input of water, sediment and nutrient to both reservoirs was very similar during non-flood years, in-puts to Wivenhoe were more than double those to Somerset during the flood year (Table 1).
esti-Table 1.Input and output loads of water, TSS, TN and TP for the Somerset and Wivenhoe reservoirs from June 1997 to July 2011 ±
uncertainty;σis the standard deviation of annual values over non-flood years. Water years are defined from July to June. Water year 2010 is
the flood year, other years are non-flood years. January 2011 is the flood month. S: Somerset reservoir, W: Wivenhoe reservoir.
Input loads Output loads
Mean, non-flood years Flood year Flood month Mean, non-flood years Flood year Flood month
S 0.32±0.07 1.6±1.1 0.8 0.20 1.7 0.88
Water, σ=0.21 σ=0.16
103GL W 0.39±0.06 4
.2±1.8 2.7 0.33 4.8 2.9
σ=0.36 σ=0.32
S 23±6 130±90 73 0.8±0.1 27±10 19
TSS, σ=19 σ=0.9
kt W 25±8
310±200 235 2.6±1 120±50 104
σ=37 σ=7
S 0.36±0.1 2.0±1.4 1.1 0.13±0.01 1.1±0.1 0.59
TN, σ=0.27 σ=0.14
kt
W 0.4±0.1 4.5±2.4 3.1 0.18±0.01 3.4±0.3 2.2
σ=0.5 σ=0.22
S 0.04±0.01 0.19±0.14 0.11 0.01±0.002 0.14±0.06 0.08
TP, σ=0.03 σ=0.01
kt W 0.04±0.01 0
.54±0.28 0.38 0.01±0.004 0.57±0.23 0.43
σ=0.05 σ=0.03
mated from the turbidity profiler at the dam walls, the loads of TSS and nutrient outputs from Somerset during January 2011 accounted for ca. 50–70 % of output loads during water year 2010, and ca. 20–50 % of output loads over the study period (Fig. 4). The flood month had the greatest impact on Wivenhoe: TSS and nutrients exported in January 2011 ac-counted for at least 65 % of export loads during the 2010 water year, and ca. 40–70 % of export loads over the entire 14-year study period (Fig. 4).
Inter-annual variability in water-release volumes from both reservoirs was much higher than variability in the [TSS], [TN] and [TP] at the dam wall during non-flood years (Figs. 3, 5), implying that variation in reservoir out-put was driven by variation in the volume of water released rather than the concentrations of sediments and nutrients in the water. As a result, there was little difference between output loads estimated from historical mean concentrations (method 1) and from monthly monitoring (method 2) during non-flood years (Fig. 6). The only non-flood year for which turbidity data were available for both reservoirs was 2009, and there was little difference between loads calculated us-ing mean concentrations, monthly monitorus-ing data or [TSS], [TN] and [TP] calculated from the turbidity profiler at the dam wall for that year (methods 1–4, Fig. 6).
The combination of extremely high releases and unusu-ally high turbidity, however, meant long-term historical mean concentrations did not provide a good estimate of reservoir
Figure 4.Summary of January 2011 input and output loads, as
per-centage of total loads in and out during the flood year, and across the entire study period.
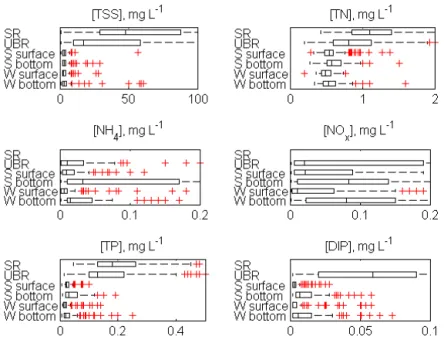
Figure 5.Concentration of total and dissolved inorganic nutrients measured at the dam walls of the Somerset and Wivenhoe reservoirs June
1997–July 2011, and at the gauging stations for Stanley River (SR) and Upper Brisbane River (UBR) July 2002–June 2009.
Figure 6.Comparison of four methods for calculating mean annual
TSS, TN and TP output loads (kt y−1), using [TSS], [TN] and [TP]
from 1.◮mean historical concentration of monthly monitoring data
water years 1997–2010; 2.∗monthly monitoring, with missing data
replaced by mean historical concentration; 3.monthly
monitor-ing, with missing data replaced by concentrations estimated from turbidity profiles, and mean historical concentrations where turbid-ity data are unavailable; 4.•turbidity profiles, with missing data
replaced by monthly monitoring, and mean historical concentration otherwise.
been underestimated by approximately 1 order of magnitude (Figs. 6, 7, Table S4). Additionally, TSS output loads dur-ing the entire 14-year study period would have been under-estimated, by more than a factor of 2 in Somerset and more than a factor 5 in Wivenhoe, had historical mean concentra-tions been used to estimate the outputs during January 2011. However, mean historical concentrations provided a
reason-able estimate for TN loads during the flood month and flood year, because TN concentrations were less affected by the flood than TSS or TP (Fig. 7, Table S4).
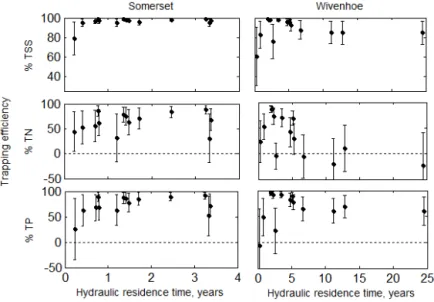
TSS-trapping efficiency was very high during the non-flood period, regardless of the hydraulic residence time (Fig. 8). While the majority of TN and TP delivered to both reservoirs over the entire non-flood period was retained (Ta-bles 1, 2), Wivenhoe was a net exporter of TN in many water years (Fig. 8) due to high concentrations of dissolved inor-ganic N accumulating in the bottom waters of the reservoir (Fig. 5). In water year 2010, the net retention or export of wa-ter, TSS, TN and TP was less than the bounds of uncertainty (Table 2), with the exception of retention of TSS in Somerset. As noted earlier, both the flood year and flood month had greater effects on Wivenhoe than Somerset. Wivenhoe has 3 times the full supply volume of Somerset, and 4 times the catchment area. Despite the difference in catchment area, mean inputs to Wivenhoe and Somerset were very similar during the non-flood period (hence the hydraulic retention time was typically shorter for Somerset, as shown in Fig. 8). However, during the flood year, inputs to Wivenhoe were double or triple those to Somerset (Table 1, Fig. 3). Wivenhoe receives water from two sources: controlled releases from Somerset and episodic inputs from the catchment, which are dominated by flows from the UBR. Catchment flows account for about half (50–60 %) of water inflows and the majority of TSS and nutrient inputs in both flood and non-flood years (Fig. 3).
Figure 7.[TSS], [TN] and [TP] (in mg L−1) at dam outlets measured during monthly monitoring (round symbols), calculated from the daily
measured turbidity profile (solid lines) and mean historical concentrations (broken lines). Surface concentrations are denoted by open circles and thin lines, bottom readings are closed circles and heavy lines. Note that TSS mean is from log-transformed data.
Table 2.Retention of water, TSS, TN and TP in Somerset and Wivenhoe reservoirs from June 1997 to July 2011. Water year 2010 is the
flood year. S: Somerset reservoir, W: Wivenhoe reservoir.
Retention Trapping efficiency=retention/input loads
Entire study period Flood year Entire study period Flood year
Water S 1.44±1.46×10³GL −0.14±1×10³GL 25±19 % −9±76 % W 0.21±1.91×10³GL −0.56±2×10³GL 2±20 % −13±47 %
TSS WS 400480±120 kt 100±90 kt 92±3 % 79±60 %
±230 kt 190±200 kt 76±12 % 61±30 %
TN WS 43.8±1.8 kt 0.9±1.4 kt 57±12 % 44±39 %
.0±2.6 kt 1.1±2.4 kt 41±16 % 24±41 %
TP WS 00.40±0.19 kt 0.05±0.1 kt 60±14 % 26±60 %
.36±0.39 kt −0.03±0.36 kt 33±28 % −5±69 %
between the reservoirs and the river inputs (Fig. S3). DIP (dissolved inorganic phosphorus) concentrations were higher in the UBR than in either of the reservoirs, while dissolved inorganic N (DIN) concentrations where higher in the bot-tom waters of the reservoirs than in either the UBR or surface waters of the reservoirs (Fig. 5). As a result, DIN:DIP and TN:TP ratios and the proportion of TN in readily bioavail-able form (DIN) were all higher in the bottom of the reser-voirs than in the rivers (Fig. S3). In all cases, a higher propor-tion of P than N was available in dissolved inorganic form, and DIP:TP was higher in the UBR than in the reservoirs.
4 Discussion
4.1 Flood impacts on reservoir budgets: implications for monitoring and management
between flow and TSS. Thus, the TSS inputs to Wivenhoe calculated by Grinham et al. (2012) using the event-mean and flow correlation methods are 1 and 2 orders of magni-tude, respectively, above our estimate of 0.2 Mt (Table 1). Event-mean concentrations do not account for the shape of the flood peak, and there is an order of magnitude difference between the loads estimated from the event-mean concen-tration method and the flow–load correlations. This demon-strates the difficulty not only in determining loads for reser-voir budgets but also in finding meaningful estimates of un-certainty.
Our uncertainty analysis was as thorough as possible given the data available, but our estimate of 70 % confidence in SC model predictions may not be valid for major floods. While the predictions of TSS loads generated by the SC model agreed well with measured loads in flow events at gauging stations on both the Stanley River and UBR, the January 2011 event was so large in magnitude that it was outside the calibration range of the SC model and the rating curves at the gauging stations. Refining the estimates of input and out-put loads during January 2011 is the key to both reducing and better quantifying uncertainty in long-term sediment and nutrient budgets for the reservoirs.
Reliable reservoir budgets require reliable data. During non-flood years, mean historical concentrations provided reasonable estimates of TSS and nutrient loads leaving the reservoirs. However, calculating loads from historical mean TSS and TP concentrations during January 2011 would have underestimated outputs over the entire study period by a fac-tor of 2–7 (Fig. 6, Table S4). Since extreme flow events gen-erate both the highest inputs and outputs of TSS and nu-trients, and the highest uncertainty in loads, more intensive monitoring during high-flow events is required to increase confidence in these long-term reservoir budgets. Reducing the frequency of routine monitoring and using these savings to fund measurements during extreme events may therefore be a cost-effective way to reduce uncertainty in reservoir budgets.
The hydrological regimes of both the Somerset and Wivenhoe reservoirs are typical of the unpredictable and in-termittent flow regimes found in rivers on the eastern coastal fringe of Australia (Kennard et al., 2010). Hence, our find-ings will be particularly relevant in tropical and subtropical systems, where intra- and inter-annual variability are partic-ularly high (Lewis et al., 2013). Because major floods play such a dominant role in the sediment and nutrient budgets of reservoirs with highly variable flow regimes, sustainable management of soil and nutrient resources will mean ad-dressing sediment erosion and nutrient inputs during major floods. Land use change is the key factor responsible for changes in sediment and nutrient delivery to downstream wa-ter bodies throughout Australian catchments and no doubt in similarly modified landscapes beyond (Harris, 2001; Bart-ley et al., 2012; Powers et al., 2015). In the subtropical catchments of southeast Queensland reservoirs, for example,
river channel erosion is the main source of sediment inputs, and restoring riparian vegetation is the main mechanism by which these loads can be reduced (Wallbrink, 2004; Leigh et al., 2013; Olley et al., 2015).
4.2 Uncertainty and variability in reservoir budgets While catchment and reservoir budgets can be very useful, constructing accurate budgets is difficult due to limited avail-ability of data, and the challenges in reconciling data col-lected on different spatial and temporal scales, and over dif-ferent time periods. Given these issues, Parsons (2012) iden-tified three criteria for useful catchment budgets: (1) an ex-plicit statement of the time frame over which it is valid, (2) quantities determined from the difference between mea-sured loads should be treated with caution, and (3) uncer-tainty should be specified on all values. This study enables us to refine and update these principles.
Our results demonstrate that the time frame affects the un-certainty in budget estimates in two ways. First, if there are no systematic errors in budget loads, relative error in total loads will decline as duration of the study increases, as can be seen from Eq. (2). This explains why relative uncertainty in mean loads over the non-flood years and retention over the entire study period are much lower than uncertainty dur-ing the flood year (Table 2). Second, budgets conducted over longer time frames are more likely to capture a realistic rep-resentation of climatic conditions, particularly in tropical and subtropical systems where variation in flow can be extremely high (Kennard et al., 2010; Burford et al., 2012; Lewis et al., 2013). Variation in input and output loads was very high even in the 13 non-flood years (Fig. 3); the standard devia-tion of input and output loads was typically similar or equal to the mean loads for both reservoirs (Table 1). In systems such as our study sites, where flow is highly episodic, a static budget of water, sediment or nutrient loads will have limited value, and budgets are best presented as time series.
We therefore we propose that Parsons’ three principles of catchment budgets can be refined to two principles: (1) bud-gets should be presented as time series rather than static quantities to clearly display temporal variability and (2) un-certainty should be quantified for all budget terms, and ac-counted for in any interpretation of results.
4.3 Sediment and nutrient trapping
Correct propagation of uncertainty also affects interpretation of reservoir budgets. Uncertainty is higher over shorter time periods, and thus confidence in budget values is lower for the flood year than for the whole study period (Tables 1, 2). Net retention of TSS, TN and TP occurred over the 14-year study period in both reservoirs, except for TP in Wivenhoe, where uncertainty was higher than the difference between input and output loads. The flood year dominated the retention of TSS, TN and TP in both reservoirs (e.g. 25 and 40 % of TSS re-tained in Somerset and Wivenhoe were captured during the flood year); however, the higher relative uncertainty in the values determined for this shorter time frame means that re-tention of water, sediment and nutrients in both reservoirs in the flood year was only significantly different to zero for TSS in Somerset (Table 2).
Uncertainty in trapping efficiency (retention divided by input) is lower than uncertainty in retention, as outlined in Sect. 2.4. Thus, while retention was not significant for most loads during the flood period, trapping efficiency was quan-tifiable for all sediment and nutrients across the study period, and for TSS in both reservoirs and TN in Somerset during the flood year (Table 2). Together, these findings engender greater confidence in the proportion of sediment and nutri-ents retained by the reservoirs (i.e. trapping efficiency) than in the mass retained, and in budget terms calculated for multi-year periods. For a fuller assessment of trapping efficiency in reservoirs with variable flow, such as Wivenhoe and Somer-set, hydraulic retention should be calculated on shorter (i.e. monthly) timescales, and particle size distribution should be considered, as outlined in Lewis et al. (2013).
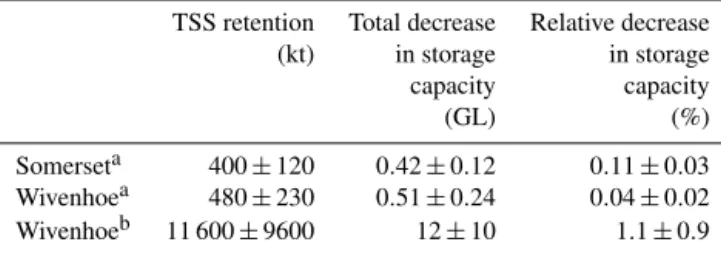
Retention of sediments in reservoirs can represent a loss of terrestrial productivity, and reduce the volume available for water supply and flood mitigation. To determine volume occupied by sediment retained in Somerset and Wivenhoe over our study period, we divided the mass of sediment re-tained (Table 2) by an estimated sediment bulk density of 0.95 g cm−3, using the appropriate unit conversions. The sed-iment bulk density used here represented an average of the range reported by Avnimelech et al. (2001). For Wivenhoe, we used TSS inputs from two sources for January 2011: (1) TSS inputs from this study (Table 1) and (2) mean TSS input estimated by Grinham et al. (2012): 11.4±9.6 Mt. In the most extreme case (i.e. the highest estimates of sediment inputs during January 2011), Wivenhoe storage volume is es-timated to decline by only 1 % over the 14-year study pe-riod (Table 3). Using the input loads calculated in this study,
Table 3.TSS retention and estimated decline in storage capacity for
Somerset and Wivenhoe reservoirs from June 1997 to July 2011, assuming a sediment bulk density of 0.95 g cm−3.
TSS retention Total decrease Relative decrease
(kt) in storage in storage
capacity capacity
(GL) (%)
Somerseta 400±120 0.42±0.12 0.11±0.03
Wivenhoea 480±230 0.51±0.24 0.04±0.02
Wivenhoeb 11 600±9600 12±10 1.1±0.9
aCalculated from information in Table 2;binput of TSS in water year 2010 based on
January 2011 TSS loads estimated by Grinham et al. (2012).
decline in storage volume is estimated as only 0.04–1.1 % for Wivenhoe over the 14-year study period (Table 3), i.e. 0.003–0.1 % per year. Average annual decline in storage vol-ume is 1–2 orders of magnitude lower in Wivenhoe com-pared to Mosul Dam, Iraq, where reservoir volume reduced by more than 10 % due to siltation between 1986 and 2011, i.e. 0.4 % per year on average (Issa et al., 2015). While trap-ping efficiency of Wivenhoe is slightly less than that esti-mated for Mosul Dam, the large difference in siltation be-tween these two reservoirs is due primarily to the difference in sediment loads. Mosul Dam has approximately 10 times the storage volume of Wivenhoe, but sediment loads entering Mosul Dam are of the order of 100–1000 higher than those entering Wivenhoe (Issa et al., 2015).
While the relative siltation rates in both Somerset and Wivenhoe may seem low (Table 3), the corresponding loss in water supply volume is regionally significant. We estimated that the decline in storage capacity over the study period was approximately 0.4 GL for Somerset loss and 0.5–12 GL for Wivenhoe (Table 3). In all, 2 of the 15 water supply reser-voirs in the region have capacity of less than 10 GL (Leigh et al., 2010). Hence, the loss of water storage volume in Wivenhoe over the 14-year study period could be equivalent to the closure of one of the smaller reservoirs. Somerset and Wivenhoe supply water to southeast Queensland, a region of rapid population growth, which has recently experienced ma-jor drought, and where alternative water sources have much higher greenhouse gas intensity than water supplied from ex-isting reservoirs (e.g. Hall et al., 2011). Therefore, any eco-nomic assessment of methods to reduce the catchment sedi-ment load in this region should account for costs associated with reservoir siltation and associated loss of water supply volume. Direct measurement of reservoir volume is required for more accurate estimates of storage loss due to siltation.
Figure 8.Percentage of annual TSS, TN and TP loads retained in the Somerset and Wivenhoe reservoirs compared to hydraulic residence
time (years). Dashed line indicates zero trapping: the boundary between net positive import and export.
reflects sediment dynamics, which is strongly controlled by the physical processes of advection and settling. TP reten-tion was lower and more variable than TSS retenreten-tion in ei-ther reservoir, and increased with hydraulic residence time (Fig. 8), similar to the findings of a long-term study of an arid lake system in Australia (Cook et al., 2010). P retention has been demonstrated in reservoirs throughout the world (Josette et al., 1999; Bosch and Allan, 2008). However TP re-tention was more variable than TSS rere-tention because P can be transformed via chemical and biological processes into a range of organic and inorganic forms. TP is associated with the finer fractions of TSS, which are less likely to settle and hence more likely to be transported through the reservoir dur-ing periods of short retention time (Kerr et al., 2011; Lewis et al., 2013), increasing the proportion of P likely to be trans-ported through the reservoir during periods of overflow.
Interpreting retention of N is more complicated than either TSS or TP. Whereas both nutrients and sediments can be de-posited from the atmosphere and buried in sediments, N can also be exported via denitrification and imported through N fixation by cyanobacteria. These processes are not included in the budget; thus, uncertainty in TN loads and retention will be underestimated. N is typically retained in reservoirs glob-ally (Harrison et al., 2009), and was consistently retained in Somerset throughout the study period. However, Wivenhoe was frequently a net exporter of TN (Fig. 8), typically during drought years when releases for water supply were less than reservoir inflows (Fig. 3).
The impact of reservoirs on downstream aquatic ecosys-tems depends of the form of nutrients released as well as the total loads (Kunz et al., 2011). Overall, TN is retained by both reservoirs over the study period (Table 2). However, the [DIN] leaving the bottom of both reservoirs was
typi-cally higher than the concentration of DIN measured in the UBR during events (Fig. 5), probably due to anoxic condi-tions in reservoir bottom waters (Burford and O’Donohue, 2006). Ratios of total and dissolved inorganic N:P were sub-stantially higher in both reservoirs than in the UBR (Fig. S3). Therefore, the impacts of reservoirs on downstream nutri-ent conditions will depend on the timing and magnitude of sediment and nutrients loads into the reservoirs, trapping ef-ficiency and transformation processes within the reservoirs themselves.
5 Conclusions
6 Data availability
Data supporting the conclusions will be submitted to an on-line data repository once this manuscript is accepted for pub-lication.
The Supplement related to this article is available online at doi:10.5194/hess-20-4881-2016-supplement.
Acknowledgements. We thank Andrew Watkinson, Kate Smolders
and the staff at Seqwater for the long-term reservoir data, Badin Gibbes and Alistair Grinham for useful discussions, Stephen Faggotter for the map and Phil Keymer for data checking. This project was funded by Seqwater and an ARC Linkage project LP0776375 “Sources of phosphorus promoting cyanobacteria in subtropical reservoirs”. Michele A. Burford has a long-term re-search collaboration with Seqwater. We also thank two anonymous reviewers for their comments on the manuscript.
Edited by: M. Werner
Reviewed by: two anonymous referees
References
APHA: American Public Health Association: Standard methods for the examination of water and wastewater, Washington, DC, 1995. Avnimelech, Y., Ritvo, G., Meijer, L. E., and Kochba, M.: Wa-ter content, organic carbon and dry bulk density in flooded sediments, Aquacult. Eng., 25, 25–33, doi:10.1016/S0144-8609(01)00068-1, 2001.
Bartley, R., Speirs, W. J., Ellis, T. W., and Waters, D. K.: A review of sediment and nutrient concentration data from Australia for use in catchment water quality models, Mar. Pollut. Bull., 65, 101–116, doi:10.1016/j.marpolbul.2011.08.009, 2012.
Bosch, N. and Allan, J.: The influence of impoundments on nutrient budgets in two catchments of Southeastern Michigan, Biogeo-chemistry, 87, 325–338, doi:10.1007/s10533-008-9187-6, 2008. Burford, M. A. and O’Donohue, M. J.: A comparison of phyto-plankton community assemblages in artificially and naturally mixed subtropical water reservoirs, Freshwater Biol., 51, 973– 982, doi:10.1111/j.1365-2427.2006.01536.x, 2006.
Burford, M. A., Green, S. A., Cook, A. J., Johnson, S. A., Kerr, J. G., and O’Brien, K. R.: Sources and fate of nutrients in a sub-tropical reservoir, Aquat. Sci., 74, 179–190, doi:10.1007/s00027-011-0209-4, 2012.
Carpenter, S. R. and Bennett, E. M.: Reconsideration of the plan-etary boundary for phosphorus, Environ. Res. Lett., 6, 014009, doi:10.1088/1748-9326/6/1/014009, 2011.
Carpenter, S. R., Booth, E. G., Kucharik, C. J., and Lathrop, R. C.: Extreme daily loads: role in annual phosphorus input to a north temperate lake, Aquat. Sci., 77, 71–79, doi:10.1007/s00027-014-0364-5, 2015.
Cook, P. L. M., Aldridge, K., Lamontagne, S., and Brookes, J. D.: Retention of nitrogen, phosphorus and silicon in a large
semi-arid riverine lake system, Biogeochemistry, 99, 49–63, doi:10.1007/s10533-009-9389-6, 2010.
Cordell, D., Drangert, J.-O., and White, S.: The story of phospho-rus: Global food security and food for thought, Global Envi-ron. Chang., 19, 292–305, doi:10.1016/j.gloenvcha.2008.10.009, 2009.
de Vries, W., Kros, J., Kroeze, C., and Seitzinger, S. P.: As-sessing planetary and regional nitrogen boundaries related to food security and adverse environmental impacts, Cur-rent Opinion in Environmental Sustainability, 5, 392–402, doi:10.1016/j.cosust.2013.07.004, 2013.
Dijk, A. I., Beck, H. E., Crosbie, R. S., Jeu, R. A., Liu, Y. Y., Podger, G. M., Timbal, B., and Viney, N. R.: The Millen-nium Drought in southeast Australia (2001–2009): natural and human causes and implications for water resources, ecosys-tems, economy, and society, Water Resour. Res., 49, 1040–1057, doi:10.1002/wrcr.20123, 2013.
Döll, P. and Schmied, H. M.: How is the impact of climate change on river flow regimes related to the impact on mean annual runoff? A global-scale analysis, Environ. Res. Lett., 7, 14–37, 2012.
Friedl, G. and Wüest, A.: Disrupting biogeochemical cy-cles – consequences of damming, Aquat. Sci., 64, 55–65, doi:10.1007/s00027-002-8054-0, 2002.
Graf, W. L., Wohl, E., Sinha, T., and Sabo, J. L.: Sedimentation and sustainability of western American reservoirs, Water Resour. Res., 46, W12535, doi:10.1029/2009WR008836, 2010. Grinham, A., Gibbes, B., Gale, D., Watkinson, A., and Bartkow, M.:
Extreme rainfall and drinking water quality: a regional perspec-tive, WIT Trans. Ecol. Envir., 164, 183–194, 2012.
Gruber, N. and Galloway, J. N.: An Earth-system perspec-tive of the global nitrogen cycle, Nature, 451, 293–296, doi:10.1038/nature06592, 2008.
Hall, M. R., West, J., Sherman, B., Lane, J., and de Haas, D.: Long-term trends and opportunities for managing regional wa-ter supply and wastewawa-ter greenhouse gas emissions, Environ. Sci. Technol., 45, 5434–5440, 2011.
Harris, G. P.: Biogeochemistry of nitrogen and phosphorus in Australian catchments, rivers and estuaries: effects of land use and flow regulation and comparisons with global patterns, Mar. Freshwater Res., 52, 139–149, doi:10.1071/MF00031, 2001. Harrison, J., Maranger, R., Alexander, R., Giblin, A., Jacinthe,
P.-A., Mayorga, E., Seitzinger, S., Sobota, D., and Woll-heim, W.: The regional and global significance of nitrogen re-moval in lakes and reservoirs, Biogeochemistry, 93, 143–157, doi:10.1007/s10533-008-9272-x, 2009.
Hobgen, S. E., Myers, B. A., Fisher, R. P., and Wasson, R. J.: Creating a sediment budget in a data poor context: an ex-ample from eastern Indonesia, Geogr. Ann. A, 96, 513–530, doi:10.1111/geoa.12076, 2014.
Issa, I. E., Al-Ansari, N., Knutsson, S., and Sherwany, G.: Moni-toring and evaluating the sedimentation process in Mosul Dam Reservoir using trap efficiency approaches, Engineering, 7, 190– 202, doi:10.4236/eng.2015.74015, 2015.
Kennard, M. J., Pusey, B. J., Olden, J. D., MacKay, S. J., Stein, J. L., and Marsh, N.: Classification of natural flow regimes in Australia to support environmental flow management, Freshwa-ter Biol., 55, 171–193, doi:10.1111/j.1365-2427.2009.02307.x, 2010.
Kerr, J. G.: The Transformation of Catchment Phosphorus in Dry Subtropical River Systems, PhD thesis, Australian Rivers Insti-tute, Griffith University, Brisbane, 2009.
Kerr, J. G., Burford, M. A., Olley, J. M., Bunn, S. E., and Udy, J.: Examining the link between terrestrial and aquatic phosphorus speciation in a subtropical catchment: the role of selective ero-sion and transport of fine sediments during storm events, Water Res., 45, 3331–3340, doi:10.1016/j.watres.2011.03.048, 2011. Kõiv, T., Nõges, T., and Laas, A.: Phosphorus retention as a
func-tion of external loading, hydraulic turnover time, area and rela-tive depth in 54 lakes and reservoirs, Hydrobiologia, 660, 105– 115, doi:10.1007/s10750-010-0411-8, 2011.
Ku, H. H.: Notes on the use of propagation of error formulas, Jour-nal of Research of the NatioJour-nal Bureau of Standards, 70, 263– 273, 1966.
Kunz, M. J., Wüest, A., Wehrli, B., Landert, J., and Senn, D. B.: Impact of a large tropical reservoir on riverine transport of sedi-ment, carbon, and nutrients to downstream wetlands, Water Re-sour. Res., 47, W12531, doi:10.1029/2011WR010996, 2011. Leigh, C., Burford, M. A., Roberts, D. T., and Udy, J. W.:
Predicting the vulnerability of reservoirs to poor water qual-ity and cyanobacterial blooms, Water Res., 44, 4487–4496, doi:10.1016/j.watres.2010.06.016, 2010.
Leigh, C., Burford, M. A., Connolly, R. M., Olley, J. M., Saeck, E., Sheldon, F., Smart, J. C., and Bunn, S. E.: Science to support management of receiving waters in an event-driven ecosystem: from land to river to sea, Water, 5, 780–797, doi:10.3390/w5020780, 2013.
Leigh, C., Watkinson, A., and Burford, M. A.: Effects of ex-treme inflows on the water quality and phytoplankton of seven reservoirs in subtropical Australia, Inland Waters, 5, 240–252, doi:10.5268/IW-5.3.814, 2015.
Lewis, S. E., Bainbridge, Z. T., Kuhnert, P. M., Sherman, B. S., Hen-derson, B., Dougall, C., Cooper, M., and Brodie, J. E.: Calculat-ing sediment trappCalculat-ing efficiencies for reservoirs in tropical set-tings: a case study from the Burdekin Falls Dam, NE Australia, Water Resour. Res., 49, 1017–1029, doi:10.1002/wrcr.20117, 2013.
Mahmood, K.: Reservoir sedimentation: impact, extent, and mitiga-tion, The World Bank Washington, D.C., World Bank Technical Paper, WTP71, 133 pp., 1987.
Metson, G. S., Hale, R. L., Iwaniec, D. M., Cook, E. M., Cor-man, J. R., Galletti, C. S., and Childers, D. L.: Phosphorus in Phoenix: a budget and spatial representation of phosphorus in an urban ecosystem, Ecol. Appl., 22, 705–721, doi:10.1890/11-0865.1, 2012.
Olley, J., Burton, J., Hermoso, V., Smolders, K., McMahon, J., Thomson, B., and Watkinson, A.: Remnant riparian veg-etation, sediment and nutrient loads, and river rehabilitation in subtropical Australia, Hydrol. Process., 29, 2290–2300, doi:10.1002/hyp.10369, 2015.
Parsons, A. J.: How useful are catchment sediment budgets?, Prog. Phys. Geog., 36, 60–71, doi:10.1177/0309133311424591, 2012.
Powers, S. M., Tank, J. L., and Robertson D. M.: Control of nitro-gen and phosphorus transport by reservoirs in agricultural land-scapes, Biogeochemistry, 124, 417–439, 2015.
Radach, G. and Pätsch, J.: Variability of continental riverine fresh-water and nutrient inputs into the North Sea for the years 1977– 2000 and its consequences for the assessment of eutrophication, Estuar. Coast., 30, 66–81, doi:10.1007/bf02782968, 2007. Rockström, J., Steffen, W., Noone, K., Persson, Å., Chapin III,
F. S., Lambin, E., Lenton, T. M., Scheffer, M., Folke, C., and Schellnhuber, H.: Planetary boundaries: Exploring the safe oper-ating space for humanity, Ecol. Soc., 14, 32, 2009.
Seqwater: January 2011 flood event: Report on the operation of Somerset Dam and Wivenhoe Dam, SEQ Water, Brisbane, 2011. Sherman, B., Ford, P., Hatton, P., Whittington, J., Green, D., Bald-win, D., Oliver, R., Shiel, R., van Berkel, J., and Beckett, R.: The Chaffey Dam Story – final report to CRC Freshwater Ecology, Canberra, Australia, 2001.
Steffen, W., Richardson, K., Rockström, J., Cornell, S. E., Fetzer, I., Bennett, E. M., Biggs, R., Carpenter, S. R., de Vries, W., de Wit, C. A., Folke, C., Gerten, D., Heinke, J., Mace, G. M., Pers-son, L. M., Ramanathan, V., Reyers, B., and Sörlin, S.: Planetary boundaries: guiding human development on a changing planet, Science, 347, 1259855, doi:10.1126/science.1259855, 2015. Syvitski, J. P., Vörösmarty, C. J., Kettner, A. J., and Green,
P.: Impact of humans on the flux of terrestrial sedi-ment to the global coastal ocean, Science, 308, 376–380, doi:10.1126/science.1109454, 2005.
Thomson, B., Orr, D., Ferguson, B., Gardiner, R., Turner, R., and Warne, M. S. J.: South East Queensland Event Monitoring Pro-gram: Sediment and nutrient loads for 2011–2012, Department of Science, Information Technology, Innovation and the Arts, Brisbane, 2013.
van den Honert, R. C. and McAneney, J.: The 2011 Brisbane floods: causes, impacts and implications, Water, 3, 1149–1173, doi:10.3390/w3041149, 2011.
Van Vuuren, D. P., Bouwman, A. F., and Beusen, A. H. W.: Phos-phorus demand for the 1970–2100 period: a scenario analysis of resource depletion, Global Environ. Chang., 20, 428–439, doi:10.1016/j.gloenvcha.2010.04.004, 2010.
Vörösmarty, C. J. and Sahagian, D.: Anthropogenic disturbance of the terrestrial water cycle, Bioscience, 50, 753–765, 2000. Wallbrink, P. J.: Quantifying the erosion processes and land-uses
which dominate fine sediment supply to Moreton Bay, South-east Queensland, Australia, J. Environ. Radioactiv., 76, 67–80, doi:10.1016/j.jenvrad.2004.03.019, 2004.
Walling, D. and Collins, A.: The catchment sediment budget as a management tool, Environ. Sci. Policy, 11, 136–143, doi:10.1016/j.envsci.2007.10.004, 2008.
Weber, T., Stewart, J., Anderssen, R., Braddock, R., and Newham, L.: Benefits and limitations of current approaches to whole of catchment modelling, Proceedings of the 18th World IMACS Congress and MODSIM09 International Congress on Modelling and Simulation, Cairns, Australia, 13–17 July 2009.

![Figure 7. [TSS], [TN] and [TP] (in mg L −1 ) at dam outlets measured during monthly monitoring (round symbols), calculated from the daily measured turbidity profile (solid lines) and mean historical concentrations (broken lines)](https://thumb-eu.123doks.com/thumbv2/123dok_br/18153225.327829/9.918.240.670.105.404/measured-monitoring-calculated-measured-turbidity-profile-historical-concentrations.webp)