Using Immersive Video Environment
simulations for calibration of evacuation
models
Muhammad Hasan Mustafa
A thesis submitted in fulfillment of the requirements for the award of the
Degree of Master of Science (Geospatial Technologies)
Dissertation supervised by:
Professor Dr. Christian Kray Co-supervisors:
Professor Dr. Judith Verstegen Professor Dr. Sven Casteleyn
Institute For GeoInformatics At the University of Münster
II
Declaration
I declare that this thesis entitled “Using Immersive Video Environment simulations for Calibration of evacuation models” is the result of my own research except as cited in the references. The thesis has not been accepted for any degree and is not concurrently submitted in candidature of any other degree.
Signature:
Name: Muhammad Hasan Mustafa
Place: Münster, Germany
III
Acknowledgement
First, I would like to thank my supervisor, Professor Dr. Christian Kray for valuable guidance and advice, for providing inspiration and motivation when required and for always being willing to help. I would also like to thank my Co-Supervisors, Professor Dr. Judith Verstegen and Professor Dr. Sven Casteleyn for their support during this project.
I would also like to thank Samuel Navas Medrano for his support about the workings of the Immersive Video Environment. I also extend my thanks to my friends and family whose support made it possible for me to be who I am today.
IV
Abstract
This thesis explores the potential of Immersive Video Environment (IVE) simulations for studying evacuation behavior and calibration parameters of evacuation models. Crowd disasters have increased in frequency and intensity and have resulted in many casualties in recent years. These disasters can occur at different scenarios and are caused by a myriad of reasons. Over the years, the methods to study the evacuation behavior have evolved and evacuation models are extensively used. There are many kinds of models that are used, however there are many issues faced in the calibration of these models. The reason for the problems in calibration mostly stem from a scarcity of data related to evacuation behavior. It is difficult to conduct evacuation drills and gather data from actual evacuations. Virtual Reality (VR), in particular the IVE can help bridge this gap by allowing for systematic studies, that are safe, reliable and with high ecological validity to be conducted. To study the viability of IVE simulations for this, a user study was conducted to observe the evacuation behavior and see the impact of building familiarity and visibility on evacuation performance. The impact of building familiarity and visibility was studied on the Route Choice, Exit Choice, Decision Time, Total Evacuation Time and User errors. The results of the study showed that the evacuation performance increases with building familiarity and is reduced when the visibility is low, this is much more apparent when the users are not familiar with the building. The study also established the Route Choice as being the main contributing factor to the Total Evacuation Time and showed that in most of the cases (75% of the time) the people not familiar with the building chose familiar exits while the people familiar with the building chose emergency exits. The results of the study coincide with the existing literature and show that the use of IVE simulations is a viable method for studying evacuation behavior and calibration parameters for evacuation models.
V
Table of Contents
Declaration ... II Acknowledgement ... III Abstract ... IV Table of Figures ... VII Table of Tables ... VII
Introduction ... 1
1.1 Related Work ... 2
1.2 Concept and Idea... 3
1.3 Aim & Objectives ... 3
Related Work ... 5
2.1 Evacuation Models... 5
2.2 Calibration of Evacuation Models ... 7
2.3 The Immersive Video Environment... 8
2.4 Usability Evaluation... 10 2.5 User Studies ... 11 Research Methodology ... 13 3.1 Overview ... 13 3.2 Parameters ... 14 3.3 Study Area ... 16 3.4 Simulations ... 17 3.5 Study Design ... 20 3.6 Data collection ... 22 Results ... 24 4.1 Overview ... 24
VI
4.2 Individual test result ... 25
4.2 Decision Time ... 26
4.3 Total Evacuation Time ... 26
4.4 Exit choice and Errors ... 27
4.5 NASA-TLX... 28
Discussion ... 30
5.1 Decision time & Total Evacuation Time ... 30
5.2 Exit Choice and Errors ... 32
5.3 NASA-TLX... 32
5.4 Research Question ... 33
5.5 Limitations ... 34
Conclusion & Recommendation ... 36
6.1 Summary ... 36
6.2 Future Work & Recommendations ... 37
6.3 Conclusion ... 37
Bibliography ... 39
Annex ... 45
The informed consent form ... 45
NASA-TLX Form ... 47
VII
Table of Figures
Figure 1. The IVE (https://sitcomlab.github.io/IVE/intro/) ... 9
Figure 2. IVE Architecture (https://sitcomlab.github.io/IVE/intro/) ... 9
Figure 3. Methodology ... 14
Figure 4. Categorization of the parameters as independent, dependent and control variables... 16
Figure 5. Floorplan of the 2nd Floor of GEO-1 (The study area) ... 17
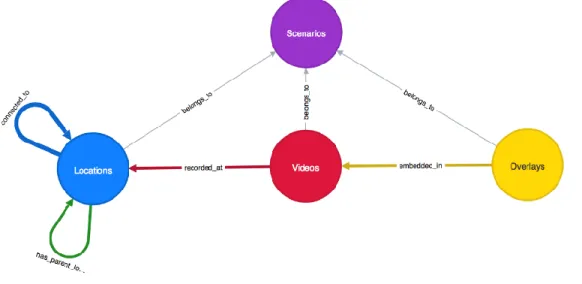
Figure 6. The overview of the graph relationships in place for each scenario (https://sitcomlab.github.io/IVE/data/) ... 18
Figure 7. Scenes from Simulation 2, without smoke overlays. The simulation starts at the start point as indicated in figure 5 and ends when the user reaches and choose an exit. ... 19
Figure 8. Scenes from Simulation 3, with smoke overlays. The simulation starts at the start point as indicated in figure 5 and ends when the user reaches and choose an exit. ... 20
Figure 9. Shows the pointing motion used to pick the direction of movement at each decision point. The starting position is the running stance, then the user extends arm in the direction they want to pick, and then finally the transition to the next decision point takes places giving time to the user to get back in the default running stance.... 21
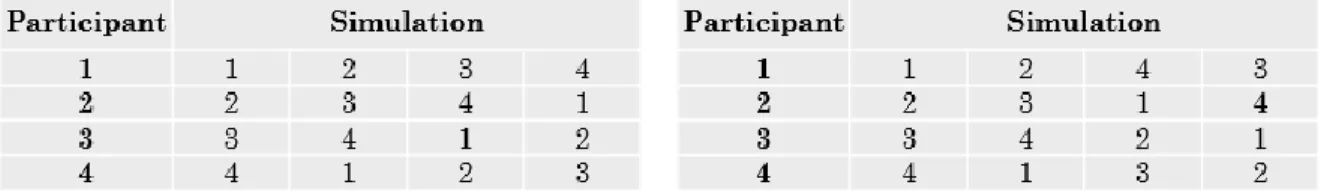
Figure 10. Balanced Latin square designs to for counterbalancing to prevent order effects. This is used to determine the order of the simulations for each participant in the group. ... 22
Figure 11. Individual test result for a user from group 1 (not familiar with building) on simulation 2. ... 25
Figure 12. Comparison of DT between group 1 and group 2 for all simulations. ... 26
Figure 13. Comparison of TET between group 1 and group 2 for all simulations. ... 27
Figure 14. Results of the NASA-TLX for each group and combined... 29
Figure 15. The results of simulation 3. All the users in Group 1 choose the familiar exit which is much further away, while 75% of the people in group 2 choose the emergency exit located close to the start point. ... 31
Table of Tables
Table 1. Aggregated results of the users not familiar with the building. ... 241
Chapter 1
Introduction
Crowd disasters have been around for a long time. Whenever many people gather the potential for disaster is increased, and these disasters require rapid evacuations. The occurrence of these types of disasters has been amplified in the past few decades and has resulted in a high number of casualties (Helbing & Mukerji, 2012).
Crowd disasters can occur in stadiums, like the Hillsborough disaster of 1989 which resulted in 96 deaths and over 500 injuries during a football game in Sheffield, England (Hillsborough Independent Panel, 2012). These disasters can also occur during religious pilgrimages, the largest and most disaster prone being the Hajj in Mecca, where a stampede in 2015 resulted in over 2000 deaths (Alaska, Aldawas, Aljerian, Memish, & Suner, 2017). Indoor events are also a risk: a fire in a nightclub in Brazil in 2013 killed 242 people and injured 633. This incident highlights panic behavior in emergency situations since over 180 people were found dead in the toilets because they mistook it for the exit and ended up getting trapped, and around 200 people were injured because of being trampled at the main exit (Dal Ponte, Dornelles, Arquilla, Bloem, & Roblin, 2015). Most of the casualties during crowd disasters can be attributed to a combination of bad planning, miscommunication and mass panic as is the case in the disasters listed above.
Effective and efficient evacuations plans can prevent the crowd disasters from occurring and help mitigate the damages and casualties when they do happen. In order to create these plan, infrastructure supporting evacuations is key and the effect of the infrastructure on the evacuations themselves needs to be studied (Helbing & Mukerji, 2012). Modelling the behavior of crowds is not simple, the complexity rises significantly when dealing with emergency situations as the behavior of individuals can become very erratic (Trivedi & Rao, 2018).
2
1.1 Related Work
Evacuation modeling techniques face many issues, as explained in chapter 2, the chief amongst them being the lack of reliable data. This scarcity of reliable data affects not only the study of evacuation but also makes it difficult to validate and support the results and outcomes of the various studies (Lamperti, Roventini, & Sani, 2018). Virtual Reality (VR) for studying human behavior during emergencies and calibrating/validating the evacuation models is a possible solution to this problem. Using VR helps to solve many of the problems that are associated with evacuation drills (Jerald, 2015). VR is safe, there are little to no ethical or moral issues with using VR for studying emergency behavior, provided necessary protocols are followed, there is high degree of experimental control, many different types of simulations can be performed to study different parameters and the impact of small changes on the overall result can also be observed. VR based studies provide high replicability and have high ecological validity (Kinateder et al., 2014).
The results from VR drills have proven to coincide with the results from actual evacuation drills as well. Kobes et al. (2010) compared the results of a VR based hotel evacuation drill with the same experiment in real life and found that the results from both drills coincide to a great degree and there were only small variations. They were also able to conclude that the developed VR system is a valid tool for research on evacuation behavior.
VR based systems have been used for various studies regarding evacuation and emergency behavior successfully. Cave Automatic Virtual Environment (CAVE) are particularly useful for this type of analysis and study (Muhanna, 2015). The Immersive Video Environment (IVE) is a type of CAVE system and can be used to study crowd behavior during high stress situations as well. Moussaïd et al. (2016) used a 3D IVE to study crowd behavior and were able to observe behavior like mass herding, dangerous overcrowding, and were able to describe how these phenomena occur due to crowd density.
Calibration of a model is defined as the alteration of the model parameters to achieve accurate simulation results, whereas the parameters are the independent variables in the model that are changed by the user (Klüpfel, 2007a). Ecological validity refers to the extent to which the environment created in the laboratory in an experiment or study reflects real life circumstances.
3
1.2 Concept and Idea
The IVE provides a unique opportunity to study the behavior of people during emergency evacuations without putting the people in danger and keeping a high degree of ecological validity. Being in a controlled environment also ensures a high degree of control on the study and allows the study to be easily replicable.
VR has been used to study evacuation behavior with a high degree of ecological validity, experimental control and reliability but the potential for using VR to get information for calibration of evacuation models has not been explored. The idea behind this thesis is to evaluate how the IVE can be used to help in the calibration of evacuation models. By means of a literature review the most common parameters for the calibration of evacuation models were identified and from those parameters, the most suitable ones (that could be studied reliably in the IVE) were chosen. These parameters were then studied in a user study which is defined and explained in chapter 3.
This thesis hopes to help establish VR in general and the IVE in particular as a reliable source of building evacuation data. This data can then be used for the calibration of evacuation models and further improve the process of emergency evacuation.
1.3 Aim & Objectives
This thesis explores the potential of the Immersive Video Environment to provide more information on evacuation behavior, which can then be used to study the calibration parameters of evacuation models. It hopes to establish the IVE as a viable tool for studying evacuation behavior and for gathering pertinent information. The thesis answers the fundamental research question “How to effectively use IVE as a tool for studying evacuation behavior and calibration parameters of evacuation models?”. This is done by establishing the following objectives:
1. Establish state of the art for evacuation models & calibration. 2. Prepare the IVE by creating videos, overlays and simulations.
4 3. Investigate the impact of building familiarity on evacuation performance. 4. Investigate the impact of visibility on evacuation performance.
5
Chapter 2
Related Work
This chapter first gives related work will be presented, along with a brief overview of the modeling of pedestrian and evacuation simulations, as well as the IVE and its role in the context of this thesis. The parameters to be studied will also be described and presented.
2.1 Evacuation Models
Pedestrian crowds and emergency evacuations have been studied widely in recent decades through different methods including observations, time-lapse studies and analysis of data from evacuations (Helbing, Farkas, & Molnar, 2002). Gradually it became possible to create simulation models for pedestrians and emergency evacuations that represented their behavior appropriately. Many of these models have been used extensively to study emergency evacuations to a high degree of success and accuracy (Helbing & Johansson, 2012).
Different factors need to be kept in mind when creating any evacuation model or simulation including, physical, social and psychological factors. These factors are not easy to measure and can be random in some cases, it is imperative that these factors be studied in a systematic way to understand how people behave in emergency situations, when effected by escape panic (Helbing, Farkas, & Vicsek, 2000).
Multiple modelling techniques have been developed over the years that have been successful in simulating pedestrian behavior which can be used in emergency evacuation scenarios. These include Cellular Automata in which the floor area is divided into cells which make up the grid where each cell can only contain one person and these cells can be used to model open spaces, obstacles and other attributes. People then move between cells based on the rules defined. An example of this was shown by Varas et al. (2007), in which they defined a floor field and
6 introduced a “panic” parameter. The model developed showed the impact of obstacles when considering the effect door of width on the evacuation performance, which results in the creation of local bottlenecks that remove any positive impact of increasing door width.
Social Force Model is another type of model that considers the impact of the motivation of the pedestrian to perform certain actions, these are termed as “social forces” and are not directly exerted by the immediate surroundings of the pedestrian. This includes factors like desired direction, desired velocity, attractive effects to other pedestrians and more. This was first developed by Helbing et al. (1995) and has been used extensively since in various forms (Lakoba, Kaup, & Finkelstein, 2005; Parisi, Gilman, & Moldovan, 2009; Zheng, Zhong, & Liu, 2009). Agent-Based Models (ABMs) are another type of the modelling techniques used. They allow building an artificial environment populated by agents that can interact with each other. These agents can be intelligent, autonomous, adaptable and purposeful. The interactions between the agents can be characterized by various situations of mobility like following other agents (herd behavior), leading other agents (leadership) and the restriction of movement at a blockade (congestion). ABMs provide a unique opportunity to study the behavior of crowds and explore the relationships and interactions that occur at an individual level. Which is why ABMs have been used extensively to study emergency evacuations (Almeida, Kokkinogenis, & Rossetti, 2012; Ren, Yang, & Jin, 2009; Samuelson et al., 2008).
ABMs provide the opportunity to incorporate different parameters and gain additional insights. An example of this the approach of combining the ABMs with “Social Forces” from the social forces model used to gain additional information about the impact of complex environments on the various parameters and factors that affect the evacuation process itself (Braun, Bodmann, & Musse, 2006). Another approach was to use ABMs while considering socio-cultural factors, which enabled the study of various important factors like familiarity with environment, response time and fear. The results showed that familiarity with the environment might reduce the evacuation time but could also increase the number of injuries sustained due to falls (van der Wal, Formolo, & Bosse, 2017).
7
2.2 Calibration of Evacuation Models
Although extensive research has been done to improve the modelling techniques and simulations used to study the emergency behavior, correct calibration of these models remains most an active field of study (Lamperti et al., 2018). Several studies have been conducted on using different techniques to calibrate the models and these techniques are not easy to replicate for each scenario as each parameters needs to be carefully considered and studied for each case to make sure that the model provides a close reflection of reality (Daamen & Hoogendoorn, 2012; Ren et al., 2009). The reason for validation and calibration being difficult to achieve is due to the lack of real-world data for emergency evacuations. In many cases data simply does not exist, and when it does it is often very limited and not reliable. Emergency situations by their very nature are not easy to predict and during these situations the focus is not on gathering data but on mitigating the situation and minimizing the damages. Data for emergency situations and under panic conditions is very difficult to capture as these events are not common and the information is gathered slowly, most of it is gained from conducting evacuation drills and conducting crowd experiments (Rinne, Tillander, & Peter Grönberg, 2010). These drills and experiments are very expensive to coordinate and prove to be dangerous for the people involved in them, ensuring ecological validity might lead to increased risk to the participants of the drill, which also raises ethical and moral issues with the drills themselves. Furthermore, the drills cannot be easily replicated as there are many factors that cannot always be reproduced and thus systematic studies are not always possible using this technique (Shiwakoti, Sarvi, & Rose, 2008).
Different techniques have been used for the calibration of the models, these include brute force, data assimilation and regression, while there are several sources of the calibration data including laboratory experiments and historical data. Another approach to calibration is using parameters values from existing literature and this is easy to use as there is no need to perform a calibration, though this might not always be applicable. Daamen et al. (2012) used laboratory experiments to calibrate the evacuation model “Nomad” and use the results to predict the behavior of people around emergency doors and calculate the capacity of the doors themselves. They were able to observe different behaviors for the three groups, children, adults and the elderly but the differences
8 were not as distinct as in the preceding literature. This technique was limited to a specific evacuation model as well and generalizing it might be problematic.
Another method for calibration of models is to use statistical approaches and data driven approaches to calibrate the models. These approaches are dependent greatly on the data already available and have been evolving as well. Ward et al. (2016) use dynamic data assimilation to calibrate an ABM used to predict the number of people passing through a street hourly. This application provided promising results with a low Root Mean Square Error (RSME), but the main drawback of this approach is the high amount of data required for it to work, and they did not calibrate the highly complex parameters. Machine learning techniques have been used to try and cater to the data scarcity problem, Lamperti et al. (2018) use intelligent sampling and supervised machine learning to create a low cost surrogate meta-model which is then used for calibration and parameter space exploration. They tested it on two existing ABMs and were able to significantly reduce the time required for calibration.
Most of the research done for calibration of simulation models does not deal with emergency evacuation and this highlights a potential area for improvement that is the focus of this thesis.
2.3 The Immersive Video Environment
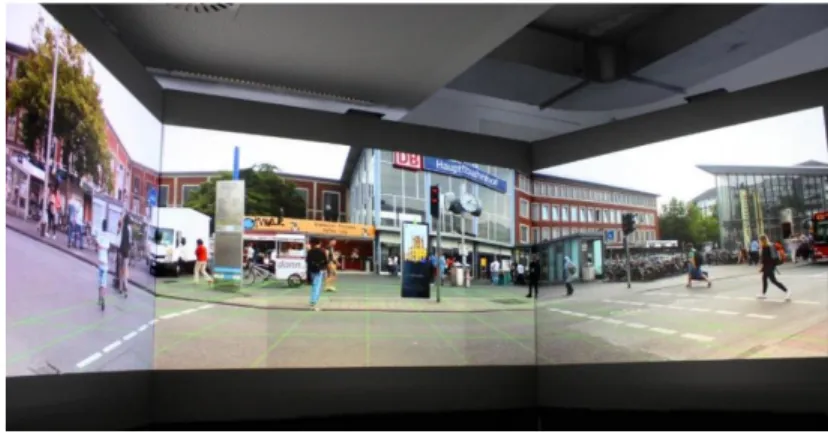
Immersion is the feeling of being present in a virtual world. It is the effect caused by a situation, system, or environment which makes the user perceive the virtual environment as reality. Enhancing immersion is one of the main objectives of VR systems in general (Jerald, 2015). The IVE used in the thesis is an update on the Public Display Evaluation and Design Toolkit (IPED-Toolkit) developed in the Situated Computed and Interaction (SITCOM) lab in the Institute of Geoinformatics (IFGI) by Ostkamp et al. (2014). The IPED-Toolkit was designed as a system for evaluation and quick prototyping of public display systems in VR, which helps reduce the overall cost. The IVE uses the CAVE system, where the user stands in the middle of three spatially arranged screens allowing the user to experience a panoramic view and be immersed in the scene. The IVE can be used for testing evacuation scenarios as well, the CAVE environment provides a good opportunity to study the behavior of people as discussed in section 1.2.
9 The IVE can be divided into four main parts, the Content-Management-System (CMS), the Viewer, the Remote Control, and the Server. The CMS is used to create, edit, update & manage the data for the IVE, this is where all new scenarios are created, where the videos, overlays, locations and relationships between the various items are defined. The Viewer is used to display the content created in the CMS; this is what the user standing in the IVE sees. The content displayed in the Viewer is regulated by the Remote Control. The Remote Control is used to select the scenario, location, video and overlays to display in the IVE using the Viewer. The final part of the IVE is the Server, it forms the backbone of the entire system. The clients are all hosted on a Nodejs webserver and a REST-API connects them with the Neo4j graph-database that stores all the data. The IVE can be accessed on the university network using the link: http://giv-sitcomdev.uni-muenster.de:5000/ .
Figure 1. The IVE (https://sitcomlab.github.io/IVE/intro/)
10
2.4 Usability Evaluation
Usability refers to the ease of access and use of a product or system. The level of usability is determined by the features and the context of use (the user’s environment and what the user wants to achieve) of a design or product. Usability has many definitions; the official ISO 9241-11 definition is: “the extent to which a product can be used by specified users to achieve specified goals with effectiveness, efficiency and satisfaction in a specified context of use.”. Usability evaluation can be used to test the effectiveness, efficiency and satisfaction of a system or product, it also helps ascertain the success of a system or product and acts as a way to gain feedback from the user (Lewis, 2012).
There are many ways to evaluate the usability of a system. The focus for this thesis is on the usability evaluation in virtual environments as the main component of the system is the IVE. The evaluation techniques can be divided into two categories based on the purpose of the evaluation. Formative Evaluation facilitates the design of the product by assessing it from the aspect of usability, they tend to be more qualitative in nature and can be both formal and informal. Summative Evaluation is the usability evaluation of the finished design to check if the design satisfies the required performance criteria and goals using realistic conditions. Some of the usability evaluation techniques are listed below:
Cognitive Walkthrough: In this technique the evaluators complete a series of tasks and provide feedback from the perspective of the user. The focus is on understanding how easy it is for new users to perform tasks on the system (Rieman, Franzke, & Redmiles, 1995).
Heuristic Evaluation: In this technique a group of experts evaluate the design of the product or system against a list of design principals and identify the discrepancies. This works best when then work of a group of experts is aggregated (Nielsen & Molich, 1990).
Questionnaire: In this technique feedback from the users is gathered after they have participated in the study or experiment, by asking them to answer a written set of questions. This technique is useful for gathering subjective data in a reliable and convenient way.
Interview: In this technique evaluators formulate questions about the product or system based on the issues they are concerned about. The users are then asked these questions to gather feedback.
11 This technique helps in gathering subjective data, user opinions, and understanding the user’s thought process.
The goal of the thesis is to determine how the IVE simulations can be used to study calibration parameters of evacuation models, this is being done by conducting a user study. To make sure that the user study is reliable, we need to test the performance of the system. The most reliable and convenient way to do that is to use a questionnaire to get structed feedback from the users. There are several questionnaires for evaluating the performance of a system, the most widely used include:
NASA Task Load Index (NASA-TLX): This is a subjective evaluation tool that measures perceived workload across six dimensions to gauge a task or system effectiveness and performance. The dimensions evaluated are: Mental Demand, Physical Demand, Temporal Demand, Performance, Effort and Frustration (Hart & Staveland, 1988).
Subjective Workload Assessment Technique (SWAT): This technique assesses the workload of a task by asking the users evaluate the task based on three factors, Time Load, Mental Effort Load, and Psychological Stress Load. SWAT has two stages, in the first stage the user organizes the levels of workload factors in ascending order of workload before the study or experiment, in the second stage the user and rates each of the factors during the study or experiment. (Reid & Nygren, 1988).
2.5 User Studies
User studies provide valuable insights on how effective a given technique is, they can also help identify why that technique is effective and how it can be improved, they work really well for visualization (Kosara, Healey, Interrante, Laidlaw, & Ware, 2003). The number of people required for user studies dealing with usability is usually subjective and depends on the complexity and characteristics of each study. The general consensus is that between five and twenty people are enough to figure out most of the usability issues in a system, and an increased sample size will provide better result only until a certain point (Faulkner, 2003). Most of the user studies dealing
12 with VR have less than 24 participants according to Kim (2012) although this number is increasing in recent years. Keeping in regard all the factors, the number of participants for this study will be kept between 15 and 20.
For user studies using CAVE or VR in general there are several guidelines and precautions that must be taken into consideration (Jerald, 2015). To reduce any safety risks the users should complete the tasks in a safe, controlled environment. The time users spend in the system should be kept to a minimum to ensure that users don’t feel nausea or any other type of sickness. The interaction methods need to be properly defined in such a way that the required data is gathered without any additional input from the users (Muhanna, 2015).
13
Chapter 3
Research Methodology
3.1 Overview
This chapter begins with an overview of the methodology and then goes into details about the steps involved. Starting with a description of the parameters chosen for the study, then the study area for the simulations, and then gives a brief explanation of the simulations themselves. After that the study design is explained and the methods of collecting the data are also explained.
After examining the related work in building evacuation modelling and calibration of those models and keeping in view all the points from section 2.6, and the guidelines for VR in general, a user study is designed with multiple short scenarios, taking place inside the lab with an evaluator recording all the interactions that the users have with the system.
The statistical analysis of the data gathered form the study depends on the data distribution, to find that out, a descriptive data exploration is conducted. The statistical test chosen for the study is the repeated measures test as the study was performed using the within-group approach, where each user gets is subjected to all the test conditions (MacKenzie, 2013). A repeated measure Analysis of variance (ANOVA) and the Friedman test are chosen for the data analysis as there are more than two matched groups that were compared (Robertson & Kaptein, 2016).
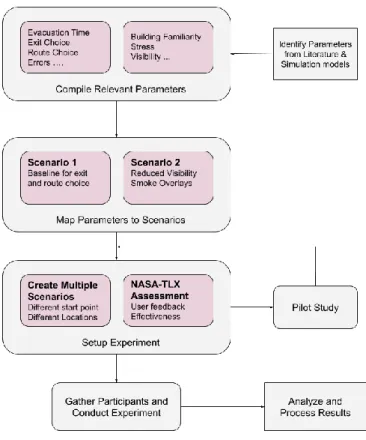
The overview of the methodology is shown in figure 3, and it is explained in more detail in the subsequent sections in this chapter.
14 Figure 3. Methodology
3.2 Parameters
The parameters for an evacuation model can have a wide range and are generally the variables that are being studied, the independent variables. In the context of this thesis however, parameters refers to all the variables that are being considered, be they independent variables (the ones that are influenced by the user response), dependent variables (the variables that are the measure of the change in the independent variable) or control variables (which have an impact on the outcome but are not under being studied). These parameters were chosen in general because of the high impact they have on the outcome of the evacuation models and because they could be effectively studied using the IVE (Klüpfel, 2007b).
After analyzing related literature and going through the commonly used evacuation models of different types, as explained in chapter 2, the parameters identified for studying using the IVE are defined below,
15 Building familiarity: This is one of the main parameters that will be studied in the experiments. It is as how known the building is to the participant. Participants are divided into two distinct categories, familiar with building and not familiar with building. “Building” refers to the study area depicted in the simulations and scenarios. This is an independent variable.
Smoke/Visibility: This is the second main parameter that is being studied. It is defined as the presence of smoke overlays in the scenarios which lead to reduced visibility. The smoke overlay opacity is between 40-65% based on the location in the particular scenario, as they are made to replicate the real world behavior as closely as possible (higher smoke opacity in regions where the smoke would be trapped as compared to open areas). This is also an independent variable.
Decision Time: This is defined as the time taken, in seconds, by the participant to decide which path to take at each decision point. This only includes the time that passes after the participant is presented with a new choice, till the choice is made (as indicated by gestures). This is a depended variable.
Total Evacuation Time: This is defined as the total time, in seconds, that the participant takes to complete the evacuation in each scenario. It is the time from the beginning of each scenario till the scenario finishes. This includes the decision time, along with the time taken to traverse the decision points. It is also a dependent variable.
Exit Choice: This is defined as the exit that the participant takes to evacuate from the building in each scenario. The exits are divided into two categories, familiar exit (the main staircase, used during normal situations) and the emergency exits. This is also a dependent variable.
Errors: They are defined as the number of incorrect inputs provided by participant to the system. These can be at dead ends, or the participant gesturing to a direction where no path exists, and it can also occur if the participant takes longer than 5 seconds to decide on a path at any decision point. Errors are counted per scenario for each participant. They also count as a dependent variable. Alarm: This is a control variable and is defined as a fire alarm that plays in the lab when the experiment is being conducted. The purpose of the alarm is to induce a state of emergency in the participant and to improve the ecological validity. The presence of stress is one of the differentiating factors for evacuation research which are hard to replicate in the lab, the alarm helps with that.
16 Time Limit: This is the second control variable and is in tandem with the alarm to create the illusion of an evacuation situation. There are two kinds of time limits implemented in the experiment. The first is the time limit on the decision time, the participant has 5 seconds to make a decision at each decision point before the input is considered an error, and second is the time limit on the total evacuation time, which is dependent on each scenario. If this time limit is crossed, then the evacuation is a failure.
Position: The final parameter that is considered is the position. This is defined as the position in front of the IVE where the participant is supposed to stand to get the best immersion. This was added after conducting the pilot tests where a change in the position in front of the IVE resulted in reduced visibility and the participant not being able to make fully informed decisions.
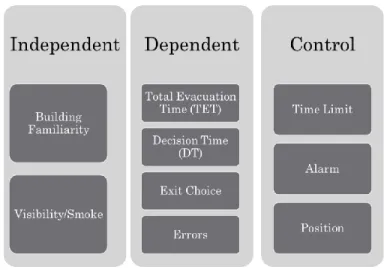
The parameters are divided into independent, dependent and control variables as shown in figure 4.
Figure 4. Categorization of the parameters as independent, dependent and control variables.
3.3 Study Area
The 2nd floor of the GEO-1 building (Heisenbergstraße 2, Münster) is used as the study are for the simulations of the user study. This building was chosen because it has a simple design, with 2 emergency exits and 2 ways to access the main staircase, which ensures that the building complexity doesn’t impact the results. Since this is the building that is the main campus for the
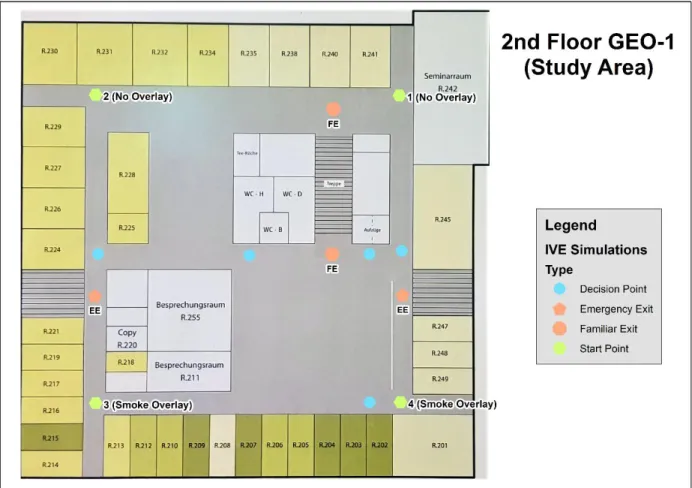
17 GeoTech program (the course the thesis is for) it makes it easier to understand the results and outcomes from the study, as a thorough understanding of the building itself helps in the analysis of the results and makes it easier to plan and setup the simulations. The floorplan of the study area is shown in figure 5.
The study itself will take place in the SITCOM lab (room 245) in the GEO-1 building as well.
Figure 5. Floorplan of the 2nd Floor of GEO-1 (The study area)
3.4 Simulations
The IVE simulations that are used for the user study are created by following the guidelines for VR studies found during the literature review in chapter 2.
18 The first step in the creation of these scenarios is gathering the videos of the study area, which is the 2nd foor of GEO-1. For the purpose of this user study, videos from all intersections and paths,
called decision points, inside the building were needed. A decision point is where the user has more than one option in the path they can take. A total of 34 videos, for 13 decision points were collected as seen in figure 5 (the exits and start locations are also decision points). Each video had a resolution of 5760 x 1080, since the IVE is an amalgamation of three spatially arranged screen each with a resolution of 1920 x 1080, a resolution of 5760 x 1080 ensures that the video convers the IVE completely.
Each simulation was created inside the content management system (CMS) of the IVE, as explained in chapter 2. Each simulation/scenario is created by linking together different locations, that contain videos and overlays. Before any video can be added to the CMS, its location needs to be defined, after the location is defined, the relationship between the locations is defined and that is how the links between videos are created. These linked videos are then added to the scenarios which leads to the creation of the scenarios. The basic structure of this graph relationship for each scenario is shown in figure 6.
Figure 6. The overview of the graph relationships in place for each scenario (https://sitcomlab.github.io/IVE/data/)
One of the parameters being studied through these simulations is the impact of visibility and overlays on the overall evacuation performance. For this purpose, simulations with smoke overlays need to be created as well. Half of simulations created will be with smoke overlays and half without.
19 The starting locations of the 4 simulations are shown in figure 5. The simulations numbered, 3 and 4 are the ones that contain the smoke overlays while simulations 1 and 2 don’t have any overlays. The reason for that is to ensure that each main corridor of the building is covered by both kinds of simulations. Each simulation has access to all the Decision Points and Exits, and the users were not provided any instructions about which exit they should choose, this was to ensure that the decisions they make are not influenced by the instructions provided by the examiner and to ensure that the behavior of the people not familiar with the building remains natural.
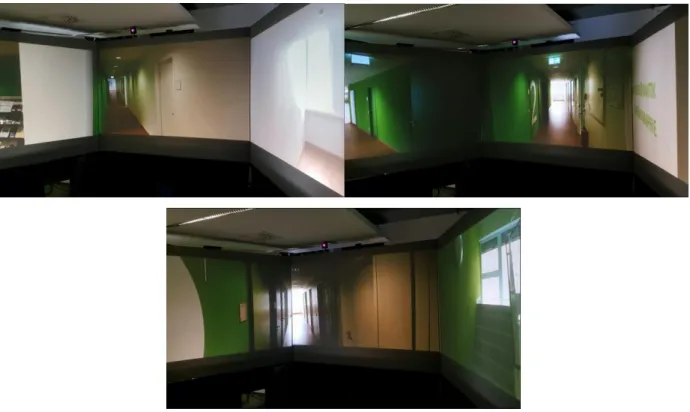
The smoke overlays could not be created using the CMS as they were video overlays, so the videos which were supposed to contain the smoke overlays were edited using Filmora9, and the overlays were added to them. The opacity of the overlays was kept between 45 to 65% depending on the simulation (see Annex for detailed video specifications). Simulation 1 and 2 don’t contain any overlays, parts of simulation 2 can be seen in figure 7. The simulation starts from the start point shown in figure 5, and then continues through the decision points until the user reaches and chooses an exit, in this case the emergency exit.
Figure 7. Scenes from Simulation 2, without smoke overlays. The simulation starts at the start point as indicated in figure 5 and ends when the user reaches and choose an exit.
20 Similarly figure 8 shows scenes from simulation 3, which contains smoke overlays. The simulation begins at the start point as shown in figure 5, and continues through the decision points until the user reaches and chooses the exit, which in this case is the familiar exit on the main stair case.
Figure 8. Scenes from Simulation 3, with smoke overlays. The simulation starts at the start point as indicated in figure 5 and ends when the user reaches and choose an exit.
3.5 Study Design
The study was designed based on the finding of the literature review and after studying the related work. During the study the user was asked to evacuate from the building as fast as they could, this was done by navigating through the different simulations by choosing which path to take at each decision point. For the purpose of this thesis, 16 participants were chosen to complete 4 simulations. The 16 participants were further divided into 2 groups based on their familiarity with the study area, the 2nd floor of GEO-1, as a result there were 8 people familiar with the building and 8 people not familiar with the building.
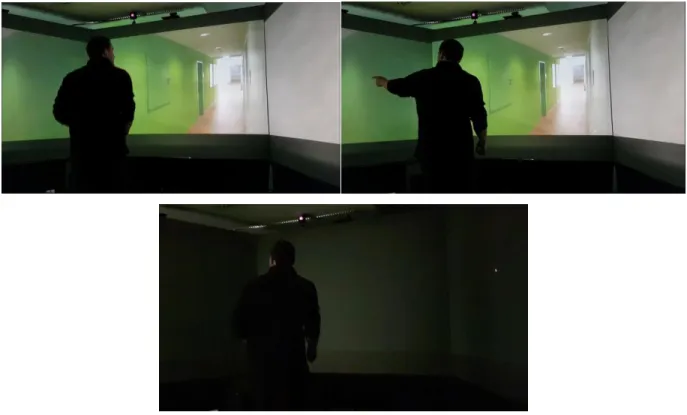
21 Each user was asked to stand in front of the IVE and pretend to run, then they were shown the different videos in the simulation and asked to choose which path they would take by pointing in the direction they want to pick. They were not given any additional information about the floor plan or the evacuation plan and were asked to use their own understanding of the system and the simulations to make their way to the exits. The user was given instructions to point towards the chosen direction by fully extending their arm and this was the point that the evaluator would use to switch the video to the next one in the simulation, as shown in figure 9. Before each new video in the simulation was played, a transitional time of 3 seconds was given to allow the user to get back into the default running stance, this allows the user to get into position again and to avoid any errors recording the responses.
Figure 9. Shows the pointing motion used to pick the direction of movement at each decision point. The starting position is the running stance, then the user extends arm in the direction they want to pick, and then finally the transition to the next decision
point takes places giving time to the user to get back in the default running stance.
The time the users took for completing each simulation was recorded, along with the time they took to make each decision. The path that the users took to the exit, along with the exit they chose was also recorded. To ensure that the users felt like they were in an evacuation situation, a fire
22 alarm was playing in the background during the simulation, the users were also informed about a time limit for completing each simulation, as well as for making each decision.
To control learning effects, the users were shown how the controls of the IVE work by completing a short demo simulation where they had to choose two different directions. Order effects were removed by counterbalancing and further dividing each group of 8 participants into 4 and creating balanced Latin squares (each element occurs only once in each row and column) to determine the order for the simulations, as shown in figure 10.
The users were then asked to fill out an informed consent form (see Annex), before taking part in the study itself. After a simulation was complete, the user was given a few seconds of rest, asked if they would be fine with continuing and presented with the next simulation when they agreed. After all the 4 simulations were complete, the user was asked to fill in the NASA-TLX form (see Annex) in pen and paper format to gain feedback about the effectiveness of the system and how the user gauges their performance.
3.6 Data collection
The parameters that need to be recorded from the user response are the dependent variables identified in section 3.2. These include, Total Evacuation Time (TET), Decision Time (DT), Exit Choice and Errors. To record the responses of the user and keep track of all their interactions with the system the screen of the IVE and the screen of the evaluator were recorded at all times. Careful consideration was taken to ensure that there was no lag between the user pointing to the chosen path and the evaluator making the required switch in the videos to ensure that the DT was recorded correctly.
Figure 10. Balanced Latin square designs to for counterbalancing to prevent order effects. This is used to determine the order of the simulations for each participant in the group.
23 From the video recordings made for each user, only the DT was calculated using the time stamps in the video. The DT was taken as the time between the user being shown a new video to the time the user’s arm fully extended in the direction of the path they want to take in the next part of the simulation (as shown in figure 9), if the decision they were making was the last one, meaning they reached the exit, then instead of a new video it would be a black screen and that was taken as the ending point. Errors are when the user tries to travel in a direction that is a dead-end or when they exceed the 5 second time limit on choosing a path at a decision point.
The Exit choice was simply based on the exit used by the user to complete the evacuation in each simulation. While the TET calculated by taking into account the path taken by the user to get to the exit, the distance between each decision point in known and the speed for evacuation taken between 1 m/s and 1.5 m/s (Helbing et al., 2000) this is used to get the time for transition between the decision points, which was added to the previously calculated DT.
24
Chapter 4
Results
4.1 Overview
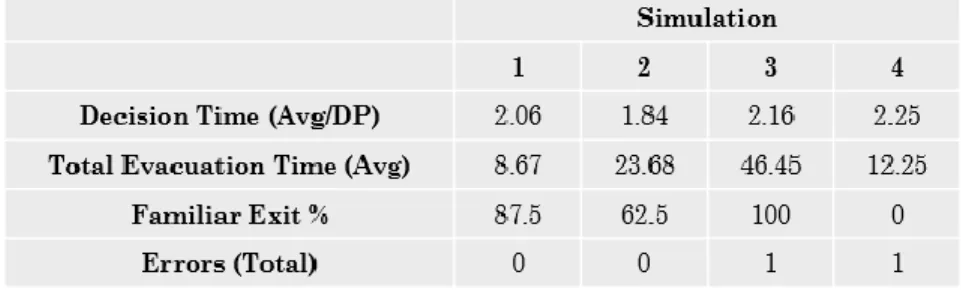
The results for all four simulations for all the groups were calculated, as explained in the data collection section in chapter 3, for this study the aggregated results are going to be used and discussed. The aggregated test results are divided based on the building familiarity that the users had, the people not familiar with the building are termed as group 1 and people familiar with the building are termed as group 2 from this point on. The aggregated results (mean) are shown in table 1 and 2.
Table 1. Aggregated results (mean) of the users not familiar with the building (group 1).
25
4.2 Individual test result
Although aggregated results are used to analyze the behavior of the people during the evacuations, individual test results should also be discussed. This is what is the actual outcome of each run of the simulation. The aggregated results are calculated by getting the mean of all the individual results of the study. The result of an individual test performed by a member of group 1 (not familiar with the building) on simulation 2 (without any overlays) is shown in figure 11. The result shows the path taken by the user to get to the exit, it also shown the exit choice (the familiar exit). The average DT for this test was 2.1 seconds while the TET for this test was 26.7 seconds.
As more tests are conducted, the values of DT and TET are aggregated, while the number of errors is added, and the exit choice is also noted for each simulation and for each group.
26
4.2 Decision Time
The Decision Time (DT) is the time taken to make the decision at each decision point. The average DT per decision point for each simulation in group 1 is higher than the average DT per decision point in group 2. In both cases the highest DT was observed in simulation 4. Both the simulations with smoke overlays have a higher DT than the simulations with no overlays for the same corridors, there is approximately 9% increase in DT for both groups when simulation 4 is compared with simulation 1. The highest difference in DT is between simulation 2 and 4 for group 1, where there is a 17% increase in the DT. Group 1 has a higher standard deviation (0.15) as compared to group 2 (0.08). Figure 11 shows the DT for both groups
Figure 12. Comparison of DT between group 1 and group 2 for all simulations.
4.3 Total Evacuation Time
The Total Evacuation Time (TET) takes into account the DT for each decision point and the path taken by the user to get to the exit. The current calculation of TET uses the maximum walking speed of 1.5 m/s and is the recommended time for the evacuation on the chosen path. The TET for
27 both groups is shown in the figure below. The TET for simulations 1 and 4 is the shortest for both groups and it has very similar in both cases. The highest TET is for simulation 3 in group 1 and the difference is significantly higher when compared to group 2, the TET in simulation 3 increases by approximately 154% in group 1 as compared to group 2. Overall the TET for group 1 is higher for all simulation as compared to group 2. The highest TET for group 2 is in simulation 2 and it falls in simulation 3 while for group 1 the TET in simulation 2 is lower. The TET for the simulations with overlays is higher for group 1 however, that is not always the case for group 2, where the TET for simulation 3 is lower than that for simulation 2.
Figure 13. Comparison of TET between group 1 and group 2 for all simulations.
4.4 Exit choice and Errors
The exit choice for group 1 has been for the familiar exit, while for group 2 its been the emergency exit, with a notable exception of simulation 4, where all 16 users chose the emergency exit instead of the familiar one, simulation 1 is also an exception where, all but one user chose the familiar exit. The biggest difference in exit choice between the two groups is for simulation 3, where all the users from group 1 chose the familiar exit but only 25% of the users from group 2 chose the
28 familiar exit. Only two errors were recorded in all the simulations, which were in the group 1 for simulations 3 and 4 (the simulations with the overlays)
4.5 NASA-TLX
The NASA-TLX can be performed in two ways, the first is to create an individual weighing of each dimension involved by asking the users to make pairwise comparisons based on their recognized importance, as a result the user has to select which dimension is the most important for the workload analysis, after calculation this leads to the weighted score. The second way for implementing the NASA-TLX is to ignore the pairwise comparison and just consider the raw values of the dimensions, and this is the method used here. This makes the test a “Raw TLX” and is known to increase the experimental validity (Hart, 2006). The values for the NASA-TLX go from 0-100 in each dimension and they are an aggregated to get the group values each for group 1, group 2 and the overall combined values.
The results for the test are shown in figure 14. All groups follow the same patterns, group 1 and group 2 show some variations in the results, with the highest difference in the Temporal Demand, which shows an 86% increase from group 2 to group 1. The difference in effort for both groups is also significant, with an 84% increase in the Effort from group 2 to group 1. Temporal Demand has the highest value amongst all scales followed by Mental Demand for all groups. Whereas the lowest value is for the performance scale, which means that the users graded their own performance as being very good (lower values indicate better performance). The overall task load for group 1 was 30.65, for group 2 was 23.125 and the combined was 26.875. All these scores are based on the standard scale used in NASA-TLX.
29 Figure 14. Results of the NASA-TLX for each group and combined.
30
Chapter 5
Discussion
This chapter provides a discussion and interpretation of the results of the study, it then explains how the results help answer the research question. The last part of the chapter deals with the limitations of the research.
5.1 Decision time & Total Evacuation Time
The Decision Time (DT) for both groups increases for the smoke overlay simulations, which means that it was harder for the users to decide which path to take when dealing with reduced visibility. The effect of reduced visibility on DT coincides with the results of other related studies, where the effect of visibility on evacuation time was found to be the same (Cirillo & Muntean, 2013; Jeon, Kim, Hong, & Augenbroe, 2011). The DT for group 1 is higher than the DT for group 2 as the people familiar with the building feel more at ease in the simulations, while the people not familiar with the building have the added burden of trying to make connections and look for the exit.
This is also observed in the Total Evacuation Time (TET), where the TET is higher for both simulations with overlays for group 1. The results of simulation 3 for group 2 don’t follow this pattern and can be taken as a counter argument for the observed effect, however during the case of simulation 3, there is another factor that needs to be considered, the distance to the exit. In simulation 3, the emergency exit is close to the start location but it is not easily visible, the reduced visibility of the smoke overlays only amplifies the difficulty in seeing the exit, which is why all the people from group 1, the group not familiar with the building, ignore the emergency exit and take the familiar exit which is much further away resulting in the massive increase in the TET, as shown in figure 15. The TET is the shortest for simulation 1 for both groups since the start location of the simulation is close to the exit, while the TET simulation 4 is also short for both groups as
31 the exit is close to the start location of the simulation, and the exit is more visible in both simulations. This is also supported by existing literature where a study by Vilar et al. (2013) showed that people favor paths that are brighter, have better visibility when choosing a route in emergency situations.
Figure 15. The results of simulation 3. All the users in Group 1 choose the familiar exit which is much further away, while 75% of the people in group 2 choose the emergency exit located close to the start point.
The huge difference in the TET for simulation 3 also shows that the effect of building familiarity can change based on the circumstances of the simulations. The complexity of the building might have an impact on the effect of building familiarity and needs to be studied further, requiring additional testing and simulations with more complex buildings (Chu & Yeh, 2012). The overall impact of DT on the TET is less than the impact of the route chosen as the DT is short when compared to the time taken to move from one decision point to the next.
32
5.2 Exit Choice and Errors
There were only two errors recoded in all of the tests that were conducted, both these errors were from the same user and in the simulations with smoke overlays. In both cases the user tried to choose a path that was invalid (dead-end) at a decision point. The reason for these errors was discovered after the study was completed when the user revealed that they got nervous because the fire alarm and the smoke overlays reminded them of the recent fire in their apartment.
In the previous section it was established that the route choice is more important than the DT for the TET, which leads to the importance of the exit choice. Overall, the results show that group 1 preferred the familiar exit while group 2 preferred the emergency exits. The exceptions to this rule is simulation 4, where all users chose the emergency exit. These results also coincide with the existing research which shows that the exit choice is effected by building familiarity and people tend to use familiar exits when they are not familiar with the building (Kinateder, Comunale, & Warren, 2018; Kobes et al., 2010).
5.3 NASA-TLX
The results of the NASA-TLX showed that the temporal demand was the highest of all the scales for all groups. This result shows that the goal of inducing stress in the users to increase the immersion and make the users treat the study as an actual evacuation was successful. The use of the fire alarm coupled with a time limit was able to make the users feel a sense of being rushed, which was the intent all along. The temporal demand is much higher for group 1 as compared to group 2 because of the familiarity with the building. This coincides with the existing literature as well and shows that the IVE simulations are able to correctly study the evacuation behavior (Vilar et al., 2013).
The mental demand is the second highest scale for all groups, which also points to the users having to think about the decisions being made, this demand was not that significant however as the DT for both groups was low. Low score in the performance scale means that the users rated their task completion as being very successful, which coincides with the results as all the users were able to
33 complete the evacuation scenarios and there were only 2 errors, which further establishes the viability of using the IVE simulations to study evacuation behavior and gain insights into parameters for evacuation models.
5.4 Research Question
The purpose of the thesis was to answer the research question “How to effectively use IVE as a tool for studying evacuation behavior and calibration parameters of evacuation models?”. The research question was answered by completing the different objectives set out in the start of the thesis. The first objective was to establish a state of the art of the evacuation models and calibration and this was completed in the second chapter, where the commonly used evacuation and calibration techniques were identified and the limitations of these were also found. VR in general and the IVE in particular was found to be a viable solution for many of the known problems associated with studying evacuation behavior like the lack of data and the lack of systematic studies.
The next two objectives dealt with investigating the impact of building familiarity and visibility on evacuation performance. This is the main part of the thesis and these two factors were chosen to demonstrate how the IVE simulations could be used effectively as a tool to study evacuation behavior and calibration parameters. These two factors were analyzed by conducting a user study based on the IVE simulations. During these simulations various parameters were calculated, like exit choice, decision time, total evacuation time, route choice and errors. The impact of building familiarity and visibility was then analyzed on all these parameters and the results from the study showed coincide with the existing literature. In addition to those results, additional insights were also gained into evacuation behavior and it was established that the route choice is the main contributing factor when studying total evacuation time. The results of the thesis can be used to help calibrate certain parameters of the evacuation models like the behavior of different agents at decision points and can also be used to validate the results of a model by looking at the exit choice and the total evacuation time.
34 The next objective was to investigate the performance and effectiveness of the IVE simulations for studying evacuation behavior. This was done by means of the NASA-TLX, the results of which show that the users considered the system to be effective and they gauged their performance to be very good. Since most of the results coincide with the existing literature, the viability of using IVE simulations for studying evacuation behavior can be established. Furthermore, this proves that the methodology used in the thesis provides a viable option of using the IVE as a effective tool for studying evacuation behavior and calibration parameters of evacuation models.
The results of the user study can be used to help calibrate the evacuation models for buildings similar to GEO-1 by modelling agent behavior based on the results. The TET is the most importance metric for measuring evacuation performance, and it is highly influenced by the route and exit choice.
5.5 Limitations
There are several limitations in the study that have become more apparent after analyzing the results. The first limitation is the number of simulations and the size of the simulations themselves, since the simulations are only taking place in one building it is not possible to generalize the result for different building structures and for more complex floorplans. The number of participants in each simulation is also another limitation having a larger dataset will help improve the reliability of the results and ensure that the behavior observed can be generalized.
Only one person takes parts in the simulation at a time, this is generally not the case emergency evacuations. During evacuations people are influenced by the behavior of people nearby and this needs to be taken into consideration as well. As the system stands now, it is not possible to study group behavior during evacuations.
Another limitation is the way the data is collected, the user is asked to point in the direction of the route they want to take at each decision point and this is not natural behavior. This reduces the ecological validity of the study as well. Although the users are given time to get back into the default running stance after making each decision, this behavior is still not ideal and must be improved to ensure maximum ecological validity.
35 The participants in the study all belong to a similar demographic, they are all students in the different departments of the University of Munster. To make a generalized evacuation plan it is necessary to have participants from different demographics. In the case of this thesis the impact of demographics is not that much since the study area was a part of the university campus where most of the people are students. For public buildings, a better sample of the population needs to be selected.
A user study conducted in a lab environment will always lack the ecological validity of actual evacuation drills, the physical effort and the stress experienced are just different. Although considerations were made to keep the ecological validity high and induce stress, by adding a time limit and a fire alarm, the difference still remain.
The parameters calculated for the calibration of the models need to be tested inside an actual evacuation model before the results can be said to be conclusive. As it stands now, the results are guidelines and follow the trends seen in previous research, but the concrete validation can only be done by using them for an actual evacuation model.
36
Chapter 6
Conclusion & Recommendation
6.1 Summary
The focus of the thesis is on demonstrating the IVE simulations as an effective tool for studying evacuation behavior and evacuation model calibration parameters. The first step in doing this was to understand the existing methods and their limitations. The focus was on evacuation models in general and then on the calibration of those models in particular. Different types of evacuation models were studied including Agent Based Models (ABMs), Cellular Automata and Social Forces models. The calibration techniques, like brute force and regression and sources of calibration data like historic and laboratory simulations were also investigated. The main limitation of the existing techniques was found to be the scarcity of data and the difficulty in obtaining new reliable data for calibration in particular and studying evacuation behavior in general. One solution to these issues is using VR to study the evacuation behavior and that is the core of this thesis.
The methodology for studying evacuation behavior was creating simulations in the IVE and conducting a user study based on those simulations. A total of 16 participants were found and then divided into two groups, Group 1 (not familiar with building) and Group 2 (familiar with building). These participants were then asked to complete the simulations (with smoke overlay and without smoke overlays) by finding the exit. During the simulations the effect of building familiarity and visibility were studied on the Route Choice, Exit Choice, Decision Time (DT) and Total Evacuation Time (TET). Users were also asked to fill out a NASA-TLX form to gain feedback about the effectiveness of the system and to assess the performance.
The results from the study showed that building familiarity improves evacuation performance, and that lower visibility has a negative impact on the evacuation performance. The results established the route choice as being the main contributing factor in the TET and recognized the effectiveness
37 of the system by means of the NASA-TLX results. The results of the study coincide with the findings of existing literature and that shows the viability of using IVE simulations for studying evacuation behavior and evacuation model calibration parameters.
6.2 Future Work & Recommendations
The focus of this thesis was to discover how the IVE simulations could be used for calibration of evacuation models, due to time constraints, only a few parameters were chosen to be studied and only one building was used, the natural extension of the work is to include more parameters in the study and increase the scope of the simulations as well. Adding additional buildings with more simulations will help corroborate the results, increasing the number of users in each simulation will also help improve the study. The study should be repeated using a different group of participants and a different building, with the same level of complexity to check if the results are reproducible and if they can be generalized for similar building types.
The measurement of the DT was done by taking time stamps from the user interactions, automating this process by incorporating motion sensing technology will help improve the accuracy of the measurements of all user interactions.
Performing an actual evacuation drill will be ideal to gather real world data that can be used to compare the results of the study. Recording the behavior of people in an evacuation drill and seeing how the study results differ or coincide will add legitimacy to the whole study.
Extending the IVE to add support for 3D models in the simulations will allow additional parameters to be studied, including the effect of nearby people on the evacuation (herd behavior).
6.3 Conclusion
This study shows that the IVE simulations allow us to study the evacuation behavior in a safe, reliable way with the results of this study coinciding with existing literature. The performance of
38 the system and its effectiveness was determined using the results of the NASA-TLX scale and was deemed at acceptable levels by the users as shown by the low score in the performance (16.25) of the NASA-TLX, the users also felt that they were in an evacuation situation as shown by high values of temporal demand (39.375) and mental demand (35.625). All simulations were completed successfully with each user getting to the exit in time and only 2 errors occurring in total.
The effect of building familiarity on evacuation performance was observed and the performance of people familiar with the building was better than the people not familiar with the building having a 20% higher DT on average across all simulations and a higher TET which coincides with the available literature (Vilar et al., 2013).
The evacuation performance suffers when the visibility decreases, with the simulations with smoke overlays having a higher DT and TET for both groups which coincides with the literature as well (Guo, Huang, & Wong, 2012; Jeon et al., 2011).
39
Bibliography
Alaska, Y. A., Aldawas, A. D., Aljerian, N. A., Memish, Z. A., & Suner, S. (2017). The impact of crowd control measures on the occurrence of stampedes during Mass Gatherings: The Hajj
experience. Travel Medicine and Infectious Disease, 15, 67–70.
https://doi.org/10.1016/j.tmaid.2016.09.002
Almeida, J. E., Kokkinogenis, Z., & Rossetti, R. J. F. (2012). NetLogo implementation of an evacuation scenario. Iberian Conference on Information Systems and Technologies, CISTI, 1–4.
Braun, A., Bodmann, B. E. J., & Musse, S. R. (2006). Simulating virtual crowds in emergency situations. Proceedings of the ACM Symposium on Virtual Reality Software and Technology, VRST, 2006, 244–252.
Chu, J. C., & Yeh, C.-Y. (2012). Emergency Evacuation Guidance Design for Complex Building
Geometries. Journal of Infrastructure Systems, 18(4), 288–296.
https://doi.org/10.1061/(ASCE)IS.1943-555X.0000080
Cirillo, E. N. M., & Muntean, A. (2013). Dynamics of pedestrians in regions with no visibility - A lattice model without exclusion. Physica A: Statistical Mechanics and Its Applications, 392(17), 3578–3588. https://doi.org/10.1016/j.physa.2013.04.029
Daamen, W., & Hoogendoorn, S. (2012). Calibration of pedestrian simulation model for emergency doors by pedestrian type. Transportation Research Record, (2316), 69–75. https://doi.org/10.3141/2316-08
Dal Ponte, S. T., Dornelles, C. F. D., Arquilla, B., Bloem, C., & Roblin, P. (2015). Mass-casualty Response to the Kiss Nightclub in Santa Maria, Brazil. Prehospital and Disaster Medicine, 30(1), 93–96. https://doi.org/10.1017/s1049023x14001368
Faulkner, L. (2003). Beyond the five-user assumption: Benefits of increased sample sizes in usability testing. Behavior Research Methods, Instruments, & Computers, 35(3), 379–383. https://doi.org/10.3758/BF03195514